

This report is powered by Tridge Eye Data Intelligence.
Every data point, price signal, and supply risk insight in this analysis comes from the same platform that procurement and sourcing leaders worldwide rely on daily. As you read, consider what this level of market intelligence could do for your sourcing decisions.
Winged-bean-flour is a niche, quality-sensitive ingredient where “cheapest per kg” often becomes “most expensive in total cost” once you account for rejects, re-testing, and line variability. This guide translates the physical supply chain (seed → processing → flour → distribution) into procurement levers you can use in RFQs, qualification plans, and contracts—without assuming deep category expertise.
(Analyzed at: Apr, 2026)
Want to see these cost dynamics in real time? Tridge Eye tracks price shifts across every node of this supply chain — daily. Get my live market data →
Winged-bean-flour is a thin, quality-sensitive ingredient chain: smallholder-grown seeds move through cleaning/dehulling + heat treatment + milling before export into developed markets. The fixed cost-drivers are structural: (1) post-harvest drying discipline (mold/mycotoxin risk), (2) limited food-grade processing capacity that can consistently hit microbiological and functional specs, and (3) multi-hop logistics (aggregators → processors → exporters/importers) that add margin and extend lead time.
So what for procurement? Your unit price is often a proxy for: reject risk (moisture/mold), yield loss (dehulling/cleaning), and whether the supplier can deliver qualified, spec-compliant capacity (not just “available volume”). The biggest levers are spec normalization, qualification sequencing, and contract structures that pay for compliance—not promises.
Insight: Winged-bean-flour is not one product; it’s a family of flours whose performance depends on how the seed was dried, dehulled, heat-treated, and milled.
Data: Mature winged bean seeds are widely reported in the literature at roughly 30–37% crude protein and ~15–18% fat (ranges vary by variety and basis), which supports both their nutrition value and their oxidation/rancidity sensitivity versus lower-fat pulses if moisture/oxygen control is weak. Processing (including heat treatment) is also discussed as a way to reduce anti-nutritional factors and shift functionality. [1]
Procurement impact (quick win): Map your supply chain in five physical nodes:

If your RFQ only asks for “winged bean flour, protein X%,” you’ll get quotes that are not comparable—and the cheapest offer often embeds downstream costs (extra testing, higher rejects, line variability).
Key insight: In this category, quality assurance and yield loss are cost centers, not overhead. Costs concentrate at the points where moisture/mold is controlled and where flour is made “export-grade” (micro + documentation + packing).
Insight → The seed’s value is set less by “acre economics” and more by drying discipline and defect rate (mold, insect damage, foreign matter).
Data → Aflatoxin/fungal risk literature consistently ties contamination to inadequate drying and poor storage; safe-storage guidance is often framed via moisture content / water activity and relative humidity thresholds rather than a single universal % for all commodities. Legumes are commonly cited as needing lower moisture than cereals for safer storage, and many references use the ~10–12% range for legumes (context-dependent). [2]
Procurement impact → Treat origin seed as a risk-priced input:
Typical cost drivers: labor-intensive harvest/handling, drying energy/infrastructure, quality rejects, farmgate competition with other cash crops.
Insight → This node quietly creates your biggest variance: blending lots improves volume but can blend risk (one bad lot contaminates the average).
Data → Post-harvest handling, storage hygiene, and moisture control are repeatedly identified as primary drivers of fungal contamination risk across grains/legumes; risk rises with delays, re-wetting during drying, and uncontrolled storage humidity. [3]
Procurement impact → In supplier approval, ask “Who owns aggregation?” If it’s outsourced:
Typical cost drivers: shrink/waste, bagging, local transport, working capital, informal margin stacking.
Insight → Dehulling and heat treatment are where “cheap seed” becomes “usable flour”—and where yield losses and energy costs show up.
Data → Reviews on winged bean emphasize seed composition and note anti-nutritional factors in seeds; processing/heat treatment is commonly discussed in the broader legume context as a mitigation pathway and as a driver of functional outcomes. [1]
Procurement impact → Separate quotes by process route:
Typical cost drivers: cleaning losses, dehulling yield loss, energy for thermal step, foreign matter control (magnets/metal detection), labor.
Insight → This is the “capability bottleneck.” Many operators can mill; fewer can consistently meet micro limits, documentation, and functional consistency.
Data → Academic work across legume flours shows that functionality is sensitive to composition, processing, and particle size distribution (PSD). Even when two flours are “the same mesh,” different mills/routes can yield different PSD and water-binding behavior—one reason end-product performance can drift batch to batch. [4]
Procurement impact → Build your spec around what actually drives TCO:
Typical cost drivers: milling energy + wear parts, HACCP/GMP programs, routine testing (micro, moisture), rework, packaging materials, and compliance documentation.
Insight → In thin markets, distribution often adds both service value (inventory, paperwork) and margin opacity.
Data → Winged bean is widely described as an underutilized crop with growing research/interest; niche ingredients typically move through specialty channels and can involve multiple handling/storage steps that increase exposure time to humidity and quality drift. [5]
Procurement impact → Decide deliberately whether you want:
Typical cost drivers: ocean freight + insurance, port fees, customs brokerage, warehousing, inventory carrying cost, distributor margin.
Directional model for procurement thinking (not auditable should-cost). Assumes export-grade flour delivered to a developed-market buyer; actual ratios vary by origin, certifications, and shipment size.
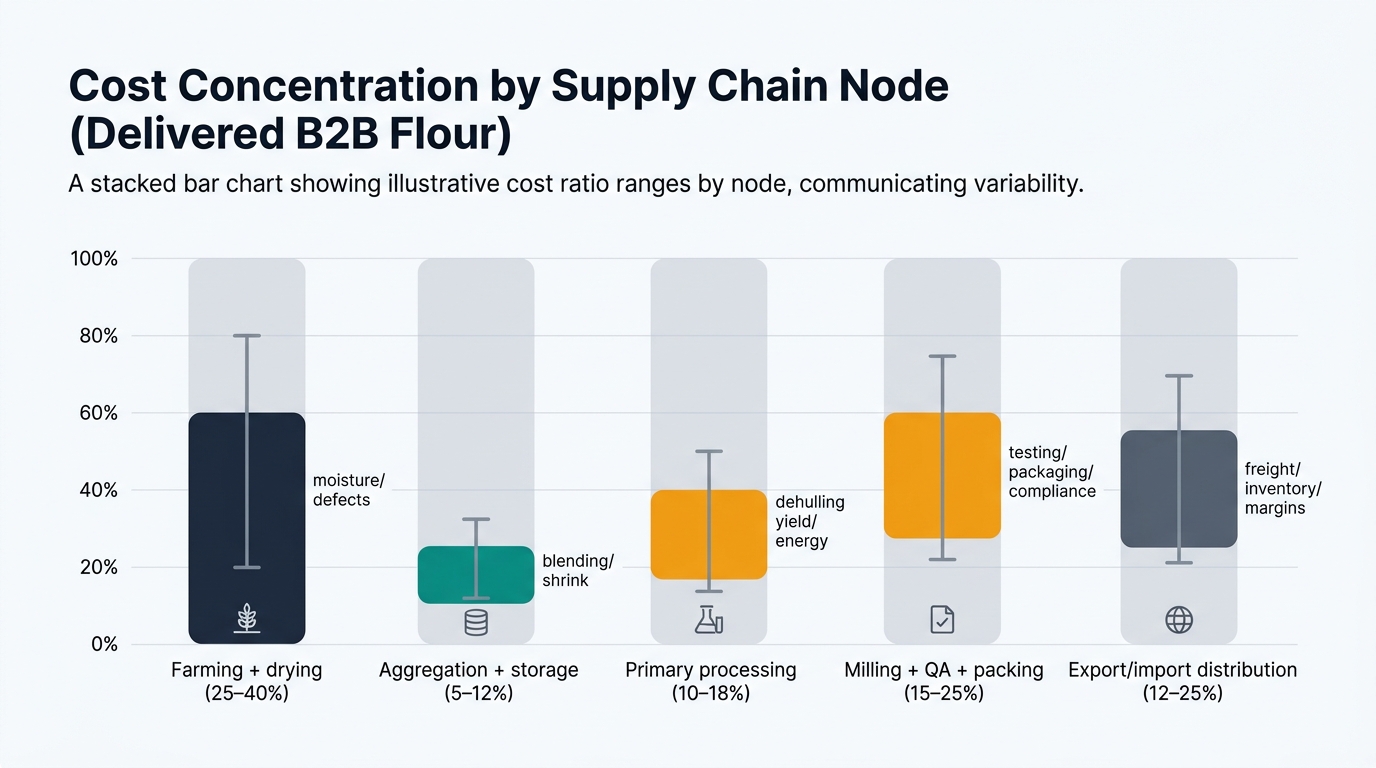
| Supply chain node | Cost ratio (% of delivered cost) | What usually explains variance | Buyer control lever |
|---|---|---|---|
| Farming + drying | 25–40% | moisture/defects, farmgate competition | moisture/defect specs; lot testing |
| Aggregation + storage | 5–12% | blending, shrink, local logistics | segregation rules; traceability |
| Primary processing | 10–18% | dehulling yield loss, energy | define process route in RFQ |
| Milling + QA + packing | 15–25% | testing, rework, packaging, compliance | micro/PSD specs; change control |
| Export/import distribution | 12–25% | freight, inventory, margin stacking | Incoterms + inventory strategy |
| Product form | What changes physically | Hidden cost risk if unspecified |
|---|---|---|
| Whole-seed flour | higher fiber/ash; darker color | inconsistent texture, higher grit, taste drift |
| Dehulled flour | lower fiber/ash; lighter color | yield loss cost embedded; tighter supply |
| Heat-treated/roasted flour | altered flavor; different functionality | energy cost; functional shift vs. raw |
| Defatted / protein-enriched (less common) | lower fat; different water absorption | higher capex/QA; fewer qualified suppliers |
| Spec element | Why it matters | Procurement-friendly way to write it |
|---|---|---|
| Protein & fat (as-is basis) | winged bean is naturally high-protein and relatively high-fat; fat affects oxidation and functionality | “Protein min X% (as-is); fat target range Y–Z% (as-is)” |
| Moisture max | mold/caking risk | “Moisture ≤ X%; COA per lot; method stated” |
| Micro limits | export-grade gate | “TAMC/yeast-mold/pathogens per your standard; method stated” |
| Particle size distribution | line performance | “PSD target (e.g., D90) + sieve/laser method stated” |
| Process declaration | comparability | “Dehulled? Heat-treated? Route documented; no changes without approval” |
Insight → Many suppliers can offer flour; fewer can offer repeatable functional performance + documentation.
Data → Research on winged bean composition and processing consistently highlights variability by variety and processing route; that variability is real and process-linked. [1]
Procurement impact → Qualification should be staged: documentation → sample → pilot → commercial. Do not award on price before you know the process route is stable.
Insight → In humid tropics, drying and storage are the difference between edible and rejected lots.
Data → Food-loss and aflatoxin guidance repeatedly emphasizes moisture/water activity and storage humidity (often citing ~70% RH as a practical “safe” threshold for many stored commodities, with commodity-specific equilibrium moisture content). [3]
Procurement impact → Put moisture and storage controls into contracts and supplier scorecards; otherwise you pay later in rejects and expediting.
Insight → Low transparency means distribution layers can widen spreads quickly.
Data → Winged bean is still widely described as underutilized and grown largely at small scale in tropical regions; that pattern typically correlates with fragmented supply and reliance on specialty channels for export-grade ingredients. [5]
Procurement impact → Your governance should track how many hops exist between mill and your dock—and what each hop owns (inventory, QA, claims).
Logical next step (analysis, not promotion): The hardest procurement problem to solve here is not “finding a supplier”—it’s maintaining a clean, comparable dataset across suppliers (process route, COA history, micro performance, lead times, and claim rates) so you can explain price differences and award decisions with audit-grade rationale while still moving fast when supply tightens.

See These Cost Structures Shift in Real Time
Tridge Eye — The supply chain breakdown you just read is a snapshot. Costs, margins, and risk profiles change daily — and the teams that track them in real time consistently out-source their competitors.


