
This report is powered by Tridge Eye Data Intelligence.
Every data point, price signal, and supply risk insight in this analysis comes from the same platform that procurement and sourcing leaders worldwide rely on daily. As you read, consider what this level of market intelligence could do for your sourcing decisions.
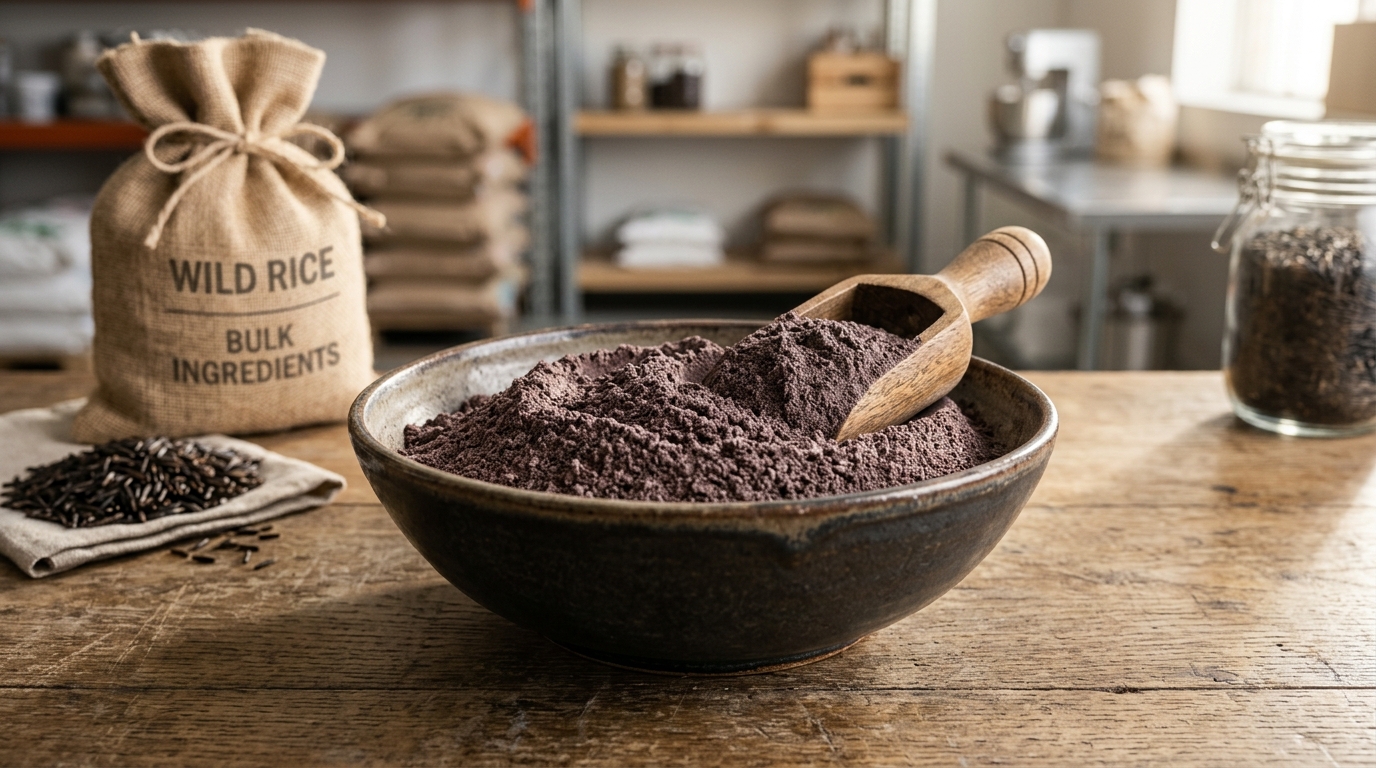
Wild-rice-flour looks like “just another gluten-free flour” on a spec sheet, but it behaves like a specialty, harvest-driven ingredient with a comparatively narrow qualified supplier bench. This guide is written for procurement and sourcing managers who are strong operators in other categories and want a practical, decision-first way to source wild-rice-flour with fewer surprises—across total cost, continuity of supply, resilience, and audit-ready governance.
(Analyzed at: Apr, 2026)
Wild-rice-flour is not a commodity flour with a deep global supplier bench. It’s a niche, North America–concentrated ingredient whose availability and cost are shaped by:

Reality check on supply concentration (cultivated side): University of Minnesota sources describe Minnesota as the top cultivated wild rice producing state, with cultivated production on ~11,000 acres yielding around ~15 million pounds of finished grain annually (order-of-magnitude indicator, not a guaranteed yearly output). [2]
For wild-rice-flour, processing and compliance costs are not “overhead”—they are structural. Your delivered price is often less about farmgate alone and more about:
Below is an illustrative cost build-up to help procurement leaders reason about negotiations and should-cost. Actual ratios vary by spec tightness, claims (organic/GF), packaging format, and whether you buy direct or via distribution.
Modeled to show where costs concentrate by product form, not to imply a universal benchmark.

| Supply Chain Node | Cost Ratio (% of Delivered Cost) | What moves it most |
|---|---|---|
| Upstream raw rice | 40% | Harvest outcome; inventory tightness |
| Primary processing | 18% | Drying/parching energy; yield losses |
| Secondary processing (milling) | 15% | Grind size; throughput; segregation |
| Packaging & QA | 8% | COAs, claim documentation, barrier bags |
| Logistics & distribution | 9% | LTL vs truckload; distance; warehousing |
| Supplier/distributor margin | 10% | Service level, MOQ flexibility |
| Supply Chain Node | Cost Ratio (% of Delivered Cost) | What moves it most |
|---|---|---|
| Upstream raw rice | 32% | Raw availability, but diluted by processing overhead |
| Primary processing | 18% | Energy + grading stringency |
| Secondary processing (milling) | 22% | Fine grind losses + sanitation/changeovers |
| Packaging & QA | 10% | Higher testing cadence; GF documentation |
| Logistics & distribution | 8% | Specialty lanes, smaller drops |
| Supplier/distributor margin | 10% | Risk premium, capacity constraints |
| Supply Chain Node | Cost Ratio (% of Delivered Cost) | What moves it most |
|---|---|---|
| Upstream raw materials (multi-grain) | 38% | Prices of blend components |
| Primary processing | 10% | Less wild-rice-specific processing share |
| Secondary processing (milling/blending) | 20% | Blend accuracy, segregation, batching |
| Packaging & QA | 10% | Allergen/GF controls across inputs |
| Logistics & distribution | 10% | More nodes, more inbound lines |
| Manufacturer/distributor margin | 12% | Formulation + service level |
If you remember one structural reality for wild-rice-flour sourcing, it’s this:
Wild-rice-flour pricing can appear “sticky” or disconnected from upstream conditions because:
Flour is widely treated as a raw food and has been linked to Salmonella outbreaks, including an FDA-investigated outbreak tied to recalled flour (April 2023). [3]
Even though wild-rice-flour is a different input than wheat flour, the procurement takeaway is the same: low-moisture powders can carry pathogen risk, and thermal inactivation can be more challenging at low water activity than teams intuitively expect. [4]
Common “silent single-source” spec traps:
Start from the decision you’re making, then use intelligence to shorten cycle time and reduce “unknown unknowns.”
An intelligence-driven workflow typically improves outcomes by:
Procurement teams sourcing wild-rice-flour often also touch other “specialty + claim-sensitive” categories with similar structural dynamics:
The transferable lesson: in specialty ingredients, resilience and governance are part of unit cost—ignoring them usually increases total cost of ownership.
Wild-rice-flour is a clean test case because it forces the behaviors that separate high-performing procurement organizations:
If procurement leadership can build a repeatable, intelligence-driven operating model here, it typically generalizes well to other specialty, claim-sensitive ingredients where cost, risk, resilience, and auditability all matter at once.
Make Faster, Data-Driven Sourcing Decisions
The insights in this report are just the starting point. Tridge Eye is the data intelligence solution that gives procurement and sourcing leaders real-time market signals, price benchmarks, and supply risk alerts — so you can act before the market moves.


