INDUSTRY TRENDS

Whey Powder Sourcing: The Procurement Guide to Cost Drivers, Spec “Micro‑Markets,” and Supply Continuity

Author
Team Tridge
DATE
March 31, 2026
10 min read
whey-powder Cover
Tridge Eye Data Intelligence Solution

This report is powered by Tridge Eye Data Intelligence.

Every data point, price signal, and supply risk insight in this analysis comes from the same platform that procurement and sourcing leaders worldwide rely on daily. As you read, consider what this level of market intelligence could do for your sourcing decisions.

Explore Tridge Eye →

Whey powder looks like a simple commodity until you try to switch suppliers or negotiate through a cycle. This guide gives procurement and sourcing managers a practical “mental model” for whey: where supply really comes from (cheese), why specs create separate micro-markets, and which parts of the cost stack are actually negotiable. It’s written to help you make defensible decisions that balance unit price with continuity, quality risk, and governance.

Executive Summary

  • Structural reality: Whey is a co-product of cheese/casein manufacturing, so short-term supply is constrained by cheese plant run rates—not by “planting more whey.”
  • Specs create micro-markets: Tight limits (ash/minerals, micro, solubility/heat history, certifications, documentation) shrink the eligible supplier pool and turn negotiations into “capacity access.”
  • Cost isn’t just milk: For powders, utilities + evaporation/spray drying uptime + yield + QA/compliance + freight can drive price moves even when milk prices soften.
  • Negotiation unlock: Separate price discussions into market movement (milk/cheese + energy + freight) vs supplier-specific premium (spec tightness, service level, allocation behavior, documentation burden).
  • Governance win: Measure performance beyond unit price: landed cost variance, OTIF/service level, lead-time stability, quality incident rate, supplier/origin concentration, and time-to-qualify alternates.

Key Insights

  • Analyzed at: Mar, 2026
  • Strategy: Hold
  • Reliability: Medium
  • Potential Saving: 4% ~ 10%
  • Insight: Near-term dairy commodity indicators (early-2026 firmness in global dairy pricing) suggest the market is not in a clear “buy the dip” window. For whey powders, the better move is to hold core contract coverage while using competitive benchmarking to remove supplier-specific premiums (service/spec/compliance) and to pre-qualify alternates so you can capture savings quickly if Q2–Q3 pricing softens. Prioritize RFQs for lanes where freight and allocation risk have historically inflated landed cost variance more than the FOB price.

1) Start with the Ground Truth: How Whey Powder Actually Flows (and why procurement feels “stuck”)

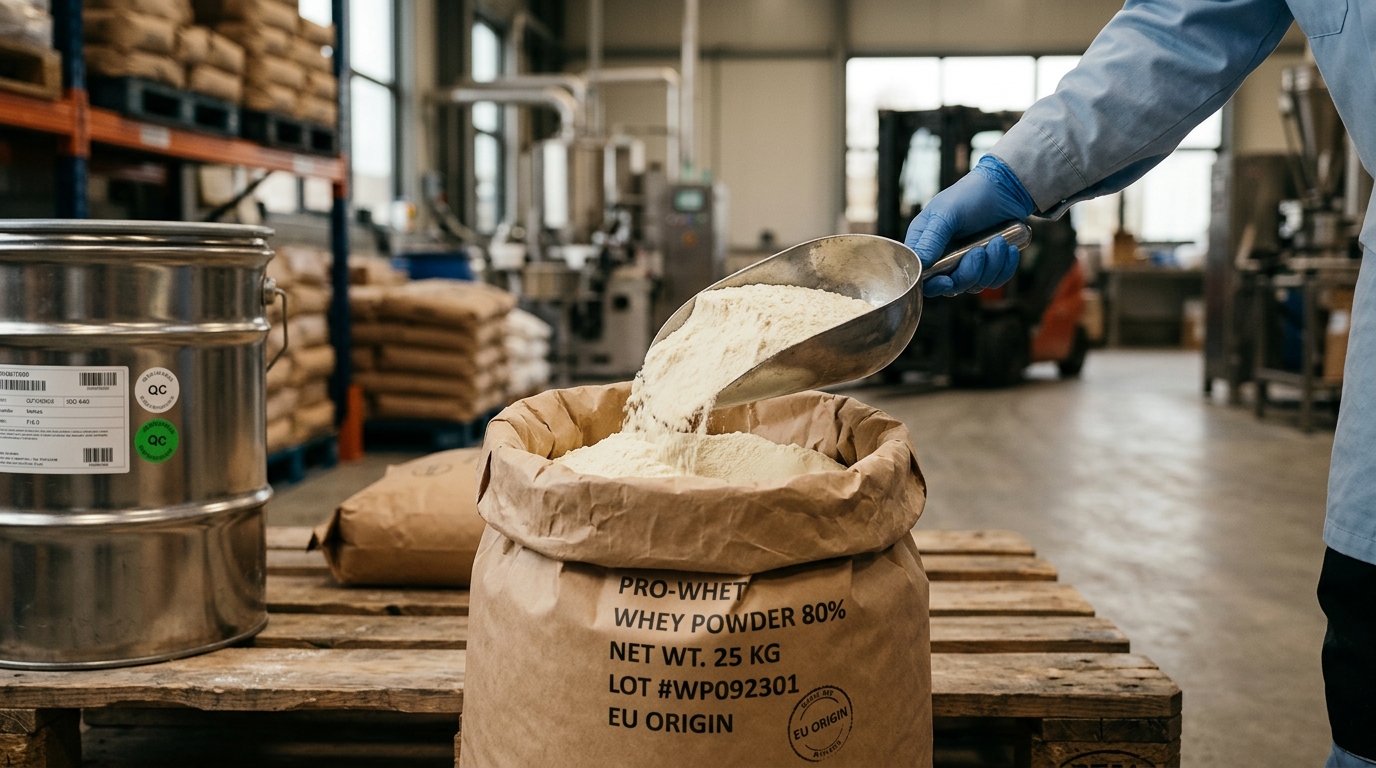
Whey powder is not a standalone agricultural crop you can “just source more of.” It is structurally tied to cheese (and casein) production: whey is generated as a co-product, then upgraded through concentration, filtration (for proteins), demineralization (for infant/clinical), and finally spray drying. (USDA and ADPI definitions align on dry whey being whey with water removed, keeping other constituents in the same relative proportions.)

Practical implication for procurement

  • When cheese output shifts (milk economics, plant schedules, consumer demand), whey availability and product mix can change—sometimes faster than your contract cycles.
  • The “same” whey powder can behave differently in your application because heat history + mineral balance + particle properties affect solubility, flavor, and performance.

The simplified whey ingredient supply chain (what to anchor your category strategy on)

  1. Upstream milk & cheesemaking → creates liquid whey (sweet whey is the dominant base for most commercial powders)
  2. Primary processing (clarify/separate fines & cream, pasteurize, evaporate) → concentrates solids and stabilizes hygiene
  3. Secondary processing (UF/DF membranes for WPC/WPI; demineralization for DWP; lactose/permeate streams)
  4. Drying + packaging + QA (spray drying is a key cost/quality gate)
  5. Logistics (ambient powders, containerized trade; landed cost can swing with freight)
  6. End markets (food manufacturing, sports nutrition, infant/clinical, feed)
A left-to-right flowchart showing how whey powder supply is structurally generated and upgraded: Milk Intake → Cheesemaking/Casein Production (creates liquid whey as co-product) → Primary Processing (clarify/separate fines & cream, pasteurize, evaporate) → Secondary Processing decision split (A: Standard SWP; B: Membrane filtration UF/DF to WPC/WPI; C: Demineralization to DWP) → Spray Drying → Packaging + QA/COA → Logistics (domestic/international lanes) → End Markets (food, sports nutrition, infant/clinical, feed). Include callouts that cheese plant run rates constrain short-term whey supply and that spec tightness shrinks eligible supplier pool.

2) Where the Money Goes: Cost & Margin Build-Up by Node (what you can and can’t negotiate)

Key insight (procurement lens)

Whey powder cost is “built” by utilities + yield + quality risk + logistics, not just raw milk. The same whey stream can be sold as standard dry sweet whey, upgraded into WPC/WPI, or demineralized for sensitive applications—so suppliers optimize product mix based on margin and demand.

That means your price outcome depends on:

  • Your spec tightness (how many plants can actually make it)
  • Energy intensity (evaporation + spray drying)
  • Co-product economics (protein streams vs permeate/lactose)
  • Allocation behavior in tight markets (who gets volume first)

Below is the node-by-node cost logic procurement teams should use when building negotiation hypotheses.

2.1 Upstream / Raw Material: Milk + Cheese Economics (the “hidden” driver)

What’s happening:

  • Whey is generated when milk is converted into cheese (or casein). If cheese runs hard, whey stream rises; if cheese margins compress or production shifts, whey availability can tighten.

Cost drivers you should track:

  • Milk price and seasonal milk flows in key dairy basins
  • Cheese plant utilization and planned shutdowns
  • Incentives to divert whey solids into higher-margin derivatives (WPC/WPI)

Procurement takeaway:

  • You rarely win by arguing “milk is down, therefore whey must be down.” Suppliers can counter with: energy, demand pull, or better alternative margin in proteins.

2.2 Primary Processing: Clarification, Pasteurization, Evaporation (where yield and hygiene start)

What’s happening:

  • Liquid whey is clarified/separated (remove fines and whey cream), heat-treated, and evaporated to raise solids before drying. This step sets up microbiological stability and impacts downstream powder quality.

Cost drivers:

  • Utilities for evaporation
  • Yield losses (fines removal, moisture targets)
  • Quality controls (micro, antibiotics, foreign matter)

Procurement takeaway:

  • If you see frequent lot-to-lot variability, it may be upstream/primary processing consistency—not “just QA testing.”

2.3 Secondary Processing: Membranes (WPC/WPI) + Demineralization (DWP) (where specs shrink your supplier pool)

What’s happening:

  • WPC/WPI are produced primarily using membrane filtration (ultrafiltration, often with diafiltration) to remove lactose/minerals relative to protein and increase protein content.
  • Demineralized whey powder (DWP) reduces mineral/ash content (often referenced commercially as D50/D70/D90) for sensitive applications.

Cost drivers:

  • Capex recovery and operating cost of membranes/demineralization systems
  • Extra QA and tighter segregation
  • Higher scrap/rework risk when specs are tight

Procurement takeaway:

  • The moment you move from standard dry sweet whey to a tighter band (low ash / high solubility / infant-grade expectations), you’re not negotiating “a commodity” anymore—you’re negotiating capacity access + compliance execution.

2.4 Drying + Packaging + QA: Spray Drying Is the Cost and Quality Gate

What’s happening:

  • Most whey powders are produced via spray drying, which improves shelf stability but is energy intensive and sensitive to operating conditions.

Cost drivers:

  • Natural gas/electricity/steam for dryers
  • Downtime risk (a large dryer outage tightens supply fast)
  • Packaging (25kg bags, liners, palletization) + traceability documentation

Procurement takeaway:

  • In negotiations, ask for: dryer redundancy, maintenance windows, and how the supplier controls scorched particles/insolubility (common functional complaints and a real spec/grade topic in standards).

2.5 Logistics & Distribution: Landed Cost Can Flip Your “Cheapest” Supplier

What’s happening:

  • Whey powders ship ambient and are container-friendly, but for lower-value streams (standard whey/permeate) freight can dominate delivered cost when ocean rates spike.

Cost drivers:

  • Inland freight to port, container availability, ocean rates
  • Transit time variability (inventory carrying cost)
  • Import documentation and inspection risk

Procurement takeaway:

  • Your category strategy should separate FOB price competitiveness from delivered reliability.

2.6 End Markets: Demand Pull Is Not Uniform (food vs sports vs infant vs feed)

What’s happening:

  • Dry sweet whey is used broadly across bakery, process cheese, frozen desserts, sauces, beverages, confections, and more (this is explicitly reflected in industry standards/guidance).
  • Higher-grade derivatives (WPC/WPI, DWP) can tighten availability for standard grades when capacity is constrained.

Procurement takeaway:

  • When higher-margin derivative demand is strong, suppliers may prioritize those streams, tightening spot availability for standard powders.
A 3-bar stacked chart comparing illustrative delivered-cost ratios for Sweet Whey Powder (SWP), WPC 80, and Demineralized Whey Powder (DWP 90). Each bar is segmented into: Upstream milk/cheese economics, Primary processing, Secondary processing, Drying + Packaging + QA, Logistics & Distribution, and Supplier/Channel margin, using the article table percentages (SWP: 20/15/5/30/15/15; WPC80: 15/10/30/25/10/10; DWP90: 15/10/35/20/10/10). Includes a note: Illustrative ratios—use for negotiation framing, not cost audit.

Product-level cost breakdown (illustrative ratios by product form)

These are modeled “typical” ratios to help procurement think in cost build, not accounting. Actuals vary by origin, plant efficiency, certification burden, and market tightness. Use these as a negotiation framing tool, not as a supplier cost audit.

A) Sweet Whey Powder (SWP) — food grade

Supply Chain Node Cost Ratio (% of Delivered Cost) Why it matters in procurement
Upstream milk/cheese economics 20% Co-product availability and cheese run rates set the base
Primary processing 15% Hygiene + yield losses start here
Secondary processing 5% Limited (mostly standardization)
Drying + Packaging + QA 30% Energy + dryer uptime are the swing factors
Logistics & Distribution 15% Freight and lead time volatility
Supplier/Channel margin 15% Allocation premium appears here in tight markets

B) WPC 80 (Whey Protein Concentrate ~80%)

Supply Chain Node Cost Ratio (% of Delivered Cost) Why it matters in procurement
Upstream milk/cheese economics 15% Still co-product linked
Primary processing 10% Quality consistency matters
Secondary processing 30% Membranes + higher QA + segregation
Drying + Packaging + QA 25% Heat history affects solubility/functionality
Logistics & Distribution 10% Higher value-to-weight reduces freight sensitivity
Supplier/Channel margin 10% Premium for consistency and service

C) Demineralized Whey Powder (DWP 90)

Supply Chain Node Cost Ratio (% of Delivered Cost) Why it matters in procurement
Upstream milk/cheese economics 15% Same base stream
Primary processing 10% Incoming variability impacts downstream
Secondary processing 35% Demineralization systems + tight controls
Drying + Packaging + QA 20% Consistency + documentation expectations
Logistics & Distribution 10% Often shipped globally
Supplier/Channel margin 10% Capacity access + compliance premium

3) The Structural Fact You Must Build the Strategy Around: Whey Is a Co-Product, but Specs Create “Micro-Markets”

Two things are true at the same time:

  • Whey availability is linked to cheese production (supply is partly “inelastic” in the short run).
  • Your spec creates a separate market (solubility, ash/minerals, micro limits, heat treatment history, certifications, and documentation can shrink eligible supply dramatically).

Even within “dry sweet whey,” specs and grade requirements vary (micro limits, moisture, fat, scorched particles, and more are explicitly defined in U.S. Extra Grade standards; ADPI standards add additional expectations and testing options).

Procurement management implication:

  • Category strategy should explicitly define spec-flex bands approved by QA/R&D (what can flex without breaking the application).

4) The Critical Insight: Why “Milk Down” Doesn’t Automatically Mean “Whey Down”

Procurement teams often expect whey pricing to track milk prices cleanly. In practice, whey pricing can disconnect because:

  1. Energy and drying economics can dominate (evaporation + spray drying are utility-heavy; when energy is volatile, conversion cost moves faster than milk).
  2. Product mix optimization: suppliers can divert whey streams into higher-margin WPC/WPI or specialty demineralized grades, tightening standard supply.
  3. Demand is segmented: food manufacturers, sports nutrition, infant/clinical, and feed don’t move in sync.
  4. Freight changes the delivered-cost ranking: a supplier that is “cheap” on FOB can become expensive on landed cost when lanes tighten.

How to use this insight in negotiations:

  • Separate your negotiation into (a) market movement and (b) supplier-specific premium for service/spec/compliance.
  • Ask suppliers to explain price changes by buckets: milk/cheese economics, utilities, packaging, freight, and allocation.

5) Where Procurement Teams Typically Get Whey Powder Wrong (and why it causes firefighting)

  1. Treating whey powder as a single commodity
  2. Reality: SWP vs WPC vs DWP are different cost structures and risk profiles.
  3. Over-specifying “just in case”
  4. Tighter specs reduce functional risk but can shrink the supplier pool and raise allocation risk.
  5. Qualifying alternates only after disruption hits
  6. QA becomes the bottleneck; procurement ends up paying peak spot premiums.
  7. Measuring savings only as unit price
  8. Misses the real objective: landed cost variance, service level, and disruption cost.
  9. Ignoring co-product logic in supplier conversations
  10. Suppliers optimize for portfolio margin; if you don’t understand what they can sell instead, you misread leverage.

6) How an Intelligence-Driven Sourcing Approach Changes the Outcome (without feature-dumping)

Capabilities that matter for whey powder decisions

A) Price intelligence & driver monitoring

  • Build a weekly view of what’s moving: milk/cheese signals, utilities, freight, and demand pull by end market.
  • Output you can use: a driver-based should-cost narrative to challenge “because the market” pricing.

B) Supplier benchmarking & qualification support

Compare suppliers on:

  • Lead time stability and allocation behavior
  • Quality systems, audit readiness, and deviation frequency
  • Spec capability (ash bands, solubility, micro limits)

Output you can use: a scorecard that QA/Ops/Finance can actually sign off on.

C) Alternative supplier identification (resilience planning)

  • Pre-map alternates by region and by spec-flex band (e.g., SWP food grade vs low-ash DWP).
  • Output you can use: a dual-sourcing lane design (primary/secondary/spot).

D) Supply chain risk monitoring

Set action triggers tied to procurement moves:

  • If lead times extend by X days → release RFQ to alternates
  • If quality incidents exceed X per quarter → tighten incoming testing + shift split

E) Procurement performance analytics

Track category health with management-grade KPIs:

  • Landed cost variance
  • OTIF/service level
  • Supplier concentration (share by supplier/origin)
  • Time-to-qualify alternates

7) Strategic Use Cases Procurement Leadership Can Run (repeatable playbooks)

Use case 1: Reduce cost volatility without breaking functionality (best starting point)

Workflow:

  1. Define application-critical specs (with QA/R&D): protein, ash/minerals, solubility/reconstitution, micro limits, flavor.
  2. Create spec-flex bands (e.g., “core” vs “acceptable alternate”)
  3. Build a supplier universe segmented as:
  4. Primary (full spec)
  5. Secondary (alternate spec band)
  6. Emergency/spot (tight lead time, higher risk)
  7. Use driver monitoring to set negotiation triggers:
  8. Re-open pricing when utilities or freight normalize
  9. Lock coverage when allocation signals appear

Trade-off made explicit:

  • Widening specs increases supplier options and lowers allocation risk, but requires disciplined validation and stakeholder sign-off.

What to measure:

  • Landed cost variance (month-to-month)
  • Emergency buys as % of volume
  • Quality deviation rate after any supplier switch

Use case 2: Pre-qualify alternates to protect supply continuity

Workflow:

  • Identify 2–3 alternates by region (e.g., North America + EU + Oceania) for your critical grade.
  • Run staged qualification: documentation → lab testing → pilot → full approval.

What to measure:

  • Time-to-qualify alternates
  • Days of coverage (inventory) vs lead time volatility

Use case 3: Governance-ready contracting (price + service + quality)

Workflow:

  • Contract structure that matches whey realities:
  • Service levels (OTIF, allocation rules)
  • Quality deviation handling (COA, retain samples, corrective action timelines)
  • Price mechanism: fixed + reopeners or index-linked with caps/floors

What to measure:

  • OTIF and lead time stability
  • Price compliance vs agreed mechanism

8) Why This Matters Beyond Whey Powder (examples your leadership will recognize)

Whey powder is a clean example of a broader procurement truth: many “commodities” are actually co-product or conversion-cost markets.

Similar patterns show up in categories procurement teams often buy alongside dairy ingredients:

  • Cocoa powder / cocoa butter (co-product split; demand shifts change relative pricing)
  • Soy meal / soy oil (crush economics; one leg can subsidize the other)
  • Petrochemical derivatives (conversion energy + plant outages drive availability)
  • Fruit concentrates (spec tightness + yield + logistics swing delivered cost)

In all these categories, the winning approach is the same:

  • Understand what drives availability, not just price
  • Translate specs into supplier pool size and switching speed
  • Measure performance as variance + service + risk, not only unit cost

9) Why Whey Powder Is a Powerful “Proof Case” for Intelligence-Led Procurement

Whey powder forces procurement teams to demonstrate mature category management because:

  • Cost is multi-driver (milk/cheese + utilities + freight + product mix)
  • Specs create micro-markets (tight specs = fewer suppliers = higher allocation risk)
  • Switching is constrained by QA and functionality, not just commercial terms

When procurement leadership can show:

  • a defensible spec-flex policy,
  • a benchmarked supplier portfolio,
  • clear risk triggers and documented actions,
  • and KPIs tied to landed cost variance and service level,

…they can justify decisions that balance savings with continuity—without reverting to reactive spot buying.

Tridge Eye Data Intelligence Solution

Make Faster, Data-Driven Sourcing Decisions

The insights in this report are just the starting point. Tridge Eye is the data intelligence solution that gives procurement and sourcing leaders real-time market signals, price benchmarks, and supply risk alerts — so you can act before the market moves.

Explore Tridge Eye →

Subscribe
By subscribing you agree to with our Privacy Policy and provide consent to receive updates from our company.
Thank you! Your submission has been received!
Oops! Something went wrong while submitting the form.
Subscribe to receive the latest blog posts, updates, promotions, and announcements from Tridge.