
This report is powered by Tridge Eye Data Intelligence.
Every data point, price signal, and supply risk insight in this analysis comes from the same platform that procurement and sourcing leaders worldwide rely on daily. As you read, consider what this level of market intelligence could do for your sourcing decisions.
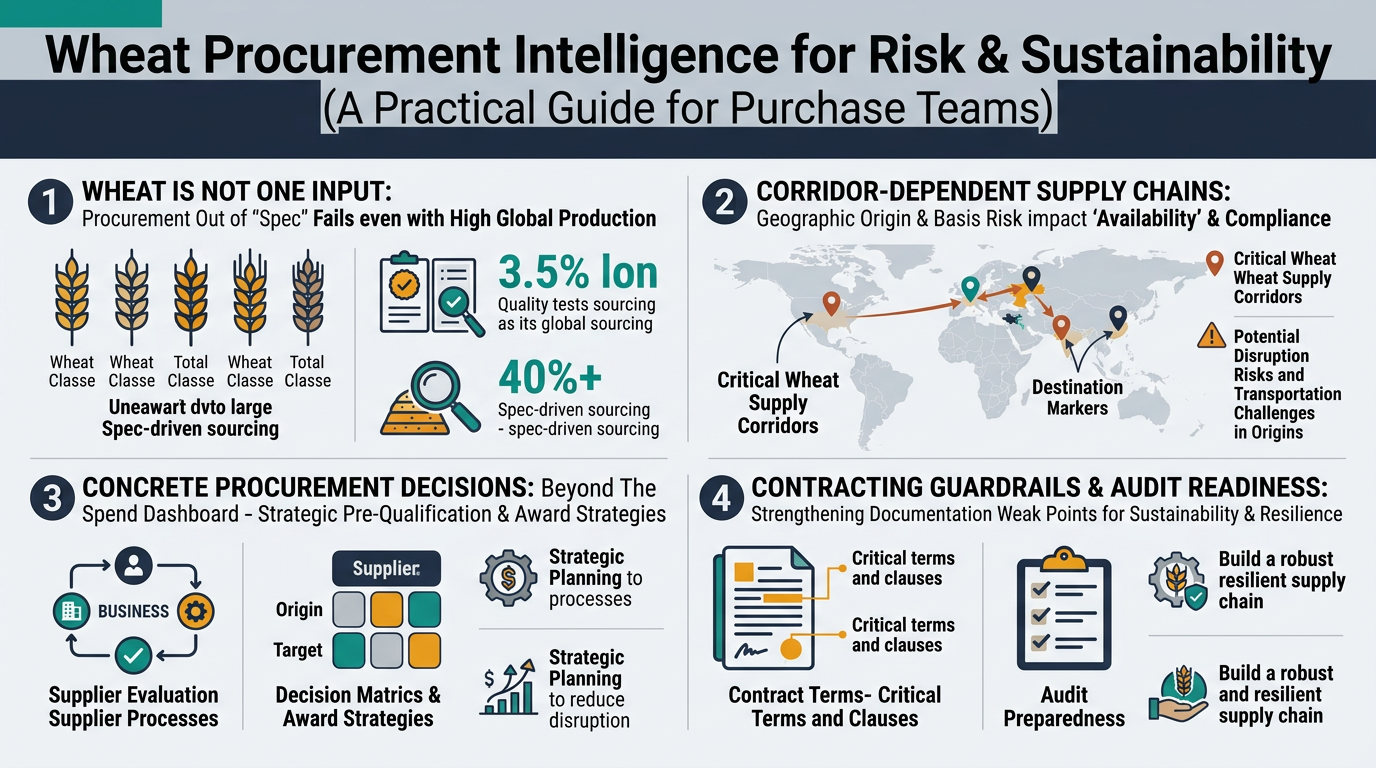
Wheat procurement looks simple on a spend dashboard, but it behaves like a spec-driven, corridor-dependent supply chain where “availability” and “compliance” can fail even when global production looks fine. This guide translates wheat realities (classes, quality tests, basis/corridors, and documentation weak points) into concrete procurement decisions—pre-qualification, award strategy, contracting guardrails, and audit readiness—so Risk & Sustainability teams can reduce disruption exposure without sacrificing commercial performance.
(Analyzed at: Mar, 2026)
This typically reduces disruption-driven premiums and exception spend more reliably than attempting to time futures alone.
Wheat looks like a single commodity on a spend dashboard, but procurement outcomes are driven by segmentation + blending + corridors:
Procurement decision implication: Your risk and sustainability controls must operate at (a) wheat class/spec level and (b) corridor/origin level, not only at supplier name level.

Below is a practical cost-and-margin walkthrough by node, written for a Risk & Sustainability buyer who needs the “why it moves” logic.
Key insight: Farm economics set the floor, but quality outcomes (protein, sprout damage, mycotoxin risk) decide whether wheat earns milling premiums or gets pushed into feed values.
Key insight: This node quietly determines shrink, contamination risk, and spec consistency—and it is where “paper traceability” often breaks.
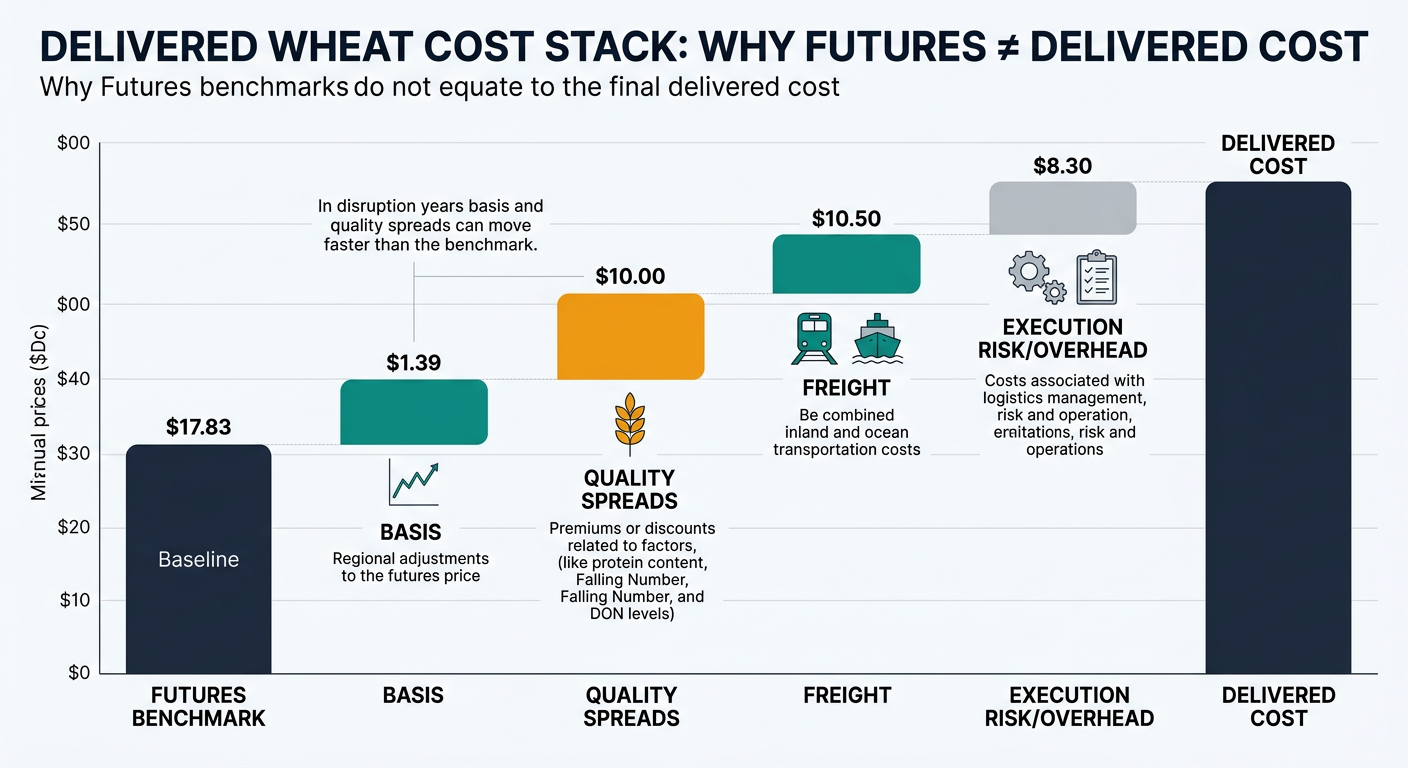
Key insight: A large portion of the “wheat price you pay” is not the futures benchmark—it’s basis (local supply/demand + corridor logistics + quality spreads) plus execution risk.
Key insight: Milling margin is strongly shaped by extraction rate + energy + byproduct values, and your spec tightness changes the mill’s blending cost.
Key insight: Packaging isn’t huge in absolute terms for bulk flour, but QA and compliance can become the gating factor when regulations or customer requirements tighten.
Key insight: Wheat and flour don’t need cold chain, but they are extremely sensitive to freight reliability and demurrage. Logistics is often the first place risk becomes cash.
Key insight: Downstream price pass-through lags. Procurement often absorbs volatility through inventory policy, contract structure, and exceptions.
These ratios are directional to show where cost/margin concentrates by product form. Actuals vary by origin, freight, quality year, and contract terms. Use these tables as a diagnostic lens (what moves) and calibrate with your own freight lanes, milling yields, and service-level requirements.
| Supply Chain Node | Cost Ratio (% of Final) | What Usually Moves It |
|---|---|---|
| Farming (raw grain value) | 55% | Yield + quality year (protein, sprout damage) |
| Aggregation/handling/storage | 10% | Drying, shrink, storage duration |
| Trading/export origination | 10% | Basis, inspection, finance/insurance |
| Logistics & distribution | 20% | Inland + ocean freight, demurrage |
| QA/compliance & admin margin | 5% | Testing, documentation, execution overhead |
| Supply Chain Node | Cost Ratio (% of Final) | What Usually Moves It |
|---|---|---|
| Farming (embedded in wheat input) | 35% | Wheat price + quality spreads |
| Aggregation/handling/storage | 6% | Shrink, segregation needs |
| Milling (processing + yield + byproduct net) | 22% | Energy, extraction rate, byproduct values |
| Packaging & QA | 10% | Bag costs, testing intensity |
| Logistics & distribution | 15% | Regional freight, delivery reliability |
| Wholesale/processor margin | 12% | Service level, contract structure |
| Supply Chain Node | Cost Ratio (% of Final) | What Usually Moves It |
|---|---|---|
| Farming (durum grain value) | 40% | Durum availability + quality premiums |
| Aggregation/handling/storage | 6% | Segregation, storage |
| Milling (semolina processing) | 20% | Energy + yield |
| Packaging & QA | 12% | Food safety + packaging |
| Logistics & distribution | 12% | Corridor and inland freight |
| Wholesale/processor margin | 10% | Specialty demand + service |
In wheat, procurement teams often anchor on futures benchmarks (e.g., CBOT/Matif equivalents) and miss the bigger driver during disruptions:
This is not about “more data.” It’s about changing when and how decisions are made.
The same failure modes repeat across other procurement categories that share three traits: quality variability, corridor dependency, and evidence-heavy sustainability expectations.
Transferable lesson: When the product is spec-sensitive and the supply chain is corridor-constrained, procurement performance depends on pre-qualification + monitoring + evidence governance, not only negotiation.
Wheat is an unusually clear demonstration of how intelligence improves decision quality because:

Make Faster, Data-Driven Sourcing Decisions
The insights in this report are just the starting point. Tridge Eye is the data intelligence solution that gives procurement and sourcing leaders real-time market signals, price benchmarks, and supply risk alerts — so you can act before the market moves.