This guide maps how wheat becomes commercial flour, where cost and risk “lock in,” and why two suppliers quoting the same protein can still deliver very different total cost and performance. It’s written for procurement leaders who know sourcing mechanics but want a clearer, plant-relevant picture of flour’s physical constraints—especially extraction (yield/ash), enrichment compliance, and logistics cost-to-serve.
Wheat flour is not a single commodity—it’s a regional manufacturing output built from wheat classes, mill configurations, and logistics constraints. Most cost is “locked in” before flour ever leaves the mill: wheat quality and extraction choices determine yield, ash/color, and functional performance, while packaging and delivery mode (bulk vs. bag) determine handling cost and serviceability.
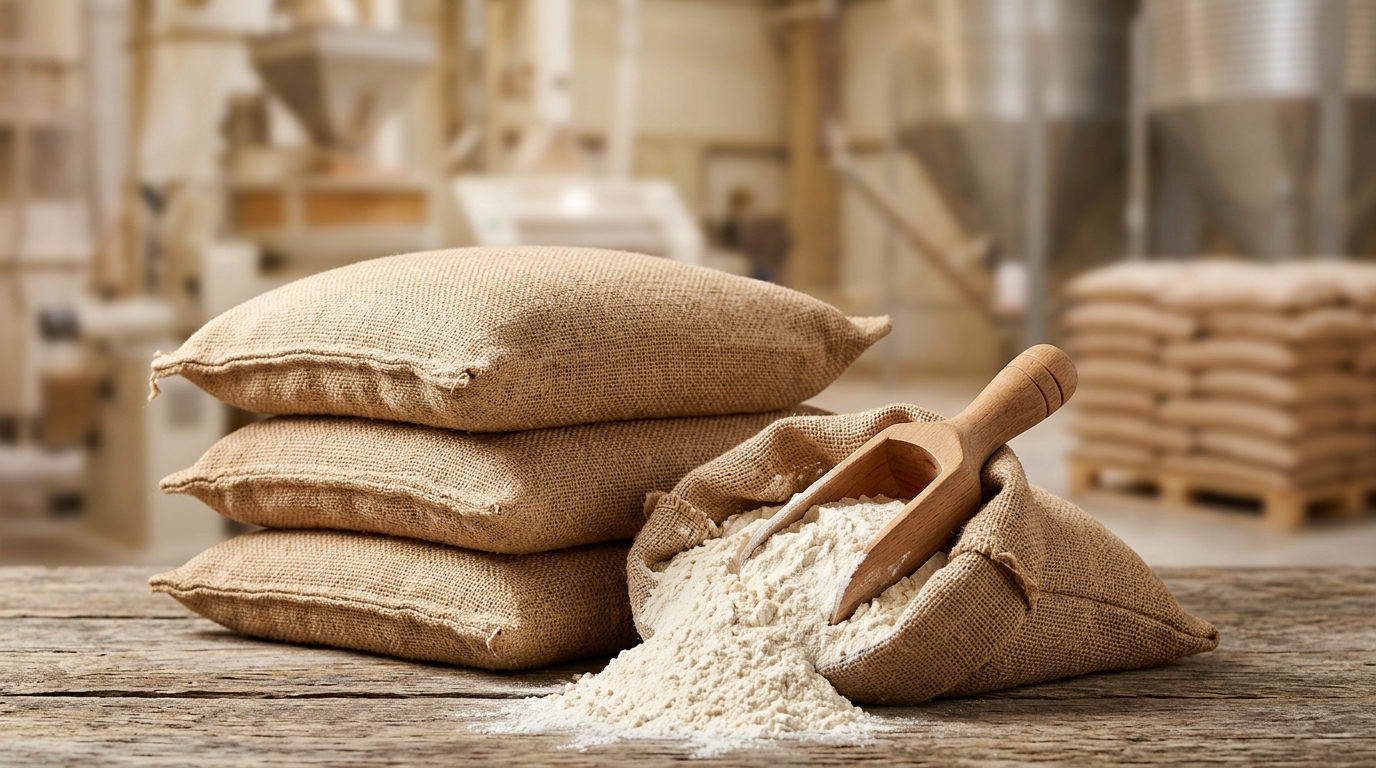
Insight: Flour is typically a local/regional product because it’s lower value-density than wheat and more sensitive to handling (moisture pickup, infestation, odor) over long transit; the chain is therefore built around mills near demand centers or ports.
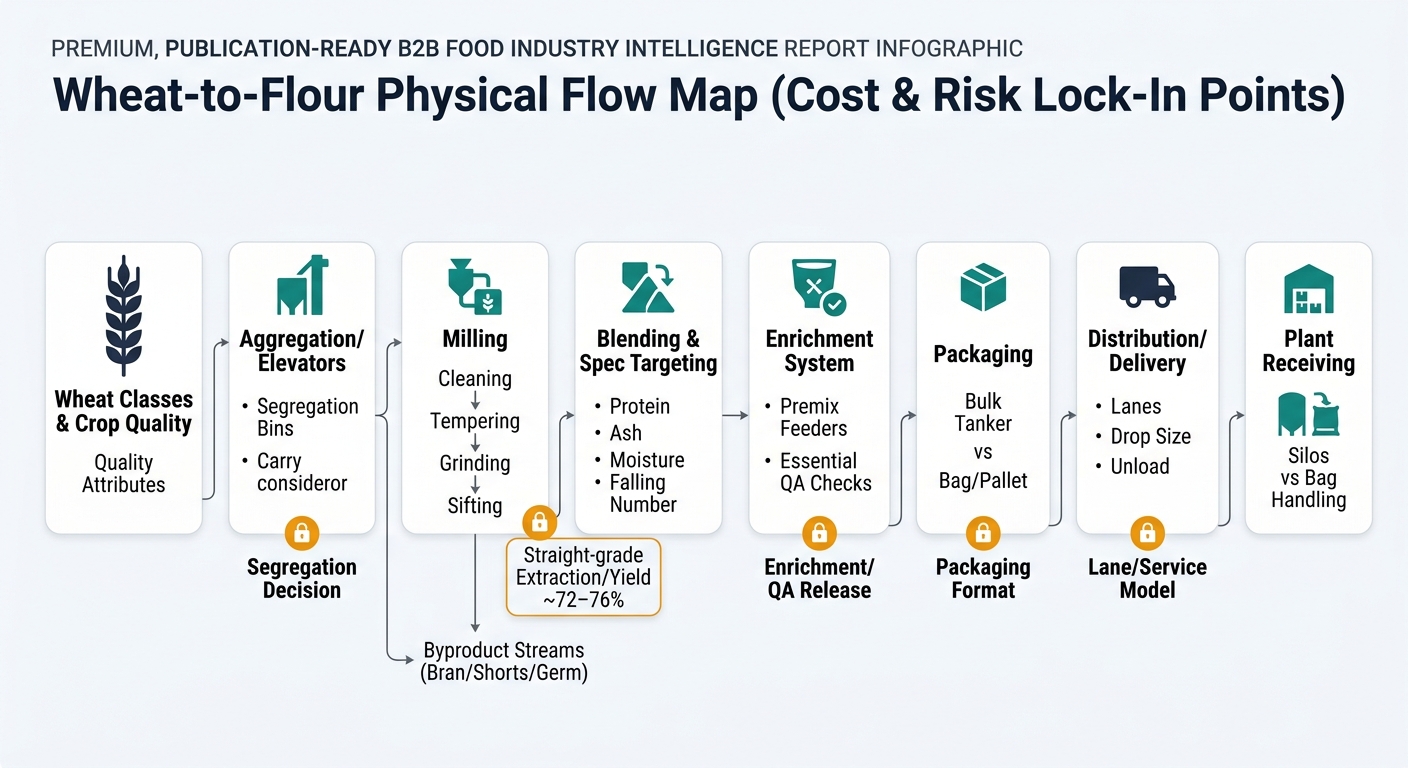
Data: A common U.S. straight-grade flour extraction rate is roughly in the low-to-mid 70s (often cited as ~72% for soft wheat and ~75–76% for hard wheat), meaning ~24–28% becomes bran/shorts/germ streams that must be monetized elsewhere. [1]
Procurement Impact: The “physical map” you’re buying from is: wheat class availability → elevator handling/segregation → milling extraction/blending → enrichment/QA release → packaging (bulk/bag/retail) → distribution. Each node has fixed cost drivers that don’t move with futures—they move with yield, energy, labor, packaging, and lane constraints.
Insight: Flour’s delivered cost is the sum of (1) wheat acquisition and handling, (2) conversion economics inside the mill (yield + energy + labor + maintenance), and (3) “physical form” costs (enrichment, QA release, packaging, and distribution). Byproduct credits (bran/shorts) are not a footnote—they are a structural offset to milling economics.
Data: Straight-grade extraction commonly sits around the low-to-mid 70s %, while “patent” streams are lower extraction (whiter, lower ash) and “clear” streams sit outside patent and carry higher ash. [1]
Procurement Impact: Two suppliers can quote the “same flour protein” but have different cost structures depending on extraction targets, byproduct monetization, enrichment system, packaging line speed, and the delivery mode you require.
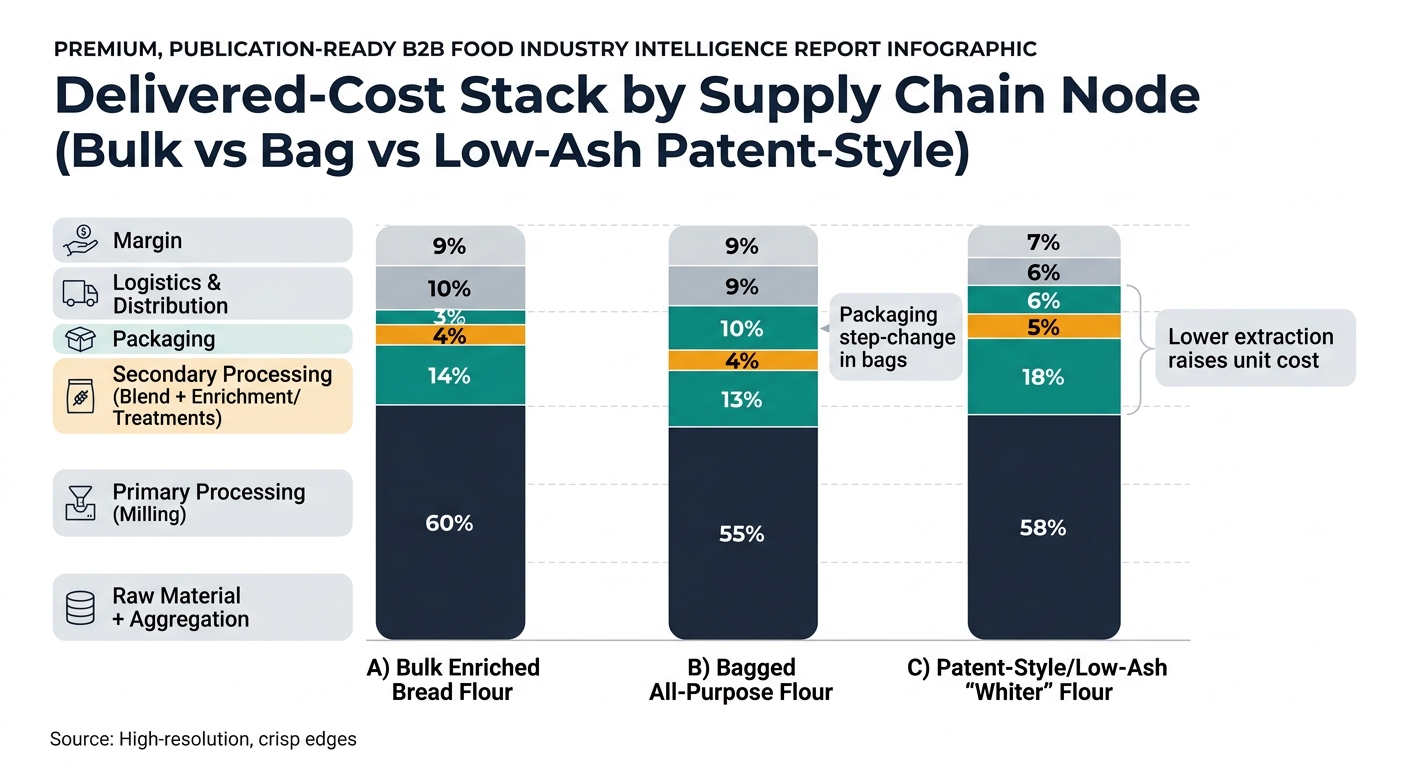
Insight: Cost ratios shift materially by flour type and form factor because extraction, QA burden, and packaging are different “physical builds.”
Data: Extraction rate differences between straight-grade and patent streams are real and drive yield; enrichment has a defined U.S. standard of identity. [1] [2]
Procurement Impact: Use these ratios to sanity-check where your cost is structurally anchored (wheat vs. conversion vs. packaging/logistics), independent of short-term market moves.
| Supply Chain Node | Cost Ratio (% of Final Cost) | Notes |
|---|---|---|
| Raw Material (wheat) + aggregation | 60% | Wheat class/quality and segregation drive usability. |
| Primary processing (milling) | 14% | Extraction/yield, energy, maintenance, labor. |
| Secondary processing (blend + enrichment) | 4% | Premix + dosing controls + documentation. |
| Packaging & QA release | 3% | Bulk loading + routine lab testing/COA. |
| Logistics & distribution | 10% | Tanker freight, accessorials, scheduling. |
| Distributor/producer margin | 9% | Mill margin and service model. |
| Supply Chain Node | Cost Ratio (% of Final Cost) | Notes |
|---|---|---|
| Raw Material (wheat) + aggregation | 55% | Often broader spec than bread flour; still quality-dependent. |
| Primary processing (milling) | 13% | Similar conversion economics; different blend targets. |
| Secondary processing (blend + enrichment) | 4% | Enrichment common in many markets; adds compliance steps. |
| Packaging & QA release | 10% | Bags, pallets, labor, line throughput, damage. |
| Logistics & distribution | 9% | Pallet freight, higher handling at both ends. |
| Distributor/producer margin | 9% | Higher cost-to-serve than bulk. |
| Supply Chain Node | Cost Ratio (% of Final Cost) | Notes |
|---|---|---|
| Raw Material (wheat) + aggregation | 58% | Needs consistent wheat blend to protect color/ash and performance. |
| Primary processing (milling) | 18% | Lower extraction raises unit cost; tighter stream selection. |
| Secondary processing (blend + enrichment/treatments) | 5% | More blending control; sometimes additional functional standardization. |
| Packaging & QA release | 6% | Often tighter QA gates (ash/color/functionality). |
| Logistics & distribution | 6% | Mix of bulk/bag depending on end use. |
| Distributor/producer margin | 7% | Premium reflects yield loss + tighter QA. |
Insight: Flour supply risk is often “spec-availability risk,” not “tons-availability risk.” The chain can have plenty of wheat and still struggle to make your exact flour consistently if quality, segregation, or milling configuration is constrained.
Data: Ash tracks extraction; straight-grade extraction is structurally limited; Falling Number is used in flour quality frameworks and is sensitive to sprout/enzymatic conditions. [1] [4]
Procurement Impact: Plan for qualification and continuity around these constants:
(Analyzed at: Apr, 2026)
Treat freight and service as a first-class commercial term this cycle: separate your flour price discussion into (a) wheat/index exposure and (b) a lane-specific delivered “cost-to-serve” add-on with clear assumptions for drop size, delivery frequency, unload time, and accessorials.
With diesel elevated and truck capacity tightening in 2026, two plants buying the same spec can see meaningfully different delivered outcomes purely from lane execution and scheduling discipline. [3]
Locking those service variables (and penalties/credits) alongside a spec spine (protein + ash + moisture + Falling Number control) is how you reduce surprises; if you don’t, you’ll pay for volatility twice—once in freight and again in out-of-spec risk and expedites.