
This report is powered by Tridge Eye Data Intelligence.
Every data point, price signal, and supply risk insight in this analysis comes from the same platform that procurement and sourcing leaders worldwide rely on daily. As you read, consider what this level of market intelligence could do for your sourcing decisions.
Vodka is easy to underestimate because the liquid is chemically stable and specifications look straightforward. For procurement leaders, the real work is understanding where cost and lead time become structurally constrained: neutral spirit utilities/capacity, bottling line minutes, and packaging conversion (especially glass). This guide maps the physical flow and highlights the “hard floors” in COGS that shape negotiations, dual-sourcing, and resilience planning.
(Analyzed at: Apr, 2026)
Download real-time cost tracking for every node in this supply chain.
Insight: Vodka is often treated as a “simple” spirit, but its supply chain is a multi-input system where utilities-heavy neutral spirit production and packaging/bottling constraints typically set the hard floor for cost and lead time.
Data: Neutral spirit/ethyl alcohol of agricultural origin is commonly produced near the ethanol–water azeotrope at ~95–96% ABV using continuous multi-column distillation/rectification [4]. Finished vodka is then proofed (commonly 40% ABV in many markets; EU minimum 37.5% ABV) and packaged—where custom glass, decoration, and line scheduling often drive the longest lead times [1].
Procurement impact: The “fixed” cost drivers you can’t wish away are (1) feedstock-to-ethanol yield + utilities, (2) bottling line time and changeovers, and (3) glass/closure/label conversion capacity. If you don’t map these physical choke points, you’ll misdiagnose where shortages and cost step-ups originate.
Insight: Vodka supply chains commonly split into two architectures: bulk neutral spirit moved to a bottling market vs. finished bottled vodka exported. The liquid is chemically stable; the supply chain is not—because it depends on industrial utilities and packaging conversion.
Data: A typical physical flow is:
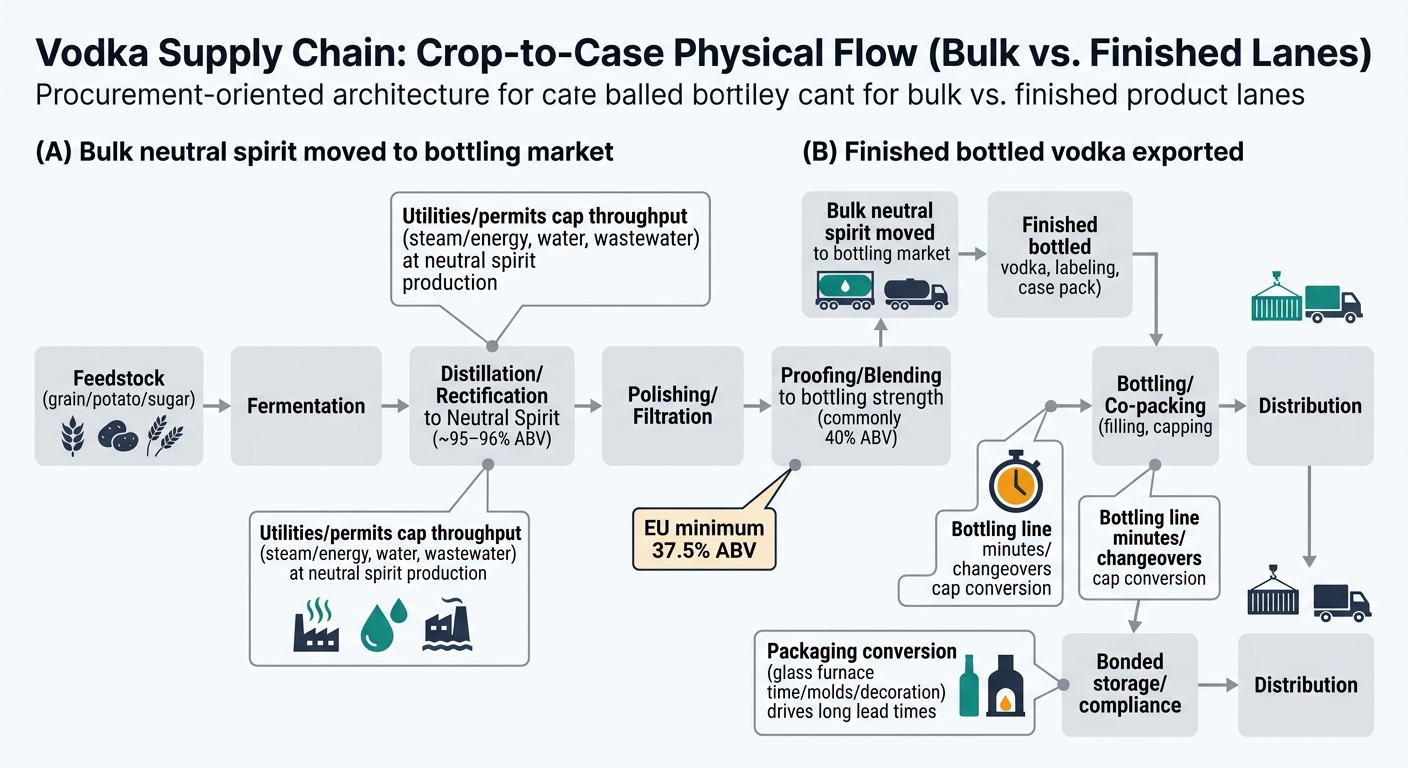
Procurement impact: Treat vodka as two coupled supply chains: (A) ethanol manufacturing (utilities + yield) and (B) packaging conversion (glass/closures/labels + line time). Disruptions often originate in B even when A is stable.
Insight: Feedstock cost is the largest variable input to ethanol yield, but spec compliance and yield loss are where cost quietly accumulates.
Data: Key physical/quality parameters that affect conversion and compliance:
Procurement impact: Even without “market timing,” the physical reality is that yield and reject rates convert directly into cost-per-liter of alcohol produced; poor inbound quality increases lab load, rework, and downtime.
Insight: Neutral spirit production is a utilities-and-capex business: steam, electricity, cooling water, and wastewater capacity determine throughput as much as demand.
Data: Fixed cost drivers at this node:
Procurement impact: The hard constraint is site capacity under utility limits; when constrained, lead times extend even if feedstock is available.
Insight: “Neutral” is a technical spec, not a marketing word. Polishing steps are where producers pay for consistency.
Data: Typical physical activities and cost drivers:
Procurement impact: Specs that look “small” (e.g., tighter impurity limits, water mineral profile constraints) create real fixed costs in media, utilities, and QC throughput.
Insight: Bottling is a scheduling problem disguised as manufacturing. The physical bottleneck is often line time and changeover loss, not liquid availability.
Data: Fixed cost drivers:
Procurement impact: The “real capacity” you are buying is minutes on a validated line with the right change parts, not just a nominal bottles-per-hour claim.
Insight: Packaging is frequently the largest non-liquid COGS for premium vodka and the most common source of long-lead constraints.
Data: Structural cost drivers by component:
Procurement impact: The physical lock-in is created by custom bottle molds + unique finishes + decoration processes— these reduce alternate-source feasibility even when multiple glassmakers exist.
Insight: Spirits logistics is not “just freight.” The system is constrained by excise control, bonded capacity, and paperwork latency.
Data: Embedded cost drivers:
Procurement impact: Working capital and service level are physically shaped by how long product sits in controlled storage and how quickly compliant release can occur.
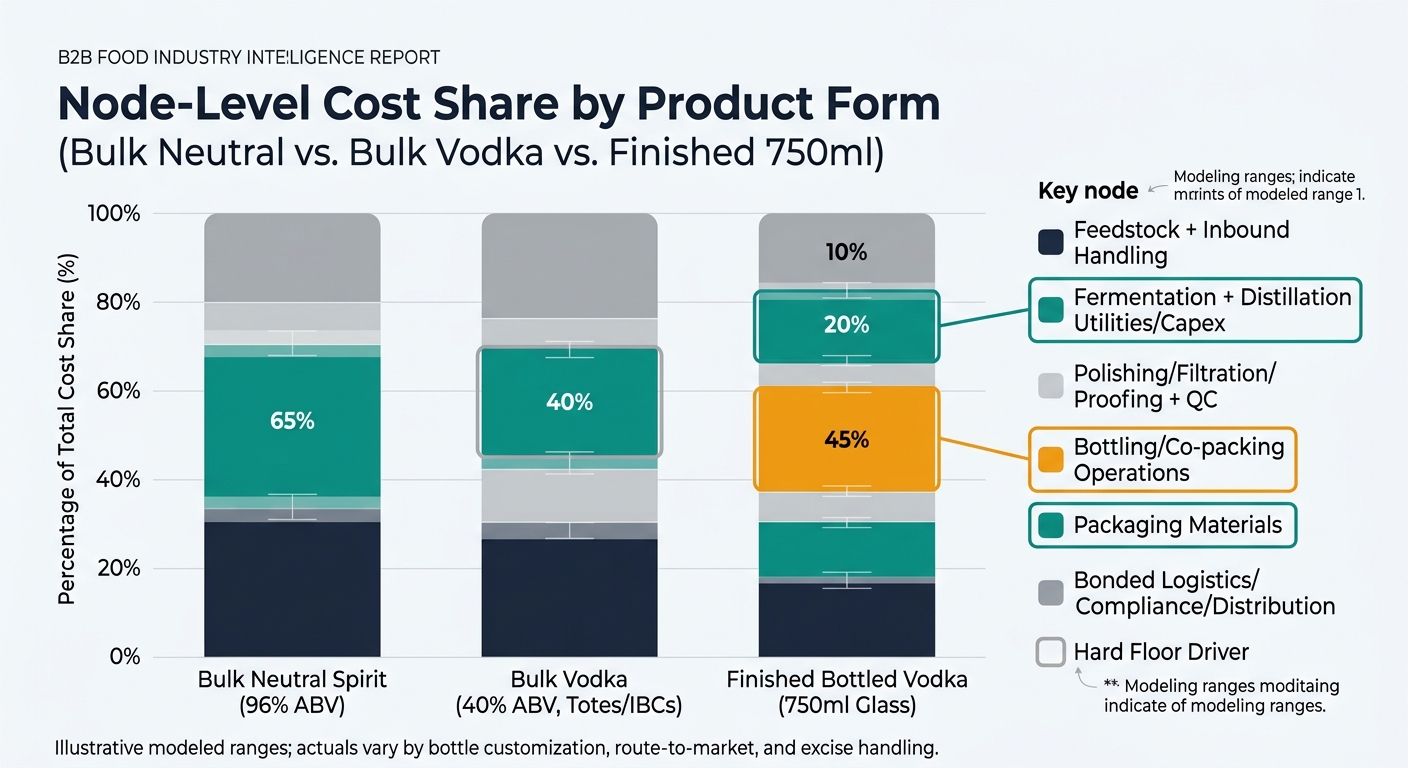
Modeled figures show typical cost concentration by node. Actual ratios vary by brand position (value vs. premium), bottle weight/customization, route-to-market (bulk vs. finished), and country-specific excise handling.
| Supply chain node | Bulk neutral spirit (96% ABV) | Bulk vodka (40% ABV, totes/IBCs) | Finished bottled vodka (750ml glass) |
|---|---|---|---|
| Feedstock + inbound handling | 25–45% | 15–30% | 8–18% |
| Fermentation + distillation utilities/capex | 25–40% | 20–35% | 10–22% |
| Polishing/filtration/proofing + QC | 5–12% | 10–20% | 6–14% |
| Bottling/co-packing operations | — | 3–8% | 10–20% |
| Packaging materials | — | 1–4% | 25–45% |
| Bonded logistics/compliance/distribution | 5–15% | 8–18% | 10–22% |
| Component | Typical share of packaging materials cost | What physically drives it |
|---|---|---|
| Glass bottle | 45–70% | bottle weight, custom mold/tooling, decoration method, defect/breakage |
| Closure (cap + liner + tamper evidence) | 10–20% | finish compatibility, torque/leak performance, custom parts |
| Labels (front/back/neck) | 8–18% | substrates, foils/embellishments, adhesive performance |
| Cartons/dividers | 8–15% | board grade, print coverage, pack configuration |
| Pallets/stretch wrap | 2–6% | pallet spec, cube efficiency, damage prevention |
| Node | Spec / checkpoint | Why it costs money |
|---|---|---|
| Feedstock intake | Moisture, mycotoxins, foreign material | segregation, testing frequency, storage losses, rejection risk |
| Distillation | Neutral spirit purity targets | extra rectification energy/time, tighter controls |
| Proofing | Water mineral profile / conductivity | water treatment capex/opex, haze prevention |
| Bottling | Torque, leak rate, fill height | QA labor, holds, rework, scrap |
| Packaging | Glass defects, label adhesion | line stops, yield loss, claims/returns |
Insight: Neutral spirit and glass are produced in large, capital-intensive assets (columns and furnaces). Capacity doesn’t scale smoothly.
Data: Distillation throughput is capped by steam/cooling/wastewater permits; glass output is capped by furnace campaigns and mold availability.
Procurement impact: When a site hits a hard constraint, the system doesn’t flex with small adjustments—lead times jump and substitution is slower than expected.
Insight: The more bespoke the bottle/finish/decoration, the fewer technically compatible alternates exist.
Data: Custom molds, proprietary finishes, and decoration processes tie you to specific equipment sets and QC standards.
Procurement impact: The physical map tells you where you are “single-sourced by design,” even if you have multiple suppliers on paper.
Insight: Alcohol distribution includes controlled storage, documentation, and auditability that add time and cost independent of distance.
Data: Bonded warehousing, stamp/label controls (market-dependent), and traceability requirements introduce administrative latency.
Procurement impact: Service level is partly determined by compliance throughput; logistics planning must account for controlled-release steps.
Strategy: Hold
Reliability: High
Potential Saving: 3–8%
Insight: Treat bottling line time as a scarce production input. SKU count, decoration complexity, and change parts drive effective capacity and scrap; simplifying pack formats reduces fixed conversion loss.
Strategy: Buy
Reliability: Medium
Potential Saving: 4–12%
Insight: In premium vodka, glass is a structural cost center. Bottle weight, decoration method, and breakage rates are physically linked to freight, damage, and line stops—lightweighting and decoration rationalization can reduce total system cost.
Strategy: Strong Buy
Reliability: Medium
Potential Saving: 2–6%
Insight: Separate the supply chain into bulk liquid vs. finished goods lanes. Bulk movement reduces glass freight intensity but increases reliance on local bottling and QA throughput; mapping these lanes clarifies where fixed costs sit.
Logical next step (analysis, not promotion): Once you have this physical map, the hardest practical question becomes: which node is your true constraint by SKU and market—neutral spirit capacity, bottling line minutes, or packaging conversion lead time—and how does that constraint change quarter by quarter? Answering that reliably requires structured, current visibility into site capacity, packaging lead times, and compliance throughput across your supplier network.

See These Cost Structures Shift in Real Time
Tridge Eye — The supply chain breakdown you just read is a snapshot. Costs, margins, and risk profiles change daily — and the teams that track them in real time consistently out-source their competitors.