
This report is powered by Tridge Eye Data Intelligence.
Every data point, price signal, and supply risk insight in this analysis comes from the same platform that procurement and sourcing leaders worldwide rely on daily. As you read, consider what this level of market intelligence could do for your sourcing decisions.
Vitamin E looks straightforward in a supplement SKU, but procurement outcomes (cost, continuity, auditability) are driven by upstream route choices, concentration at a few specialized producers, and downstream format decisions that create real switching friction. This guide translates the physical chain into decision-ready nodes so sourcing teams can standardize specs, contract around bottlenecks, and keep alternates truly contingency-ready.
Analyzed at: Apr, 2026
Want to see these cost dynamics in real time? Tridge Eye tracks price shifts across every node of this supply chain — daily. Get my live market data →
Insight: Vitamin E supplements look like a “simple” fat‑soluble vitamin at shelf—but the supply chain is built on two very different upstream engines: (1) natural tocopherols recovered from vegetable oil refining byproducts and (2) synthetic vitamin E made via chemical intermediates. Both routes are capital‑intensive and concentrated, so disruptions and cost shifts propagate fast.
Data:
Procurement impact: Your fixed cost drivers are not “brand decisions”—they are structural: upstream concentration + qualification friction + stability/packaging constraints. The buying decision that matters most is which form/spec route you standardize (acetate vs tocopherol; natural vs synthetic; oil vs beadlet) and how you contract around the nodes where switching is slow.
Insight: Vitamin E supplement supply chains split early (natural vs synthetic), then reconverge downstream into standardized ingredient formats (oil solutions or beadlets) that feed softgel and tablet/capsule manufacturing.
Data:
Procurement impact (quick win): Map your BOM to one of three buyable “ingredient realities”—(A) tocopherol/acetate bulk oil, (B) beadlets/powders, (C) finished softgels—because each has different switching costs, MOQs, and QA burden.

Insight: Upstream volatility is structurally different by route: natural supply is tied to edible oil refining economics, while synthetic supply is tied to chemical plant economics and intermediates availability.
Data:
Procurement impact: If you single‑source a “natural” claim, your continuity risk inherits oilseed/refining cycles; if you single‑source synthetic, you inherit intermediate and site concentration risk. Your governance control is to codify allowed route(s) in specs and change control.
Insight: This is the cost gravity well: yield, energy, solvent handling, and QC drive cost; concentration risk is high because plants are specialized.
Data:
Procurement impact: Treat this node like a “strategic chemical” rather than a generic nutraceutical: build optionality (qualified alternates) and contract for change notice, allocation rules, and QC documentation SLAs.
Insight: The ingredient form you buy determines downstream scrap risk and line efficiency. Oils are simple but oxidation‑sensitive; beadlets add conversion cost but improve handling for tablets/ premixes.
Data:
Procurement impact: Choose one “house standard” format per dosage platform (softgel vs tablet) and lock it into your approved material list—this reduces qualification churn and avoids hidden TCO from potency drift, rework, and OOS investigations.
Insight: Finished‑goods cost is often dominated by conversion capacity + yield + packaging, not the vitamin E molecule itself—especially for softgels.
Data: While public data varies, the operational physics are consistent: softgels require gelatin/plasticizers, controlled fill, and higher in‑process QC than simple encapsulation.
Procurement impact: If you buy finished goods from a CMO, negotiate around OEE/yield assumptions, potency overage policy, and scrap ownership. If you buy ingredients, audit CMOs for heat/light exposure controls to protect potency (reducing claims and write‑offs).
Insight: Vitamin E’s oxidation sensitivity makes packaging and dwell time a measurable cost driver (returns, rework, tighter expiry management).
Data:
Procurement impact: Your “cheap bottle” decision can raise TCO. Specify light/oxygen barrier performance, define temperature exposure limits in logistics SOPs, and require COA + stability/retention sample governance.
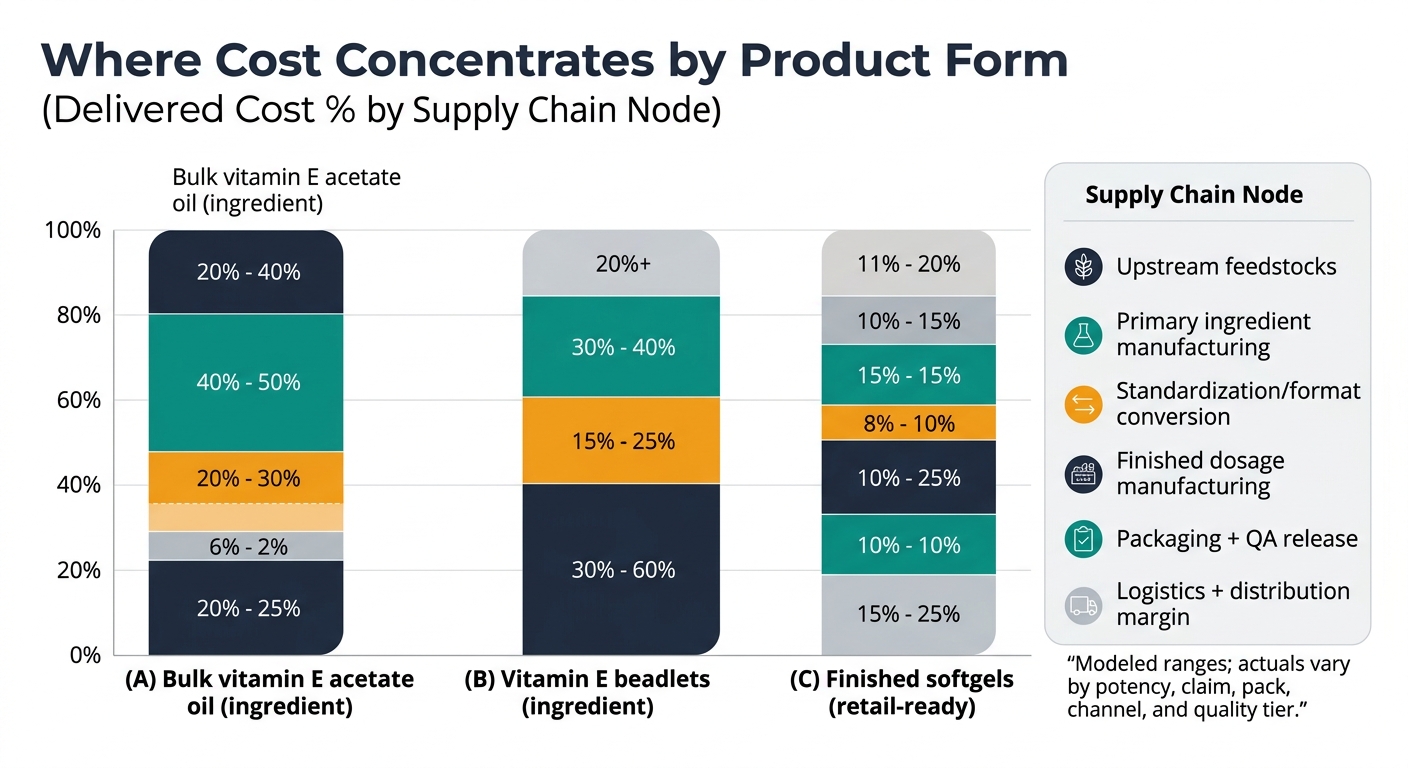
Modeled ranges to show where cost tends to concentrate by product form; actuals vary by potency, claim (natural vs synthetic), pack count, channel, and quality tier.
| Supply chain node | Bulk vitamin E acetate oil (ingredient) | Vitamin E beadlets (ingredient) | Finished softgels (retail-ready) |
|---|---|---|---|
| Upstream feedstocks | 15–25% | 10–20% | 5–10% |
| Primary ingredient manufacturing | 35–50% | 25–40% | 10–20% |
| Standardization / format conversion | 5–10% | 20–35% | 5–10% |
| Finished dosage manufacturing | N/A | N/A | 25–40% |
| Packaging + QA release | 5–10% | 5–10% | 20–35% |
| Logistics + distribution margin | 10–20% | 10–20% | 15–30% |
| Cost bucket | Bulk oil (acetate/tocopherol) | Beadlets/powder | Finished softgels |
|---|---|---|---|
| Active ingredient value | High | Medium | Medium |
| Processing energy/yield/QC | High | Medium | Medium |
| Encapsulation / conversion | Low | High (spray-dry/encapsulation) | High (softgel line) |
| Packaging materials | Low | Medium | High |
| QA/testing & release | Medium | Medium | High |
| Working capital (inventory/expiry) | Medium | Medium | High |
Insight: Vitamin E behaves like a concentrated specialty chemical market upstream, even if it’s sold as a commodity downstream.
Data: BASF’s force majeure communications show how a single site event can shift restart timelines and delay “business as usual” due to inventory rebuild time. [2]
Procurement impact: Dual-source at the ingredient-manufacturer level (not just distributors). Build a qualification roadmap that keeps at least one alternate “warm.”
Insight: Acetate vs tocopherol (and oil vs beadlet) determines stability, processing losses, and QA controls.
Data: Tocopheryl acetate is commonly used because of greater stability vs free tocopherol; vitamin E stability is sensitive to heat/light/oxygen. [3] [6]
Procurement impact: Put form decisions into category governance: approved forms, equivalency rules, and change-control triggers (spec changes, supplier changes, site changes).
Insight: In regulated supplement supply chains, the “real” switching cost is documentation, testing, and stability confidence—especially when you change route or format.
Data: The need for controlled processing/storage conditions and stability sensitivity increases the burden of validation and ongoing QC. [6]
Procurement impact: Build contracts and SRM around documentation completeness, deviation response time, and audit readiness, not just unit price.
Strategy: Buy
Reliability: High
Potential Saving: 3–7%
Insight: Standardize your buy to one primary vitamin E form per dosage platform (e.g., acetate oil for softgels; beadlets for tablets) and contractually lock equivalency + change-control. This reduces requalification churn, avoids potency-loss rework, and improves line efficiency.
Strategy: Hold
Reliability: Medium
Potential Saving: 2–5%
Insight: Separate contracts by node: (1) active ingredient supply, (2) format conversion (beadlet/oil standardization), (3) finished-dose conversion. This prevents you from paying “finished-goods margin” for problems that originate upstream and makes root-cause cost recovery enforceable.
Strategy: Strong Buy
Reliability: High
Potential Saving: 4–10% (risk-adjusted)
Insight: Build a dual-source portfolio by manufacturing route and site (not just country). Pair it with explicit allocation language, safety stock ownership rules, and QC documentation SLAs—because upstream concentration makes spot buying the most expensive form of resilience.
Logical next step (non-promotional): Most procurement teams can map the nodes, but struggle to keep an always-current view of which suppliers are truly substitutable (same form/route/spec), which sites share hidden intermediates, and which early-warning signals predict allocation—the gap between “approved on paper” and “contingency-ready in practice.”

See These Cost Structures Shift in Real Time
Tridge Eye — The supply chain breakdown you just read is a snapshot. Costs, margins, and risk profiles change daily — and the teams that track them in real time consistently out-source their competitors.


