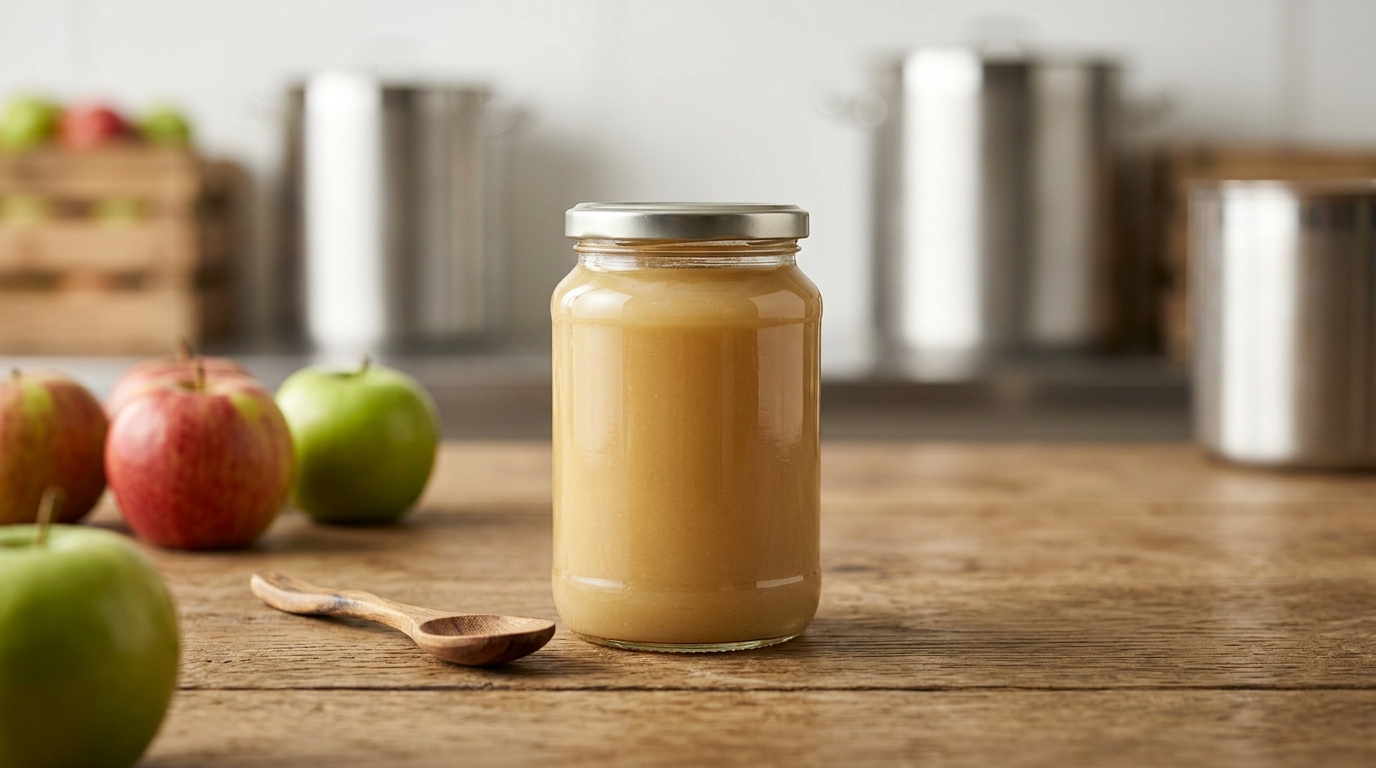
Unsweetened apple puree looks like a “simple” ingredient, but procurement outcomes (holds, rejections, complaints, and recall exposure) are usually determined by a few physical control points: fruit intake quality, finishing/thermal/oxygen management, and aseptic packaging integrity. This guide maps the real supply chain, shows where costs lock in, and translates it into practical QA/compliance sourcing decisions.
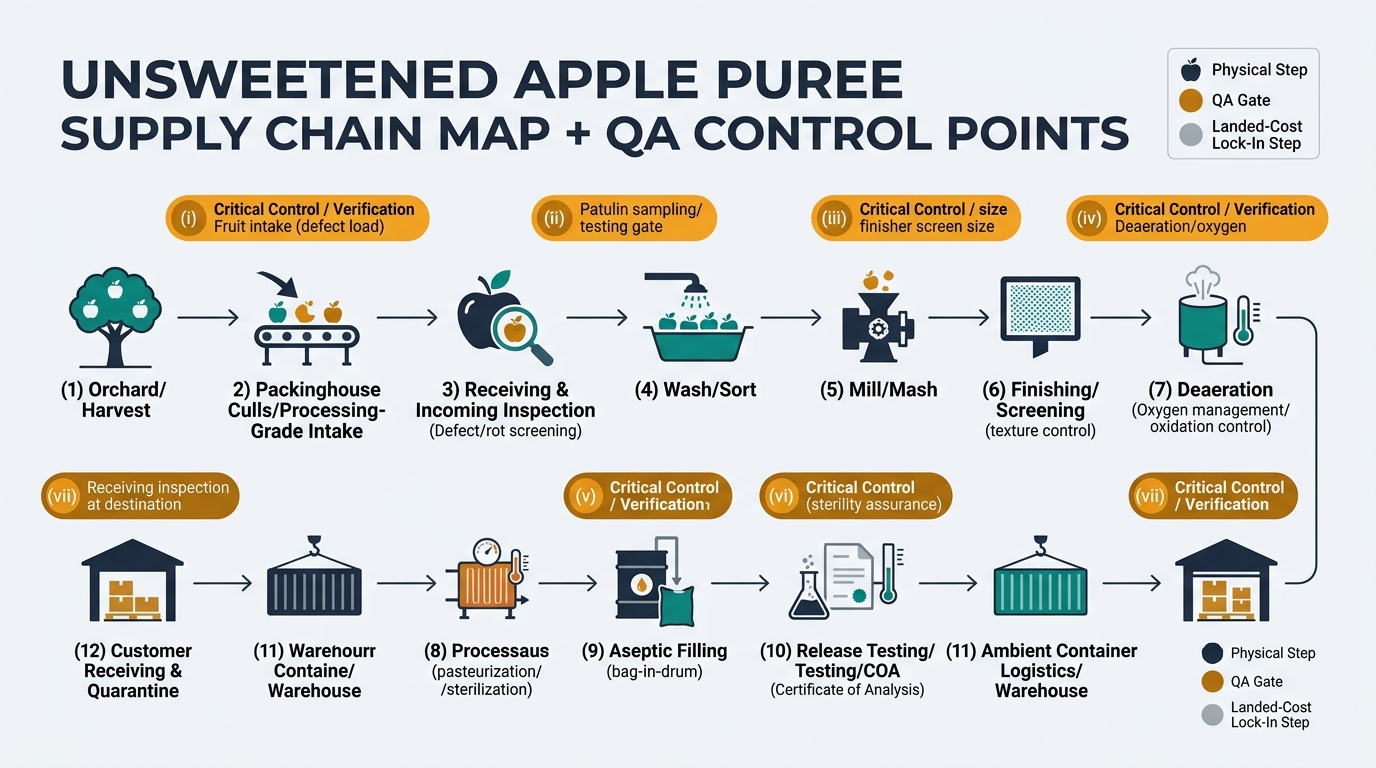
Unsweetened apple puree is a high-volume, low-to-mid value ingredient whose economics are set by three physical constraints: (1) a short harvest intake window but year-round demand, (2) heavy conversion infrastructure (washing, milling, thermal kill, finishing, deaeration, aseptic filling), and (3) bulky packaging and freight (drums/totes, containers). “Unsweetened” does not mean “simple”: processors still standardize solids (°Brix), acidity (pH), and texture through blending and screening—while managing chemical risks like patulin and pesticide residues.
Insight: The chain is essentially “harvest compression → industrial conversion → sterile bulk logistics,” so throughput and sterility controls matter as much as fruit quality.
Data: Industrial apple puree is commonly shipped aseptically in 55-gallon / ~200–220 L bag-in-drum formats, often around ~200 kg net per drum depending on pack-out. (Example packing options show 55-gal aseptic drums at ~200 kg net.) [3]
Procurement Impact: The biggest fixed cost drivers sit at processing (energy, yield loss, aseptic validation) and packaging/logistics (drums, liners, container handling). Your spec and QA expectations determine how much of the chain’s “natural variability” becomes reject/rework cost.
Insight: Apple puree cost is not just “fruit cost + margin.” Each node adds irreversible conversion cost (energy/water/waste), yield loss (sorting/finishing), and compliance overhead (residue/mycotoxin verification, traceability, sterile packaging control).
Data: In institutional/contract procurement, aseptic fruit puree specifications commonly use °Brix and pH conformance as baseline analytical gates when verification testing is specified. [1]
Procurement Impact: If you don’t map which node creates which cost, you can’t diagnose why two “unsweetened apple puree” offers behave differently in shelf-life, micro stability, or lot-to-lot texture—even at similar °Brix.

| Supply Chain Node | Cost Ratio (% of Final Cost) | Notes |
|---|---|---|
| Raw Material Cost (processing apples) | 35–50% | Driven by solids yield, defect load, and competing outlets (juice/concentrate). |
| Primary Processing (wash/sort/mill) | 8–12% | Sorting intensity and yield loss are major hidden drivers. |
| Secondary Processing (finish/deaerate/thermal kill) | 15–22% | Energy + throughput + quality standardization (texture/color). |
| Packaging & QA (aseptic bag + drum + release testing) | 10–18% | Aseptic liner/drum costs + micro/chemical verification and holds. |
| Logistics & Distribution | 8–15% | Container handling, inland freight, warehousing; frozen adds reefer premium. |
| Processor/Exporter Margin | 5–10% | Reflects capacity utilization, inventory carrying, compliance overhead. |
| Supply Chain Node | Cost Ratio (% of Final Cost) | Notes |
|---|---|---|
| Raw Material Cost | 30–45% | Similar fruit drivers; sometimes different blending strategy by plant. |
| Primary Processing | 8–12% | Comparable conversion steps before freezing. |
| Secondary Processing | 12–18% | Thermal profile may differ; freezing adds energy load. |
| Packaging & QA | 8–14% | Packaging can be cheaper than aseptic, but QA holds still apply. |
| Cold-Chain Logistics & Storage | 18–28% | Reefer freight + freezer storage + temperature excursion risk. |
| Processor/Exporter Margin | 4–9% | Often tighter margins but higher logistics complexity. |
| Supply Chain Node | Cost Ratio (% of Final Cost) | Notes |
|---|---|---|
| Puree Input (from upstream chain) | 20–35% | Puree becomes one ingredient within a branded/retail cost stack. |
| Secondary Processing (blending, heat, filling) | 10–18% | Additional formulation, thermal processing, and line efficiency. |
| Packaging (pouches/cups/lids/cartons) | 20–35% | Packaging often dominates due to high material + conversion cost. |
| QA/Regulatory & Traceability | 5–10% | Higher documentation/traceability expectations, especially for kids’ products. |
| Logistics & Distribution | 10–18% | Case pick, DC handling, retail distribution complexity. |
| Brand/Retail Margin | 15–30% | Consumer channel markups and trade spend. |
Insight: The biggest “surprises” in apple puree are structural—built into biology (harvest season), physics (bulk freight), and controls (aseptic sterility + chemical hazard management).
Data: Aseptic fruit puree purchasing specs commonly use °Brix and pH analytical requirements; patulin is a documented hazard with an FDA action level of 50 ppb for apple juice/products. [1] [2]
Procurement Impact: These realities shape what is realistically controllable by spec alone—and where you need process evidence and verification to avoid downstream instability.
Insight: In apple puree, the “spec sheet” is only the visible layer; the physical chain tells you where variability and failure modes originate.
Data: Procurement standards for aseptic fruit purees emphasize °Brix/pH verification when testing is specified; bulk trade commonly uses aseptic drums to enable ambient logistics. [1]
Procurement Impact: If you align specs and verification to the right node, you reduce rejects, shorten holds, and avoid preventable shelf-life and sensory failures.
(Analyzed at: Sep, 2026) If you want fewer holds and more defensible supplier governance, write your next apple puree contract around control-point evidence, not just numeric specs: require (1) lot-level patulin/residue verification aligned to your risk tier, (2) documented fruit intake/sorting controls that prevent patulin loading upstream, and (3) aseptic packaging validation and traceability fields that let you quarantine fast. This works because patulin remains an active, recall-driving hazard in fruit purees and because 2026 freight volatility makes last-minute re-sourcing disproportionately expensive. [6] In practice, teams that reduce “waiting on release” and avoid even one expedited switch often protect low-to-mid single-digit landed cost while materially reducing recall exposure.