

This report is powered by Tridge Eye Data Intelligence.
Every data point, price signal, and supply risk insight in this analysis comes from the same platform that procurement and sourcing leaders worldwide rely on daily. As you read, consider what this level of market intelligence could do for your sourcing decisions.
Sunflower oil sourcing decisions get easier when you separate what is physically “locked in” (seed-to-crush-to-refine-to-logistics) from what procurement can actively manage (node selection, specs, portfolio, and logistics readiness). This guide maps the real flow of sunflower oil and highlights where costs and disruptions typically originate—so you can build a more defensible sourcing strategy and fewer last-minute escalations.
Analyzed at: Apr, 2026
Insight: As of April 2026, Ukraine remains a major export engine, but logistics and corridor constraints still create episodic premiums and service risk. For most buyers, the best near-term value is not “timing the market,” but tightening the spec-to-node fit: (1) explicitly split your buy spec into “RBD” vs “RBD + winterized/clear-and-bright”, (2) pre-book/validate tank-farm heating/cooling + filtration throughput as part of supplier feasibility, and (3) for any crude-to-refined conversion, govern refining loss % as a cost line (not a plant-only metric). This typically reduces avoidable rework, demurrage, and dispute cycles more reliably than chasing small FOB deltas. [1]
Download real-time cost tracking for every node in this supply chain.
Insight: Sunflower oil is a “seed-to-port-to-tank” supply chain where crushing yield, refining losses, winterization clarity, packaging materials, and tank logistics are the repeatable cost anchors—regardless of market cycles.
Data: Global export availability is structurally concentrated in the Black Sea (Ukraine/Russia), with alternative origin depth mainly in Argentina and parts of Eastern Europe. This concentration repeatedly shifts freight/insurance routing and port-to-port feasibility more than it changes the basic processing steps. [2]
Procurement impact: Your landed cost and continuity depend less on “who quotes best” and more on (1) which node you’re buying from (crude vs refined vs packed), (2) which physical constraints you inherit (winterization/dewaxing, tanks, packaging lines), and (3) which specs force rework or yield loss.
Insight: Sunflower oil flows through five physical conversion points; each adds loss risk (yield), constraint risk (capacity), or compliance risk (spec testing).
Data: The industry’s canonical conversion sequence is: seed handling → crushing/extraction (crude oil + meal) → refining (degum/neutralize/bleach/deodorize) → dewaxing/winterization (for clarity) → bulk/retail packaging → distribution. FAO processing references describe dewaxing/winterization as a typical step for sunflower to prevent wax-related cloudiness. [1]

Procurement impact: The “same” sunflower oil can be commercially different depending on where you enter the chain:
Quick win: Map your current buys to these nodes first; most cost surprises come from node mismatch (e.g., buying “refined” that still needs winterization for your climate/appearance standard).
Insight: Seed is the dominant mass input; the oil content of seed and post-harvest handling quietly set the should-cost of crude oil.
Data: Sunflowerseed requires drying/cleaning and storage discipline; moisture and quality degradation increase losses and can elevate refining difficulty downstream. The Black Sea region’s scale makes it a structural supply anchor for seed and oil flows. [2]
Procurement impact: Even when you buy refined oil, upstream seed quality shows up later as:
Key takeaways: Oil-content variability and storage quality are “hidden cost drivers” that don’t appear on a COA line item but drive yield and rework.
Insight: Crushing economics are two-product economics: oil cost is net of meal/hulls value, and plant run-rates are constrained by seed availability and extraction efficiency.
Data: Standard processing yields crude oil plus meal/cake; FAO references describe pressing and/or solvent extraction followed by clarification, with meal as the key co-product. [1]
Procurement impact: For physical availability, this node is where allocation happens first when seed is tight:
Critical risk factors: Limited crush capacity in a given origin corridor can create “paper availability” (offers) without physical loadability.
Insight: Refining cost is dominated by loss control (yield) and energy/consumables (chemicals + bleaching earth + steam/vacuum).
Data: FAO references describe the core steps as degumming, neutralization, drying, bleaching, deodorization, and include dewaxing for sunflower; neutralization becomes more loss-prone as FFA increases due to soapstock formation (neutral oil loss). [1]
Procurement impact: Refining is where “spec compliance” becomes real cost:
Quick win: Treat refining yield loss as a physical KPI (not just a plant metric). If you source crude, refining loss is part of your delivered cost.
Insight: Sunflower oil’s wax content makes appearance (haze) a structural constraint—especially for retail bottles and cooler climates.
Data: FAO processing guidance explicitly notes that sunflower oil may require a dewaxing (winterization) step: cooling to crystallize waxes, followed by filtration, to prevent cloudiness and settling. [1]
Procurement impact: This step is a classic “surprise bottleneck” because it requires:
Key takeaways: If your product spec implicitly demands “clear and bright,” you are effectively buying winterization capacity—even if it’s not priced as a line item.
Insight: Packaging is often the most non-oil cost-heavy node: resin/metal, line efficiency, labeling compliance, and damage risk dominate.
Data: Codex’s Standard for Named Vegetable Oils provides common quality characteristics used in trade and QA discussions (e.g., limits for volatile matter, insoluble impurities, soap content, and peroxide value for refined oils), which buyers operationalize through COAs and release testing. [4]
Procurement impact: Physical constraints here are:
Quick win: Separate “oil quality” from “pack integrity” in your incoming QA plan; many complaints are packaging- or handling-driven rather than refinery-driven.
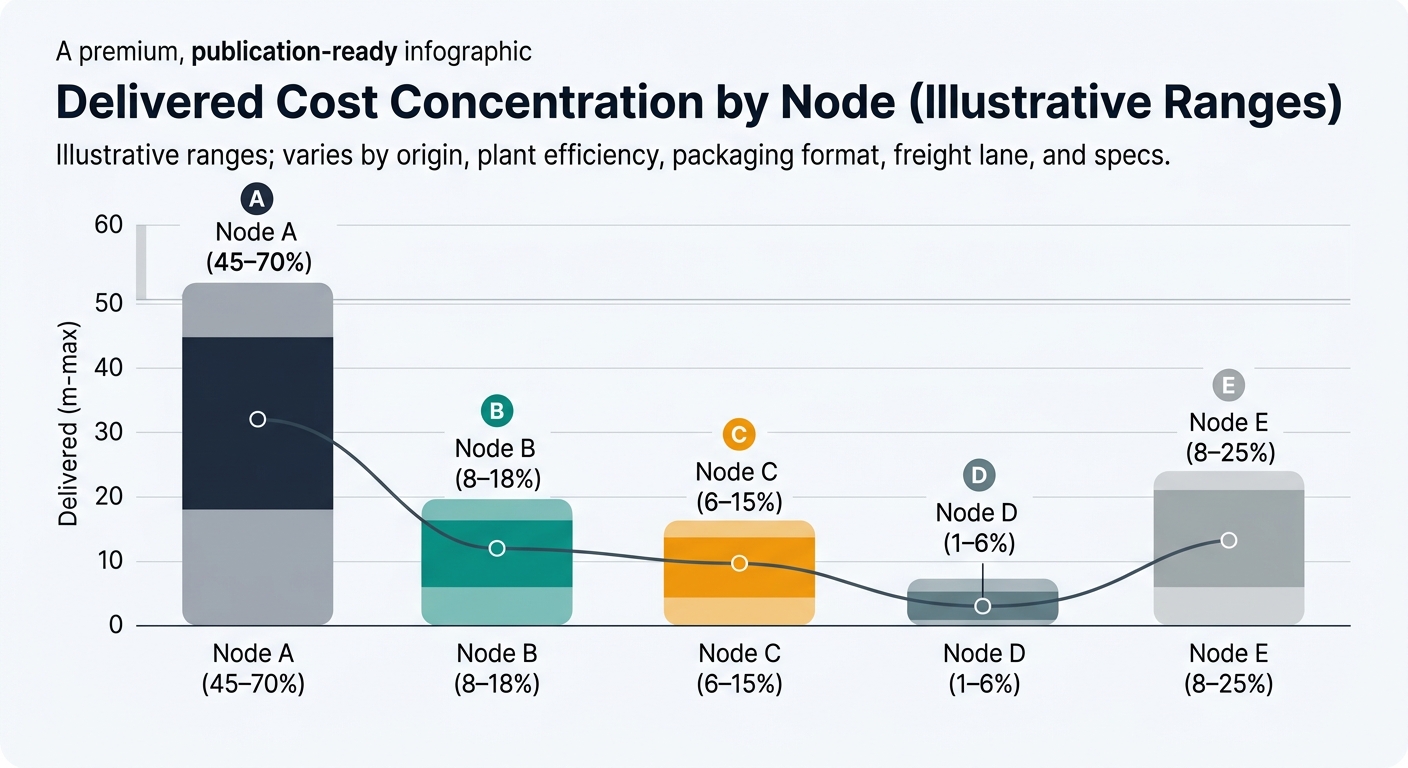
Note: These are illustrative ranges showing where cost typically concentrates by product form. Actual ratios vary by origin, plant efficiency, packaging format, freight lane, and spec stringency.
| Node | What you’re paying for | Typical share of delivered cost (range) |
|---|---|---|
| A. Seed production & aggregation | seed value + drying/cleaning + storage loss | 45–70% |
| B. Crushing/extraction | OPEX + working capital + yield + meal credit mechanics | 8–18% |
| C. Refining (RBD) | chemicals/energy + yield loss + QA | 6–15% |
| D. Dewaxing/winterization | cooling/filtration + media + time | 1–6% |
| E. Packaging + distribution | packs + bottling + warehousing + last-mile | 8–25% |
| Cost element | Bulk crude (CSFO) | Bulk refined (RBD/RSFO) | Retail packed (PET/tins) |
|---|---|---|---|
| Seed + crush economics | Very high | High | High |
| Refining loss/consumables | Buyer inherits (if self-refining) | Embedded | Embedded |
| Dewaxing requirement | Sometimes | Often embedded | Usually required for clarity |
| Packaging materials | Low | Low–medium | High |
| QA & release testing | Medium–high | Medium | High (plus label/claims checks) |
| Symptom | Most common physical root cause | Node most associated |
|---|---|---|
| Haze/cloudiness in bottle | residual waxes / poor winterization filtration | D |
| High refining loss | high FFA/phosphatides; aggressive neutralization | C |
| Off-odor/off-flavor | oxidation, insufficient deodorization, storage exposure | C / E |
| Color variability | pigment load; bleaching effectiveness | C |
| Short shelf life | oxidation exposure (light/heat/headspace), peroxide management | E |
Insight: Sunflower oil is not just an agricultural commodity; it’s a corridor commodity.
Data: USDA and academic/industry analyses continue to describe Ukraine as a major sunflower complex exporter with war-driven logistics constraints; broader trade research also highlights the outsized role of Ukraine and Russia in global sunflower oil exports. [2]
Procurement impact: Physical loadability (ports, tanks, insurance) can become the binding constraint faster than production.
Insight: Two oils that both meet “refined sunflower oil” labeling can behave differently in your plant and on shelf.
Data: FAO processing guidance explicitly includes dewaxing/winterization for sunflower oil to avoid cloudiness and settling, which is why many buyers operationally treat “winterized” as a practical sub-grade for clarity-sensitive applications. [1]
Procurement impact: If you sell into retail or any application where clarity matters, you are exposed to winterization capacity and filtration performance—not just refinery nameplate capacity.
Insight: Refining decisions are measured in basis points of loss, but they compound across tonnes.
Data: Refining guidance emphasizes minimizing neutral oil loss; higher-FFA crude oils increase neutralization losses because more soapstock is formed. [1]
Procurement impact: When you buy crude or semi-refined, your total cost of ownership is driven by your yield discipline and QA capability as much as supplier price.
Once you’ve mapped your buys to the correct physical node (crude vs refined vs winterized vs packed), the hardest ongoing problem becomes separating true spec-driven cost (yield loss, winterization, packaging) from corridor-driven constraints (loadability, tanks, route feasibility)—because both show up as “price and availability,” but require different internal responses.
See These Cost Structures Shift in Real Time
Tridge Eye — The supply chain breakdown you just read is a snapshot. Costs, margins, and risk profiles change daily — and the teams that track them in real time consistently out-source their competitors.


