
This report is powered by Tridge Eye Data Intelligence.
Every data point, price signal, and supply risk insight in this analysis comes from the same platform that procurement and sourcing leaders worldwide rely on daily. As you read, consider what this level of market intelligence could do for your sourcing decisions.
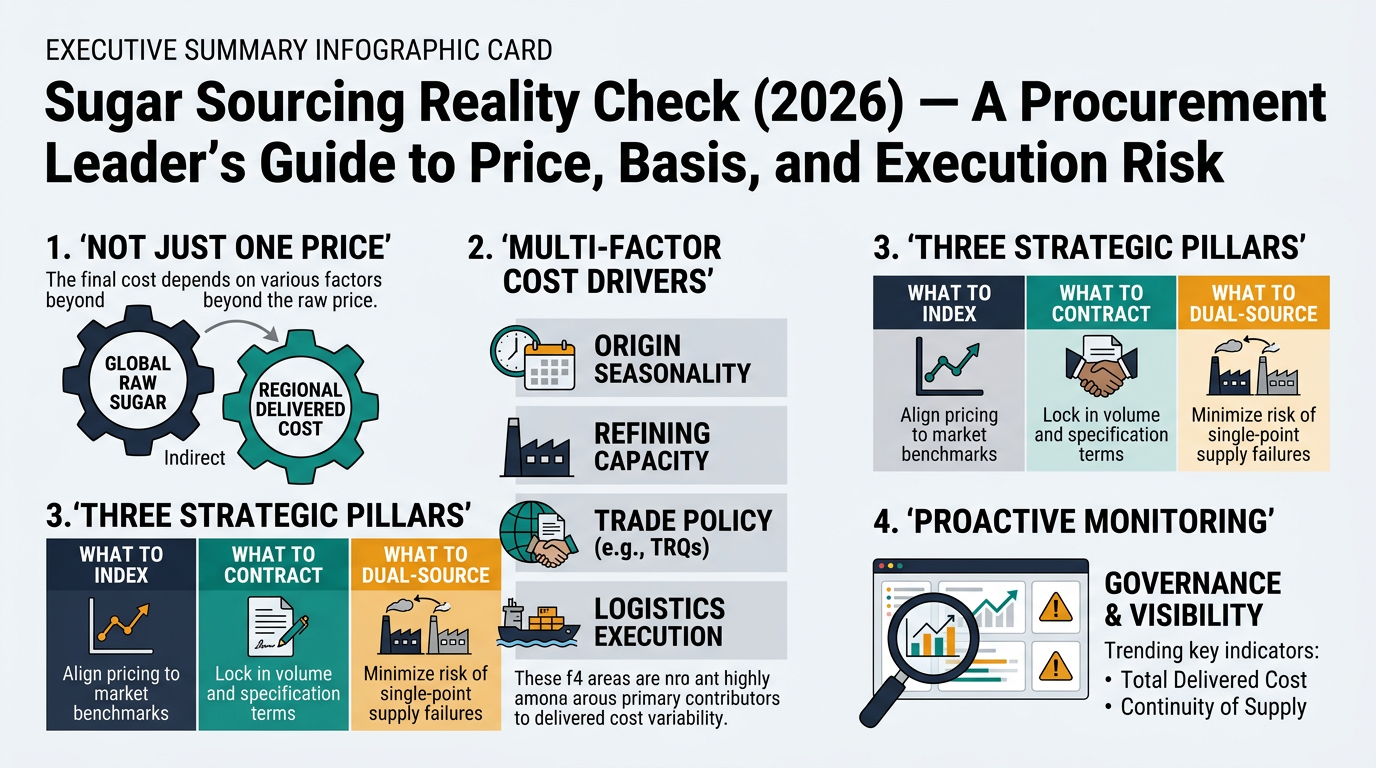
Sugar looks straightforward on a spec sheet, but procurement outcomes rarely are. The same ICUMSA target can land at very different delivered costs depending on origin seasonality, refining capacity, trade policy (e.g., TRQs), and logistics execution. This guide translates “how sugar really moves” into practical procurement decisions—what to index, what to contract, what to dual-source, and what to monitor—so you can control total delivered cost, protect continuity, and document governance.
(Analyzed at: Mar, 2026)
Sugar looks simple on a spec sheet (ICUMSA, polarization, moisture, granulation, packaging). In practice, your delivered outcome is shaped by where sucrose is produced (cane vs beet), how it’s processed (raw vs refined), and how it moves (bulk vs container/bagged).
Below is a procurement-oriented view of cost and margin build by node. The goal is not to “predict price,” but to show where your negotiation leverage exists and where you should manage execution risk.
Key insight: Farm economics influence supply response, but procurement volatility is often driven by how farm output translates into exportable sugar after weather, policy, and milling constraints.
What drives cost here (procurement-relevant):
Sourcing implication: If your portfolio is concentrated in one cane origin, you’re implicitly concentrated in that origin’s weather and harvest logistics.
Key insight: Mills are not “pure sugar businesses.” Their margin is buffered or amplified by byproducts and alternative revenue pools (notably ethanol in major cane markets). This is why sugar availability can change even when global food demand is stable.
What drives cost/margin here:
Sourcing implication: Counterparty risk often rises when prices spike because mills/traders face larger margin calls and working-capital strain.
Key insight: Refining is where “commodity” becomes “manufacturing-grade.” Refining capacity and run-rate constraints can create regional basis premiums even when raw sugar is available.
What drives cost/margin here:
Sourcing implication: If you buy refined sugar, you’re buying both the raw sugar market and a local/region refining capacity market.
Key insight: Packaging is a small unit-cost line item until it isn’t—when humidity, caking, contamination claims, or labeling/certification gaps trigger rejections, downtime, or expedited replacements.
What drives cost/margin here:
Sourcing implication: For industrial users, the cost of a quality failure can dwarf a small $/MT price win.
Key insight: Sugar logistics are not uniform:
What drives cost/margin here:
Sourcing implication: Landed-cost volatility can be freight- and port-driven even when the commodity leg is stable.
Key insight: The more intermediated the chain (trader → importer → distributor), the more your outcome depends on contract clarity (spec, claims, delivery windows) and counterparty performance—not just market direction.
These are modeled “order-of-magnitude” ratios to help procurement teams frame where cost accumulates. Actual splits vary by origin, contract terms, freight mode, duty regime, and whether you buy direct vs via trader. Use these as a discussion tool, not a pricing model.
Supply Chain NodeCost Ratio (% of delivered cost)NotesFarm (cane/beet)25%–35%Yield drives effective cost per ton of sugarMilling / primary processing20%–30%Recovery + campaign efficiencyRefining0%Not included (raw delivered)Packaging & QA0%–3%Minimal (bulk)Logistics & distribution20%–35%Bulk freight + port + demurrage riskTrader/importer margin & financing10%–20%Credit, risk, inventory carry
Supply Chain NodeCost Ratio (% of delivered cost)NotesFarm (cane/beet)15%–30%Upstream share diluted by downstream value-addMilling / primary processing10%–25%Raw sugar productionRefining10%–25%Energy + yield loss + capacity premiumPackaging & QA5%–15%Bags/FIBCs, QA, documentationLogistics & distribution15%–30%Containers, inland drayage, port feesTrader/distributor margin & financing8%–18%Service, credit, inventory
Supply Chain NodeCost Ratio (% of delivered cost)NotesFarm (cane/beet)10%–25%Input sugar shareMilling / primary processing10%–20%Raw sugar baseRefining + liquid conversion15%–30%Hygienic processing, tanksPackaging & QA5%–12%Tanker/ISO handling + testingLogistics & distribution10%–25%Specialized transport, schedulingManufacturer margin & service10%–25%Reliability + working capital

For procurement decision-making, sugar behaves like two linked markets:
Procurement takeaway: Even perfect commodity timing can be overwhelmed by quota access, freight, or refinery run-rate constraints.

Procurement teams often index sugar to a benchmark (or use “last price paid”) and assume delivered cost will track it. The gap usually comes from three disconnects:
Procurement takeaway: Treat sugar as a portfolio of exposures: commodity + basis (policy/refining) + execution (freight/ports/service).
Sugar trips up experienced category managers because it blends commodity behavior with food manufacturing and policy constraints.
This is not about “beating the market.” It’s about making decisions that are defensible, repeatable, and resilient.
Minimum intelligence set that changes decision quality:
Decision: Spot vs contract coverage; index choice; reopener clauses.
Decision: dual-source design, backup origins, safety stock policy.
Decision: bulk vs container, bag size, port pairings, inland routing.
Decision: credit terms, performance clauses, supplier approval and monitoring.
Sugar is a clean example of a broader procurement truth: commodity-linked inputs fail when you manage them like simple commodities.
Generalizable lesson: Build category strategy around (1) price exposure, (2) basis exposure, (3) execution exposure—and govern it with triggers.
Sugar is powerful as a “teaching category” because it makes the hidden drivers visible:
“We didn’t just chase the lowest quote. We designed a portfolio that balances delivered cost, continuity, and compliance—with clear triggers for when we shift volume.”
That’s the difference between buying sugar and managing a sugar supply chain.

Make Faster, Data-Driven Sourcing Decisions
The insights in this report are just the starting point. Tridge Eye is the data intelligence solution that gives procurement and sourcing leaders real-time market signals, price benchmarks, and supply risk alerts — so you can act before the market moves.


