INDUSTRY TRENDS

Soybean Oil Sourcing Intelligence to Reduce Budget Variance and Allocation Risk (Procurement Guide)

Author
Team Tridge
DATE
March 25, 2026
8 min read
soybean-oil Cover
Tridge Eye Data Intelligence Solution

This report is powered by Tridge Eye Data Intelligence.

Every data point, price signal, and supply risk insight in this analysis comes from the same platform that procurement and sourcing leaders worldwide rely on daily. As you read, consider what this level of market intelligence could do for your sourcing decisions.

Explore Tridge Eye →

Soybean oil sourcing rarely fails because teams “didn’t negotiate hard enough.” It fails when procurement decisions are made using a single headline price and a single incumbent quote—while the real constraints sit in crush economics (meal vs oil), refining/packaging capacity, and lane-specific bulk logistics. This guide translates those realities into procurement actions: how to structure contracts, how to benchmark quotes correctly, and how to pre-qualify alternatives before the market turns allocation-driven.

Executive Summary

  • Soybean oil is a co-product market: oil availability is structurally tied to soymeal demand and crush incentives—not purely edible-oil demand.
  • Biofuels materially change allocation behavior: USDA projected 2025/26 U.S. soybean oil use for biofuels at ~15.5 billion lbs, described as over half of U.S. soybean oil production/use in that outlook cycle—tightening the balance sheet and increasing “allocation-first” supplier behavior in tight periods [1].
  • Delivered price is a stack of spreads: bean price, crude→RBD conversion, specialty processing (e.g., winterization), packaging, and lane logistics can decouple.
  • Midstream constraints are often the real bottleneck: tank availability, heating/pumpability, contamination control, and freight cycles can dominate the delivered premium even when ex-works prices look similar.
  • Management-ready sourcing approach: segment volumes (baseline vs flexible), tier suppliers by spec + lane + packaging, and run risk triggers tied to objective signals (stocks/use, policy, outages, logistics).

Key Insights

(Analyzed at: Mar, 2026)

  • Strategy: Hold
  • Reliability: Medium
  • Potential Saving: 4% ~ 9%
  • Insight: Treat 2026 soybean-oil procurement as an “allocation-risk” category, not just a price category. With biofuel pull still a major structural demand component in USDA’s 2025/26 outlook (and policy-driven volatility around RFS/clean-fuel incentives), prioritize (1) locking continuity volumes with index-linked guardrails where feasible and (2) pre-qualifying at least one alternate refiner/packer per critical lane/spec. The savings comes less from calling the absolute low price and more from reducing emergency buys, demurrage, and last-minute packaging premiums when markets tighten [1].

1) What you are actually buying: the real soybean-oil flow (ground truth)

Soybean oil looks like a simple edible ingredient, but procurement outcomes are driven by a co-product industrial system (crush + refining + bulk logistics) with several pinch points.

A clean, industrial supply-chain flow diagram showing: Soybeans (farm/elevator) → Crush/Extraction (outputs: crude/degummed soybean oil + soybean meal + optional lecithin) → Refining (RBD) with optional winterization/fractionation callout → Packaging/Loading (bulk tank truck/rail/ISO vs drums/IBCs) → Logistics & Storage (tank farms, heating/pumpability, contamination control, demurrage risk) → End Use split: Food vs Biofuels as competing demand pull, with pinch-point callouts for crush incentives, refining/packaging capacity, and lane-specific logistics.

Physical flow (typical food-grade RBD soybean oil)

  1. Soybeans (farm → elevator)
  2. Crush / extraction (crusher) → outputs are crude/degummed soybean oil + soybean meal (plus hulls; lecithin can be recovered from degumming)
  3. Refining (refiner)RBD soybean oil (often with optional winterization/fractionation for low cloud point)
  4. Packaging / loading → bulk (tank truck/rail/ISO) or packaged (drums/IBCs/retail)
  5. Logistics & storage → tank farms, heating/pumpability management, contamination control
  6. End use → food manufacturing/foodservice/retail; competing pull from biofuels (renewable diesel/biodiesel)

Procurement reality that surprises non-specialists

  • Oil availability is not “made to order.” It is a co-product of how much the industry decides to crush soybeans, which is heavily influenced by soymeal economics.
  • The “supplier” on your contract may control only one node (refining, packaging, or distribution), while your risk sits upstream (crush economics, feedstock origin) and midstream (tank capacity, railcars, port congestion).
  • In the U.S., soybean oil demand from biofuels has been large enough in USDA outlook discussions that biofuels were projected to consume more than half of U.S. soybean oil in the 2025/26 marketing year outlook cycle (with ~15.5 billion lbs cited in July 2025 WASDE commentary), which changes allocation behavior during tightness [1].

2) Where the money really goes: cost & margin build-up by node (with product-level examples)

Key insight: In soybean oil, the biggest cost lever is not refining or packaging—it’s the bean-to-oil conversion economics (crush margins) plus the buyer’s lane/spec constraints that determine who can physically supply you.

2.1 Upstream: Soybeans (raw material)

What matters for procurement leaders

  • The soybean itself is the dominant cost input.
  • Regional basis (local supply/demand + freight) matters as much as “board price.”

Cost drivers

  • Soybean price level + basis
  • Yield and weather risk (U.S./Brazil/Argentina)
  • Storage/financing costs for elevators and crushers

2.2 Primary processing: Crushing & extraction (co-product economics)

What matters

  • Crushing economics are governed by the crush spread (value of meal + oil minus bean cost) [2].
  • A change in soymeal demand can raise crush even if edible-oil demand is flat; conversely, if meal weakens, crushers may not chase oil demand without margin support.
  • Capacity additions can change local basis and lane economics, but they don’t eliminate allocation risk when downstream demand (e.g., biofuels) tightens the oil balance sheet.

Cost drivers

  • Energy (steam/electricity), solvent (hexane), yield losses
  • Plant utilization and downtime
  • Working capital (large lots; volatile prices)

2.3 Secondary processing: Refining (RBD) + optional winterization

What matters

  • Refining is where food-grade specs are achieved (odor/taste neutrality, low FFA, light color, oxidative stability).
  • Deodorization is a major step and has both quality and cost implications; deodorizer distillate can have meaningful value (offset to refining economics) [3].

Cost drivers

  • Energy for deodorization, refining aids (caustic, bleaching earth)
  • Yield loss (neutral oil loss)
  • QA/testing and segregation (especially for specialty oils)

2.4 Packaging & QA (bulk vs packaged)

What matters

  • Packaging can swing your delivered cost materially (bulk vs drums/IBCs vs retail).
  • QA is not optional: batch CoAs and method consistency reduce claim risk.

Cost drivers

  • Packaging materials (resin, drums/IBC availability)
  • Line time and labor
  • Lab testing, retain samples, traceability documentation

2.5 Logistics & distribution (often the hidden “premium”)

What matters

  • Bulk edible oils are constrained by tank availability, heating/pumpability, and contamination control.
  • Freight and demurrage can dominate the “difference” between two suppliers with similar ex-works pricing.

Cost drivers

  • Truck/rail availability, tank storage fees
  • Port congestion, demurrage, insurance
  • Inventory carrying cost (large lots)

Product-level cost breakdown (illustrative, delivered-to-plant)

Modeled ratios to show where cost concentrates by product form. Actuals vary by region, contract terms, and tightness.
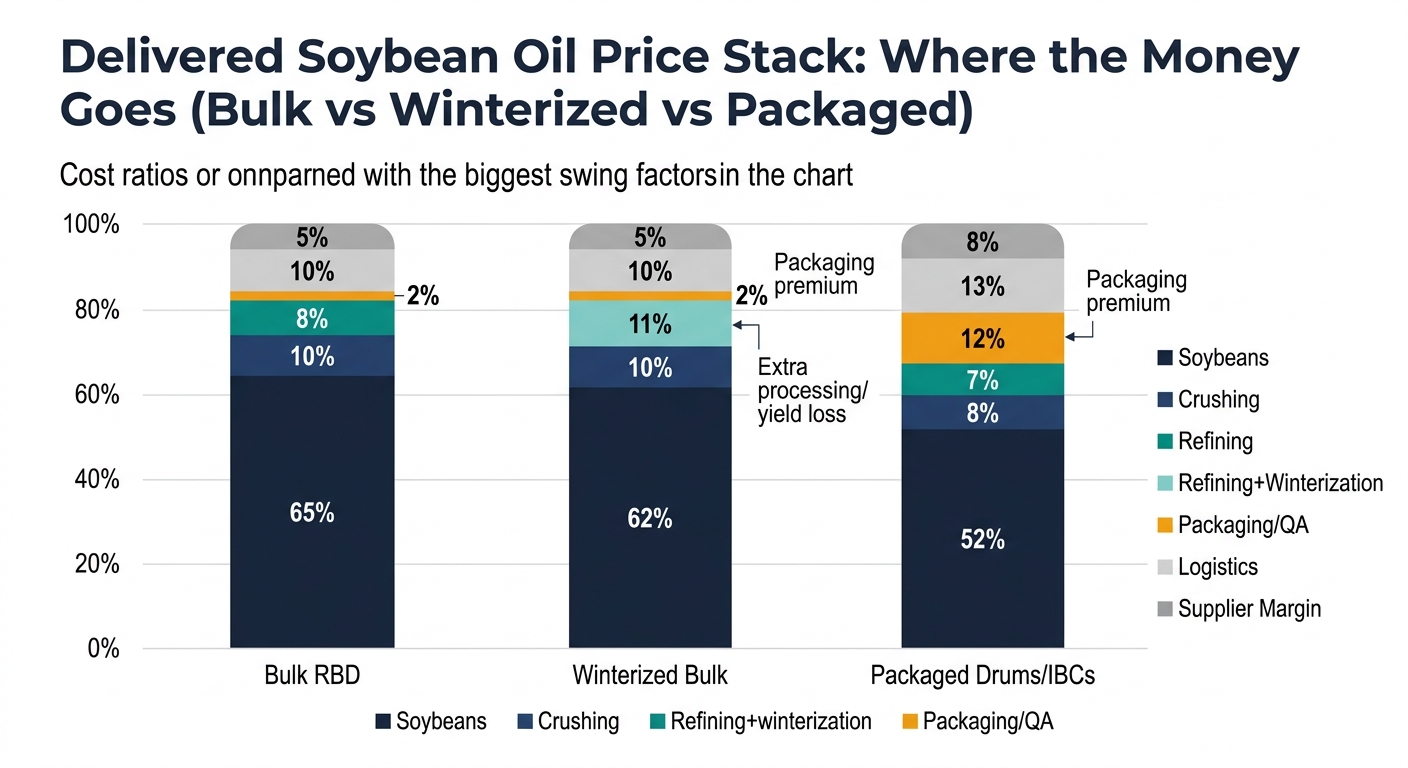
A stacked bar chart comparing delivered cost ratios for three product forms. Bar A (Bulk RBD): Soybeans 65%, Crushing 10%, Refining 8%, Packaging/QA 2%, Logistics 10%, Supplier margin 5%. Bar B (Winterized bulk): Soybeans 62%, Crushing 10%, Refining+winterization 11%, Packaging/QA 2%, Logistics 10%, Supplier margin 5%. Bar C (Packaged drums/IBCs): Soybeans 52%, Crushing 8%, Refining 7%, Packaging/QA 12%, Logistics 13%, Supplier margin 8%. Includes annotations highlighting biggest swing factors: Packaging premium (C) and Extra processing/yield loss (B).

A) Bulk RBD soybean oil (domestic/regional lane)

Supply chain node Cost ratio (% of delivered cost) What moves it most
Soybeans (raw material) 65% Futures + basis + yield risk
Crushing/extraction 10% Crush margin, energy, utilization
Refining (RBD) 8% Energy, yield loss, refining aids
Packaging & QA (bulk loading) 2% CoA/testing, loading controls
Logistics & distribution 10% Truck/rail, tank storage, demurrage
Distributor/supplier margin 5% Allocation behavior, service level

B) Winterized / low-cloud-point soybean oil (bulk)

Supply chain node Cost ratio (% of delivered cost) What moves it most
Soybeans (raw material) 62% Same as above
Crushing/extraction 10% Same as above
Refining + winterization 11% Extra processing, yield loss, scheduling
Packaging & QA (bulk loading) 2% Extra QC parameters
Logistics & distribution 10% Cold-weather handling, heating
Distributor/supplier margin 5% Specialty availability

C) Packaged foodservice (drums/IBCs) RBD soybean oil

Supply chain node Cost ratio (% of delivered cost) What moves it most
Soybeans (raw material) 52% Bean price level
Crushing/extraction 8% Crush economics
Refining (RBD) 7% Energy, yield
Packaging & QA (drums/IBCs) 12% Packaging availability, labor
Logistics & distribution 13% LTL vs FTL, warehousing
Distributor/supplier margin 8% Service, inventory position

3) The structural fact that governs your sourcing outcomes: soybean oil is “pulled” by meal and fuel

Important structural fact: Soybean oil supply is structurally tied to (1) soymeal demand (animal feed) and (2) biofuel policy-driven demand (renewable diesel/biodiesel).

What this means in practice:

  • When biofuel economics/policy tighten the market, suppliers may shift from “quote-driven” to allocation-driven behavior.
  • USDA commentary in 2025/26 outlook discussions highlights that biofuel-driven demand can materially change the oil balance sheet—affecting exports, stocks, and how quickly the market moves from “competitive quotes” to “who gets volume” [1].

4) The critical insight: why your supplier quote can diverge from “market price”

The critical insight: In soybean oil, price is not one number. Your delivered cost is a stack of spreads that can decouple:

  1. Bean price vs oil price
  2. Oil can rally even when beans are steady if biofuel demand tightens oil stocks.
  3. Crude vs RBD vs winterized spreads
  4. Refining capacity and scheduling constraints create premiums for food-grade and specialty specs.
  5. Bulk vs packaged spreads
  6. Packaging materials and line capacity can create a separate inflation cycle.
  7. Lane premiums
  8. A “cheap” supplier in a distant lane can be more expensive after freight, demurrage, and inventory carrying costs.

Practical takeaway for management

Your negotiation leverage improves when you can separate:

  • commodity value (what should track market)
  • from conversion value (crush/refining)
  • from service & logistics value (what you should pay a premium for only when it protects continuity).

5) Where procurement teams typically get soybean oil wrong (patterns that create avoidable cost and risk)

  1. Treating soybean oil like a standalone ingredient
  2. Missing the meal and biofuel pull leads to late reactions and emergency buys.
  3. Over-indexing on the lowest quote without lane/spec normalization
  4. Comparing a winterized, tight-color spec quote to a standard RBD quote is a false saving.
  5. Underestimating midstream constraints
  6. Tank availability, railcar cycles, and heating/pumpability constraints become the real bottleneck.
  7. Qualification only after disruption
  8. Switching suppliers under time pressure increases quality-claim and downtime risk.
  9. Weak governance artifacts
  10. Inconsistent CoAs, unclear test methods, and poor corrective-action tracking make supplier performance “arguable” rather than manageable.

6) How intelligence-driven sourcing changes the outcome (without pretending to predict prices)

This doesn’t predict the market; it improves decision timing and options.

Capability 1: Price intelligence & trend analysis → better contract structure decisions

Decision it changes: spot vs term, and where to use index-linking (where feasible) vs fixed pricing.

What intelligence adds

  • Break the delivered price into drivers (beans, crush, refining, logistics) so you can:
  • set negotiation guardrails by lane/spec
  • define variance thresholds for budget control
  • Track volatility signals tied to biofuel-driven tightening (USDA balance sheet shifts and policy signals).

Measurable outcomes

  • Reduced price variance vs budget
  • Fewer emergency buys at peak premiums

Capability 2: Alternative supplier identification + benchmarking → resilience without overpaying

Decision it changes: supplier tiering (primary/secondary/tertiary) by spec + lane + packaging.

What intelligence adds

  • Maintain a living bench of alternates that are actually feasible:
  • can meet food-grade specs
  • have the right packaging/loading capability
  • can serve your delivery lanes with realistic lead times

Measurable outcomes

  • Shorter time-to-switch
  • Lower disruption premium paid under time pressure

7) Strategic use cases procurement leadership can operationalize

  1. Set a category policy for volume segmentation
  2. Lock a baseline (continuity volumes) under more stable terms; leave a controlled tranche flexible.
  3. Supplier tiering by constraint, not by relationship history
  4. Separate tiers for: standard RBD bulk, winterized bulk, packaged foodservice.
  5. Risk-trigger playbook tied to real signals
  6. Example triggers:
  7. tightening oil stocks / rising biofuel pull → pre-book logistics and confirm allocations
  8. refinery outage signals or packaging shortages → activate pre-qualified alternates
  9. Governance system that survives audit and turnover
  10. Standard supplier scorecards: OTIF, claim rate, lead time drift, CoA completeness, corrective-action closure time.

8) Why this matters beyond soybean oil (examples your team likely buys too)

The same intelligence logic applies when the commodity is:

  • Canola/rapeseed oil: tighter regional refining footprints and different cold-flow specs; lane constraints can dominate.
  • Sunflower oil: higher origin concentration and weather sensitivity; substitution dynamics can be sudden.
  • Palm-based fractions (olein/stearin): policy and sustainability documentation can constrain the usable supplier pool.
  • Cocoa: processing capacity (grind) and origin risk create price/availability disconnects similar to crush/refining constraints.

Common thread: the “headline market price” is only one layer; procurement performance depends on understanding the conversion bottlenecks, specifications, and logistics that turn markets into delivered supply.

9) Why soybean oil is an unusually strong proof-point for intelligence-led procurement

Soybean oil is a powerful example because it combines:

  • Co-product economics (meal drives crush decisions)
  • Policy-exposed demand (biofuels can materially tighten the balance sheet) [4]
  • Spec-sensitive usability (RBD vs winterized; color/FFA/peroxide and sensory neutrality)
  • Logistics fragility (bulk tanks, contamination control, heating/pumpability)

For procurement leadership, that means intelligence is not “nice-to-have.” It is what turns soybean oil from a reactive, disruption-priced category into one where you can:

  • explain premiums vs service/spec with evidence
  • pre-qualify alternatives before the market forces your hand
  • reduce cost surprises while protecting continuity
Tridge Eye Data Intelligence Solution

Make Faster, Data-Driven Sourcing Decisions

The insights in this report are just the starting point. Tridge Eye is the data intelligence solution that gives procurement and sourcing leaders real-time market signals, price benchmarks, and supply risk alerts — so you can act before the market moves.

Explore Tridge Eye →

References

  1. soygrowers.com
  2. en.wikipedia.org
  3. aocs.org
  4. epa.gov
Subscribe
By subscribing you agree to with our Privacy Policy and provide consent to receive updates from our company.
Thank you! Your submission has been received!
Oops! Something went wrong while submitting the form.
Subscribe to receive the latest blog posts, updates, promotions, and announcements from Tridge.