
This report is powered by Tridge Eye Data Intelligence.
Every data point, price signal, and supply risk insight in this analysis comes from the same platform that procurement and sourcing leaders worldwide rely on daily. As you read, consider what this level of market intelligence could do for your sourcing decisions.
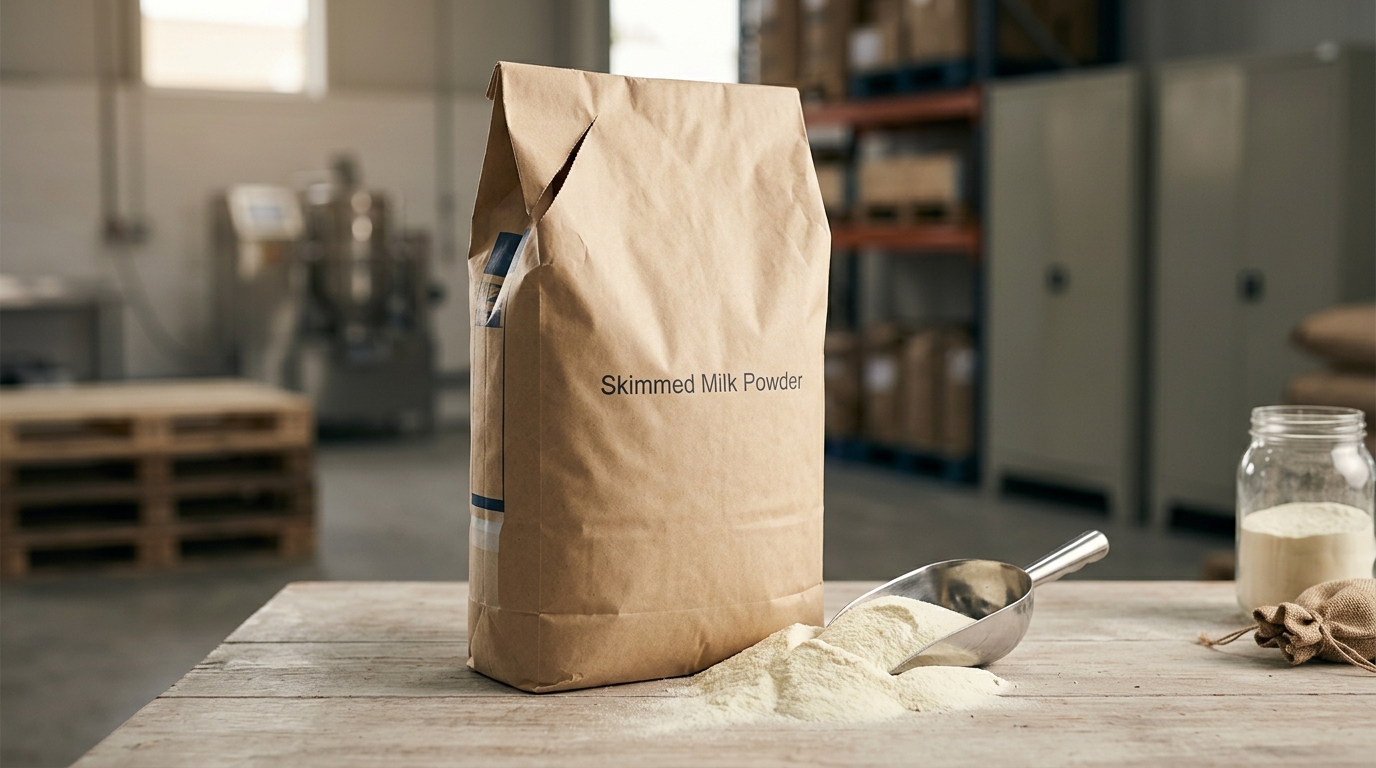
Skim milk powder (SMP) / nonfat dry milk (NFDM) sourcing looks like “just a commodity buy” until you live through an allocation event, a functional failure in a high-heat application, or a lane disruption that turns an attractive benchmark into a bad delivered cost.
This guide is written for Procurement & Sourcing Management teams that are strong in procurement fundamentals but newer to dairy solids. It explains (in plain language) where your cost and risk truly sit across the skimmed-milk supply chain, how to avoid the most common benchmarking and contracting mistakes, and how to operationalize an intelligence-led sourcing playbook that improves both cost control and continuity of supply.
(Analyzed at: Apr, 2026)
Skimmed-milk ingredients look deceptively simple (“just milk solids”), but procurement outcomes are determined by where the product sits in a co-product system and how quickly supply can (or cannot) respond.
Industrial reality in one line: SMP/NFDM is a globally traded way to “store and move” skim solids, but the economics are anchored upstream in raw milk and downstream in butterfat/cream routing decisions.

Spec anchor (why “SMP is SMP” is a trap): Codex defines skimmed milk powder as max 1.5% milkfat, max 5% water, and minimum 34% milk protein in milk solids-not-fat. That sounds straightforward—until your application needs specific heat treatment/functional behavior. [1]
Key insight: For SMP/NFDM, farmgate milk is usually the largest cost driver, but drying capacity and energy often determine who can supply reliably at scale—especially during seasonal flushes or plant disruptions.
What’s happening
Cost drivers procurement should care about
Margin reality (practical framing): Your negotiation leverage is usually higher on basis items (pack, lane, service model, volume bands, allocation terms) than on the underlying “milk cycle.”
What’s happening
Cost drivers
Margin reality
What’s happening
Cost drivers
Margin reality
What’s happening
Cost drivers
Margin reality
What’s happening
Cost drivers
What’s happening
Cost drivers
These are modeled ratios to show where cost concentration typically sits; actual splits vary by origin, energy costs, contract terms, freight, and spec stringency.
| Supply Chain Node | Cost Ratio (% of final delivered cost) | What moves it most |
|---|---|---|
| Farm milk + collection | 55% | Milk supply cycle, feed, weather |
| Separation/primary processing | 8% | Plant utilization, QA rejects |
| Evaporation + spray drying | 15% | Energy, dryer capacity, uptime |
| Packaging & QA release | 5% | Bag/liner costs, testing cadence |
| Logistics & distribution | 7% | Ocean/inland freight, lead time |
| Supplier/trader/distributor margin | 10% | Channel structure, credit/service |
| Supply Chain Node | Cost Ratio (% of final delivered cost) | What moves it most |
|---|---|---|
| Farm milk + collection | 50% | Same as above |
| Separation/primary processing | 8% | Same as above |
| Evaporation + spray drying | 18% | Tighter process control, yield loss |
| Packaging & QA release | 7% | More testing, tighter release gates |
| Logistics & distribution | 7% | Same as above |
| Supplier margin | 10% | Scarcity premium for proven performance |
| Supply Chain Node | Cost Ratio (% of final delivered cost) | What moves it most |
|---|---|---|
| Farm milk + collection | 40% | Milk cycle |
| Separation/primary processing | 7% | Utilization |
| Drying or concentration input | 15% | Energy/capacity |
| Secondary manufacturing (UHT/aseptic) | 18% | Aseptic line utilization, packaging |
| Packaging & QA release | 10% | Aseptic materials, compliance |
| Logistics & distribution | 10% | Weight/volume, warehousing |

Key insight: You can negotiate SMP like a commodity only up to the point where processors must balance the whole milk value stack (cream/butterfat vs skim solids) and capacity constraints.
What this means for procurement management:
Also: export supply is concentrated. WTO data for 2023 shows top exporters’ shares of world SMP exports, highlighting the U.S. (28%), EU (22%), and New Zealand (20%) as leading exporters. [2]
Key insight: The biggest sourcing mistakes happen when teams assume one “SMP price” exists. In practice, your landed price is a blend of:
Example of how benchmarks move (U.S. reference): USDA AMS Dairy Market News publishes monthly averages for NFDM and other dairy commodities; for example, the Feb 2026 CME Group Grade A nonfat dry milk monthly average is shown at $1.6114/lb in the USDA AMS monthly averages report published March 2, 2026. [3]
Use the USDA AMS monthly averages reports (and/or your contracted index source) as the single source of truth for the exact month’s benchmark values. [4]
This is not about more data; it’s about decision support that matches how procurement leadership is measured: cost control + continuity + compliance.
How it changes decisions:
How it changes decisions:
How it changes decisions:
Steps
Trade-off to surface: more coverage reduces downside risk but can cap upside if the market falls.
Steps
Trade-off to surface: alternates increase resilience but add QA workload and governance overhead.
Steps
Trade-off to surface: stricter governance may shrink the supplier pool and raise near-term cost.
Skimmed-milk is a clean example because it combines commodity pricing with hard qualification gates and capacity constraints.
Comparable categories procurement teams often manage:
The common thread: your outcome depends on managing basis risk, qualification lead time, and supplier behavior under stress—not just negotiating price.
Skimmed-milk purchasing makes the hidden procurement mechanics visible:
If you can run SMP this way—where co-product economics, capacity constraints, and QA gates all matter—you can apply the same operating model across a large share of food ingredients.
Make Faster, Data-Driven Sourcing Decisions
The insights in this report are just the starting point. Tridge Eye is the data intelligence solution that gives procurement and sourcing leaders real-time market signals, price benchmarks, and supply risk alerts — so you can act before the market moves.


