INDUSTRY TRENDS

Sesame Seeds Procurement Intelligence Playbook (Validated & Updated for 2026 Buying Decisions)

Author
Team Tridge
DATE
March 17, 2026
10 min read
Sesame Seeds Cover
Tridge Eye Data Intelligence Solution

This report is powered by Tridge Eye Data Intelligence.

Every data point, price signal, and supply risk insight in this analysis comes from the same platform that procurement and sourcing leaders worldwide rely on daily. As you read, consider what this level of market intelligence could do for your sourcing decisions.

Explore Tridge Eye →

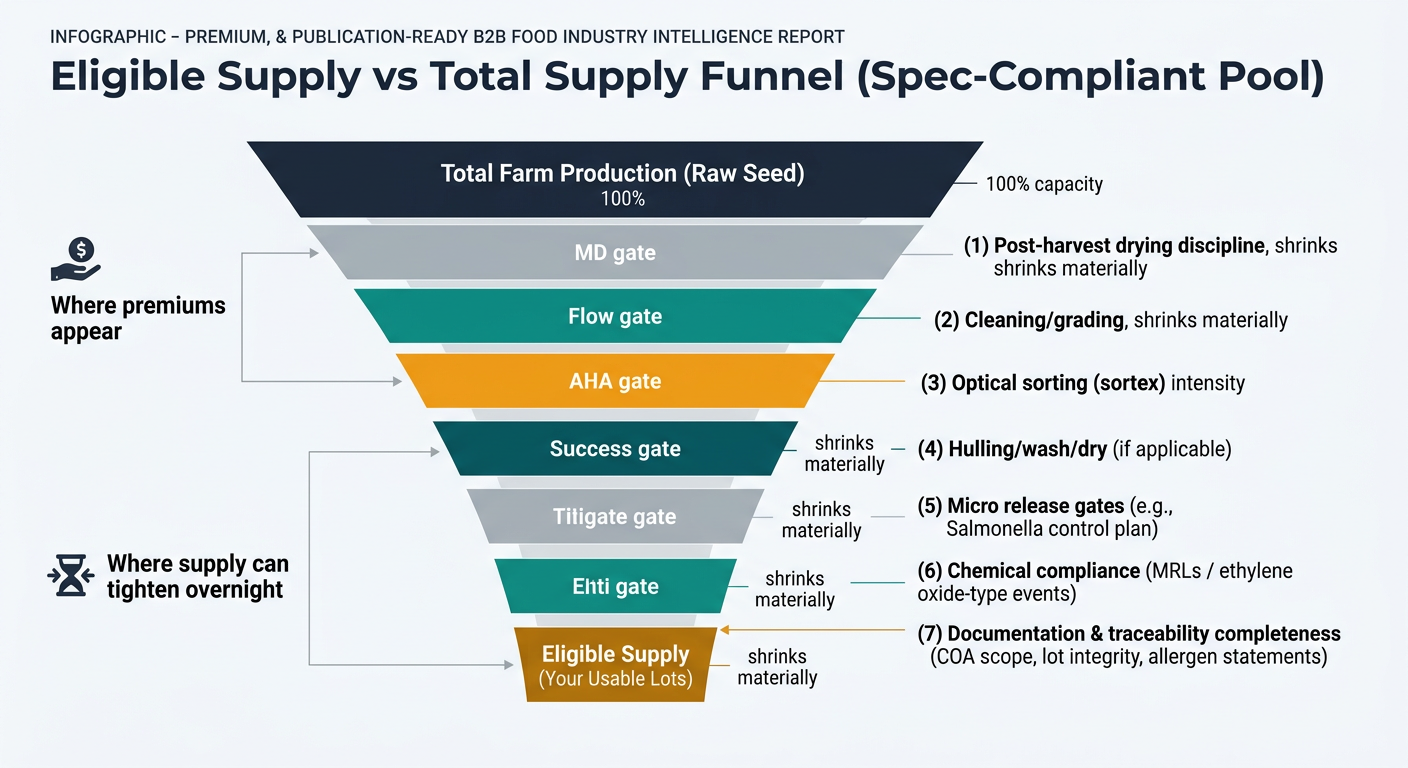
This guide is written for procurement and sourcing managers who are strong in buying fundamentals but newer to sesame. The core message is simple: sesame is not “one commodity.” Your outcomes (price, continuity, and audit readiness) are determined by the eligible supply pool—lots that meet your exact spec, food safety plan, and documentation gates—not by total farm production. Use this playbook to translate market signals (crop, logistics, compliance) into concrete sourcing actions: tighter RFQs, better benchmarks, and pre-qualified alternatives.

Executive Summary

  • Eligible supply vs total supply: The biggest risk and price premium typically sits in spec-compliant, export-ready lots (cleaned/sorted/hulled + documentation), not in “raw seed availability.”
  • Compliance stakes are structurally higher in the U.S. since 2023: Sesame became the 9th major U.S. food allergen with mandatory labeling effective January 1, 2023 (FASTER Act). [1]
  • Compliance shocks can tighten supply overnight: The EU’s ethylene oxide residues incident in sesame from India triggered large-scale tracing/testing and many RASFF notifications starting in September–October 2020, shrinking “eligible” supply. [2]
  • Food safety risk is real in low-moisture sesame products: Tahini recalls for possible Salmonella contamination illustrate downstream exposure even when products are low water activity. [3]
  • Production is concentrated but tradable supply is more nuanced: 2022 global production is commonly cited around ~6.7 million tonnes, led by Sudan, India, Myanmar (FAOSTAT-derived summaries). Treat this as context, not a buying index. [4]
A funnel chart showing total farm production narrowing through post-harvest drying discipline, cleaning/grading, optical sorting (sortex), hulling/wash/dry, micro release gates, chemical compliance (MRLs/ethylene oxide-type events), and documentation/traceability completeness to reach eligible supply (usable lots), with callouts for where premiums appear and where supply can tighten overnight.

Key Insights

(Analyzed at: Mar, 2026)

  • Strategy: Hold
  • Reliability: Medium
  • Potential Saving: 4% ~ 10%
  • Insight: Use the current window to tighten spec discipline and expand your pre-qualified bench, rather than chasing aggressive spot price breaks. In sesame, the repeatable savings come from reducing “spec ambiguity premiums” (RFQs that under-define micro/MRL/foreign matter responsibilities) and from having credible alternates ready when corridor or compliance risk spikes (e.g., EU ethylene oxide-type events; U.S. allergen governance since Jan 1, 2023). Expect mid-single-digit savings from improved benchmarking and fewer holds/rejects; larger upside typically requires a validated origin shift and QA lead time.

1) What you’re actually buying: the real sesame supply chain (ground truth)

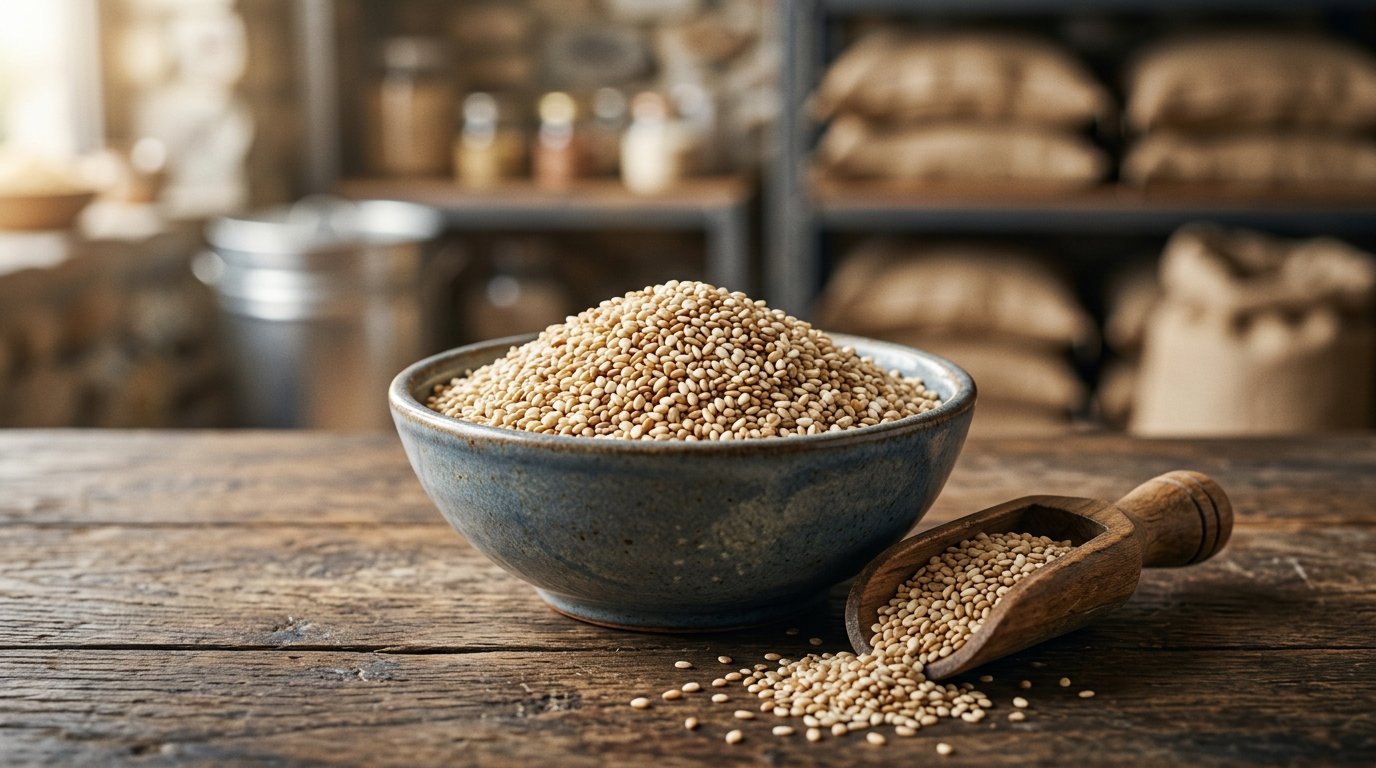
Sesame looks like a simple “seed” line item, but procurement outcomes are driven by where value is created (cleaning, sorting, hulling) and where risk is introduced (post-harvest drying, storage, cross-contamination, export corridors).

Typical B2B flow (food-grade seed to an importing manufacturer)

  1. Farm & aggregation (raw seed)
  2. Mostly smallholder production in many origins; quality consistency is heavily dependent on drying discipline and trader handling.
  3. Primary processing (cleaning & grading)
  4. De-stoning, aspiration, screening; higher specs often require optical sorting (sortex).
  5. Secondary processing (hulled / roasted / paste / oil)
  6. Hulling (mechanical/chemical variants), washing, drying; roasting; grinding to tahini; crushing to oil/meal.
  7. Packaging & QA release
  8. Bagging (25–50 kg) or FIBC; COA, microbiological, pesticide MRLs, foreign matter, moisture.
  9. Logistics & distribution
  10. Inland haul to port can dominate variability in some African corridors; container moisture/condensation is a recurrent quality driver.
  11. Importer / roaster / manufacturer use
  12. Bakery toppings, snack coatings, tahini/hummus, confectionery, oil.

Two realities procurement teams underestimate

  • Food safety is not “a supplier QA problem” only. Sesame is a documented vehicle for microbiological and chemical compliance events in global trade (e.g., EU notifications related to ethylene oxide in sesame from India starting in 2020). [2]
  • Market power sits where cleaning/sortex/hulling capacity is tight. In tight years, “seed availability” and “food-grade, spec-compliant lots” diverge—your supply risk is mostly in the eligible pool, not total production.

2) Where the money goes: cost & margin build-up by node (and why it matters in negotiation)

Below is the practical procurement lens: at each node, what cost drivers create price moves—and what that implies for RFQs, supplier selection, and contract structure.

2.1 Upstream (farm, drying, aggregation): the hidden quality cost center

Key insight: A large portion of downstream claims (odor, moisture, mold risk, foreign matter) are “baked in” before the exporter ever touches the seed.

What drives cost & margin here

  • Farmgate price volatility around harvest campaigns (local supply flush vs hold-back).
  • Drying losses and shrink (moisture management); poor drying increases risk of mold and higher microbial load.
  • Trader aggregation margin and “quality arbitrage” (mixing lots, re-bagging, relabeling risk where governance is weak).

Procurement implication

  • If your spec is strict (low foreign matter, tight micro, tight MRLs), you’re not buying “sesame”; you’re buying disciplined post-harvest handling + traceability.

2.2 Primary processing (cleaning, grading, optical sorting): where food-grade is created

Key insight: Cleaning/sortex is the first major step where yield loss becomes cost (removing stones, dust, broken seed) and where suppliers differentiate.

What drives cost & margin here

  • Yield loss from removing foreign material and off-color seed.
  • Capex/opex of sortex lines, power reliability, rework.
  • Testing and compliance (COAs, third-party labs, document control).

Procurement implication

  • RFQs that only ask for “hulled/natural sesame” without specifying FM, color, micro, MRL regime, and inspection/testing responsibilities invite wide interpretation—and wide price dispersion.

2.3 Secondary processing (hulled / roasted / tahini / oil): value-add with yield and safety consequences

Key insight: Hulling and roasting aren’t just “processing fees.” They change yield, shelf stability, and microbial risk profile—and they concentrate supplier power when capacity is limited.

What drives cost & margin here

  • Hulling yield loss (bran removal + breakage) and energy cost (washing/drying).
  • Roasting energy and process control.
  • Micro risk management for low-water-activity foods (Salmonella can persist in low-moisture products; tahini recalls illustrate downstream exposure). [3]

Procurement implication

  • If you buy hulled for direct food use, you are effectively paying for: higher processing yield loss + tighter QA + more handling steps (more points of failure).

2.4 Packaging & QA release: small % of cost, large % of “stop-ship” risk

Key insight: A single documentation gap (traceability, allergen statement, MRL test scope) can convert a shipment into inventory-on-hold.

What drives cost & margin here

  • Packaging (bags/FIBCs, pallets, liners)
  • Lot integrity controls (segregation, labeling, seal discipline)
  • QA testing cadence and release lead time

Procurement implication

  • Build spec + COA requirements into the contract as “release gates,” not informal expectations.

2.5 Logistics & distribution: inland is often the volatility (not ocean)

Key insight: For several origins, inland trucking to port, border procedures, and port dwell time create bigger lead-time variance than sea freight.

What drives cost & margin here

  • Inland trucking, port handling, demurrage/detention
  • Container moisture risk (condensation) affecting moisture/odor
  • Working capital for inventory coverage

Procurement implication

  • Lead time should be treated as a distribution, not a single number. Contract for OTIF windows and define expedite rules.

2.6 Importer/wholesale margin: the “liquidity premium”

Key insight: Importers earn margin for holding inventory, blending lots, and absorbing compliance risk—especially when buyers want short lead times.

What drives cost & margin here

  • Inventory financing
  • Blending/repacking capability
  • Claims handling and customer service

Procurement implication

  • If you have stable demand, you can often reduce this premium with planned buys + supplier-managed inventory logic (without promising volumes you can’t take).

Product-level cost build (illustrative ratios)

Modeled to show where cost concentrates by product form. Actual ratios vary by origin, crop year, spec strictness, and whether you buy direct from origin or via an importer.

A 100% stacked bar chart comparing cost build-up by node for (A) Natural seed delivered, (B) Hulled white seed delivered, (C) Tahini delivered, and (D) Refined sesame oil delivered, with segments for Farm & aggregation; Cleaning/grading/sortex; Secondary processing; Packaging & QA; Logistics; and Importer/wholesale margin, using the illustrative ratios shown in the tables and noting ratios vary by origin/spec/incoterm.

A) Natural (unhulled) sesame seed, food-grade (delivered)

Supply chain node Cost ratio (% of delivered cost) What moves it most
Farm & aggregation 55% harvest campaign price, local demand
Cleaning / grading / sortex 12% yield loss, sortex intensity
Secondary processing 0% N/A
Packaging & QA 6% testing scope, lot segregation
Logistics (inland + ocean + port) 15% inland bottlenecks, dwell time
Importer/wholesale margin 12% inventory coverage, service level

B) Hulled white sesame seed, bakery/ingredient grade (delivered)

Supply chain node Cost ratio (% of delivered cost) What moves it most
Farm & aggregation 40% raw seed cost baseline
Cleaning / grading / sortex 12% pre-hull cleanliness needed
Hulling + wash + dry 18% yield loss, energy, rework
Packaging & QA 8% micro plan, COA requirements
Logistics (inland + ocean + port) 12% moisture protection, timing
Importer/wholesale margin 10% short lead-time expectations

C) Tahini (sesame paste), industrial (delivered)

Supply chain node Cost ratio (% of delivered cost) What moves it most
Farm & aggregation 28% seed input cost
Cleaning / grading / sortex 8% seed eligibility
Roast + grind + formulation 26% energy, yield, throughput
Packaging & QA 12% jars/drums, micro release
Logistics (inland + ocean + port) 10% weight/pack format
Importer/wholesale margin 16% brand/quality assurance, claims

D) Sesame oil (refined), food (delivered)

Supply chain node Cost ratio (% of delivered cost) What moves it most
Farm & aggregation 25% seed input
Cleaning / grading 5% basic cleanliness
Crushing + refining 35% energy, refining loss, capacity
Packaging & QA 10% bottles/drums, labeling
Logistics 10% weight, handling
Importer/wholesale margin 15% inventory + channel margin

3) The structural facts that should shape your sourcing strategy (not just your RFQ)

  1. Supply is fragmented; compliance capacity is not. Many countries produce sesame, but fewer suppliers can consistently meet tight micro/MRL/foreign matter specs at scale.
  2. Production concentration is real—and shifting. FAOSTAT-derived summaries commonly cite ~6.7 million tonnes global production in 2022, led by Sudan, India, and Myanmar. Use this as context for concentration risk, not as a direct proxy for export availability. [4]
  3. Regulatory exposure is increasing for buyers. In the U.S., sesame became the 9th major food allergen requiring labeling as of January 1, 2023 (FASTER Act), raising governance stakes for manufacturers and co-packers. [1]
  4. Quality/compliance incidents can re-route trade flows overnight. The EU’s 2020 ethylene oxide incident in sesame from India is a canonical example of a compliance shock that tightened “eligible supply.” [2]

4) The critical insight: why “farmgate sesame” and “your spec-compliant sesame” prices disconnect

Procurement teams often expect sesame to behave like a single commodity curve. In practice, sesame behaves like two coupled markets:

  • Market A: bulk seed availability (what farmers produce)
  • Market B: spec-compliant, export-ready, audit-ready lots (what your plant can actually use)

The spread between A and B widens when any of these tighten:

  • Food safety/compliance filters (MRLs, ethylene oxide-type events, micro criteria)
  • Cleaning/sortex capacity constraints (throughput limits)
  • Logistics constraints (inland corridor disruptions creating shipment slippage and aged inventory)

What this means for negotiation

  • If you negotiate only against “origin price talk,” you risk anchoring to Market A while your suppliers are pricing Market B.
  • The right benchmark is comparable suppliers for the same spec + same release gates + same Incoterm.

5) Where procurement teams typically get sesame wrong (and pay for it later)

  1. RFQs that under-spec the risk
  2. Asking for “hulled white sesame” without explicit limits for foreign matter, moisture, micro plan, MRL regime, and inspection/testing responsibilities.
  3. Over-reliance on one origin because it was ‘fine last year’
  4. Concentration feels efficient until a compliance event or corridor disruption forces emergency buys.
  5. Treating lead time as fixed
  6. Teams plan production with a single lead-time number, then get hit by inland/port variance.
  7. Supplier approval is done once, then forgotten
  8. No cadence for monitoring: COA integrity, complaint rates, shipment variability, documentation completeness.
  9. Price focus without total-cost accounting
  10. The cheapest seed can become the most expensive after rejects, holds, extra testing, line downtime, or reformulation constraints.

6) How an intelligence-driven approach changes the outcome (without promising miracles)

This is the playbook that most reliably improves resilience for sesame without inflating cost: Pre-qualify alternatives before disruption hits.

Decision you’re making (management-level)

  • “Do we keep single-sourcing (or single-origin) for this sesame spec, or do we design a bench that can take volume within 30–90 days?”

Minimum intelligence capabilities that change the decision

  • Origin & supply concentration analysis: quantify exposure by origin/spec and identify where switching is feasible.
  • Risk monitoring & early warning: link weather/logistics/regulatory/quality signals to your specific origin footprint.
  • Supplier discovery & longlist building: build a standing bench of suppliers that can meet your spec and documentation requirements.

What changes operationally (procurement actions)

  1. Define “switchability” as a spec + QA package
  2. Create a one-page “sesame spec passport”: form (natural/hulled), FM/moisture limits, micro release gates, MRL regime, allergen/traceability docs, pack format.
  3. Build a dual/tri-source bench by spec tier
  4. Tier 1: current spec (must run tomorrow)
  5. Tier 2: acceptable alternate spec (requires minor process adjustment)
  6. Tier 3: oil-crush diversion spec (last resort continuity)
  7. Set triggers that automatically start contingency workflows
  8. Example triggers: repeated COA anomalies, rising port dwell time in key corridor, repeated RASFF/FDA-type alerts tied to your origin set.
  9. Contracting approach: keep optionality priced
  10. Use staged awards or framework agreements with pre-agreed QA and lead-time terms, so you’re not negotiating from zero in a disruption.
  11. Governance cadence
  12. Quarterly supplier review: OTIF window performance, complaint rate, COA completeness, lot traceability, and corrective actions.

Success metrics (measurable, procurement-owned)

  • Origin concentration: % of volume from top origin (target down over time)
  • Supplier bench depth: # of pre-qualified suppliers that can ship within X days
  • OTIF variance: standard deviation of lead time by corridor
  • Quality cost: holds/rejects per 100 lots; incremental testing spend
  • Price discipline: negotiated price vs benchmark peer set (spread)

7) Strategic use cases procurement leaders can run immediately (sesame-specific)

  1. “Spec-to-market” benchmarking for negotiations
  2. Build a comparable set of suppliers by: origin, hulled vs natural, sortex level, micro plan, certifications, Incoterm.
  3. Origin rebalancing without triggering QA chaos
  4. Model which origins can meet your exact spec; identify what changes (tests, documentation, lead time) are required to switch.
  5. Early-warning driven inventory decisions
  6. Use risk triggers to decide when to add 2–4 weeks of coverage versus staying lean.
  7. Supplier portfolio design by end-use
  8. Bakery topping vs tahini vs oil have different risk tolerances; design sourcing lanes accordingly.
  9. Audit-ready governance
  10. Document why you chose an origin/supplier (cost vs risk vs compliance), and keep the evidence pack current.

8) Why this matters beyond sesame (adjacent categories you likely also buy)

Sesame is a clean example of a broader procurement truth: the tightest constraint is often “eligible supply,” not total supply.

Comparable patterns in adjacent ingredients

  • Spices (e.g., cumin, turmeric, chili): compliance shocks (residues/adulteration) can suddenly shrink the usable supplier pool; having pre-qualified alternates prevents emergency buys.
  • Nuts (e.g., peanuts, almonds, hazelnuts): aflatoxin and foreign matter risks make “cheap lots” expensive; spec discipline and supplier process capability matter as much as origin price.
  • Dried fruits (e.g., raisins, dates): moisture and storage discipline drives mold risk and claims; logistics delays translate directly into quality deterioration.

The procurement muscle you build in sesame—spec passports, bench depth, trigger-based actions, and governance cadence—transfers directly.

9) Why this example is powerful for procurement teams evaluating intelligence-led sourcing

Sesame is a high-signal category because:

  • It combines ag volatility + corridor risk + strict food safety governance.
  • It exposes the common failure mode: negotiating as if it’s one commodity, when it’s really a spec-compliant supply market.
  • It rewards disciplined procurement operations: pre-qualification, comparable benchmarking, and trigger-based contingency—all measurable and auditable.

If you can run sesame like a portfolio (cost + continuity + compliance), you can usually run the rest of your ingredient basket with fewer surprises.

Tridge Eye Data Intelligence Solution

Make Faster, Data-Driven Sourcing Decisions

The insights in this report are just the starting point. Tridge Eye is the data intelligence solution that gives procurement and sourcing leaders real-time market signals, price benchmarks, and supply risk alerts — so you can act before the market moves.

Explore Tridge Eye →

References

  1. fda.gov
  2. food.ec.europa.eu
  3. fda.gov
  4. en.wikipedia.org
Subscribe
By subscribing you agree to with our Privacy Policy and provide consent to receive updates from our company.
Thank you! Your submission has been received!
Oops! Something went wrong while submitting the form.
Subscribe to receive the latest blog posts, updates, promotions, and announcements from Tridge.