
This report is powered by Tridge Eye Data Intelligence.
Every data point, price signal, and supply risk insight in this analysis comes from the same platform that procurement and sourcing leaders worldwide rely on daily. As you read, consider what this level of market intelligence could do for your sourcing decisions.
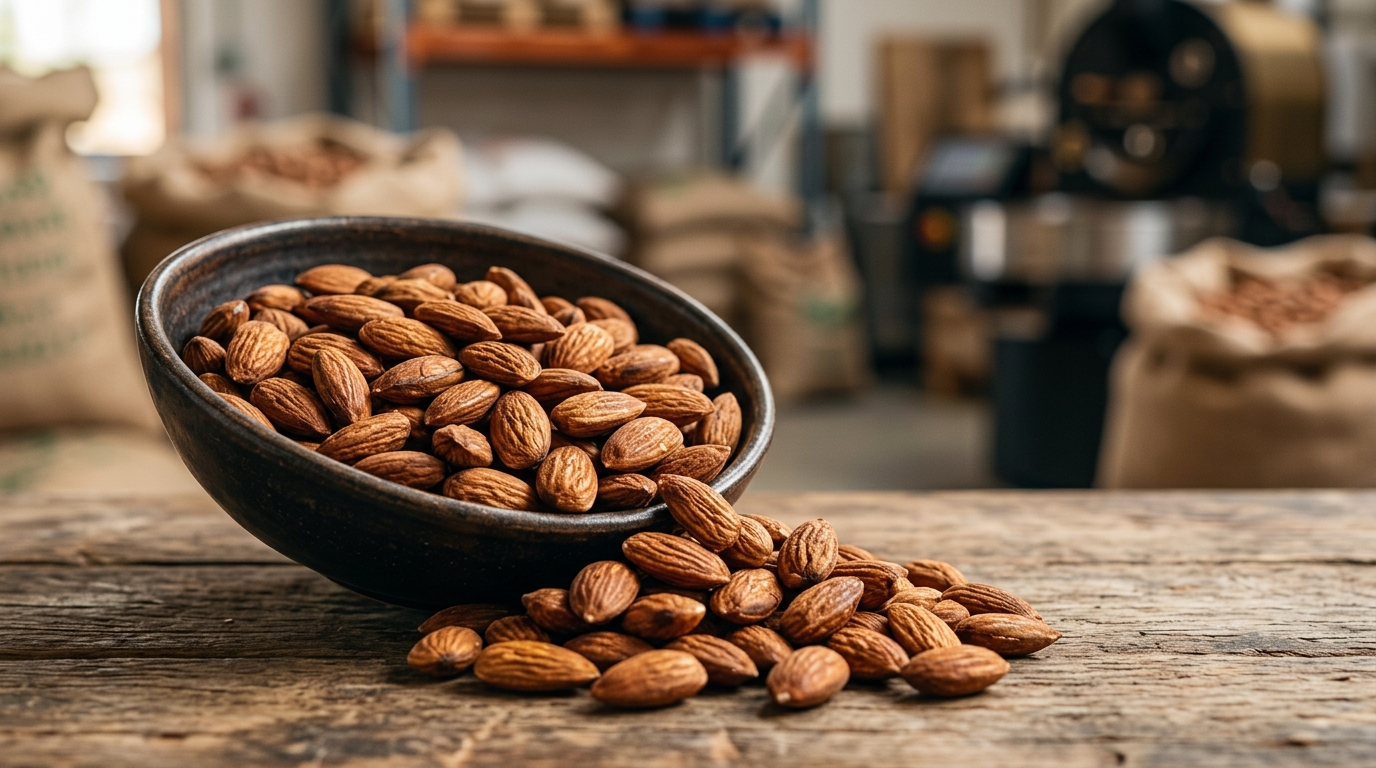
Roasted almonds are often treated like a simple “buy-and-forget” ingredient. In practice, procurement outcomes (cost, continuity, and quality stability) are driven by a small set of structural realities: California-origin concentration, crop-year carryover dynamics, and the fact that “roasted” is a process outcome that can create (or destroy) value downstream through yield, shelf-life, and service performance.
Roasted almonds look like a simple ingredient, but procurement outcomes are determined by two upstream realities:

Key reality for procurement managers: changing a “supplier” often changes only the packer/brand owner, not the upstream kernel dependency. Tier mapping is the difference between true diversification and false comfort.
Key insight: For roasted almonds, the raw kernel is usually the largest cost component, but the highest avoidable losses (scrap, rework, claims, expedite freight) are typically created downstream by roast control, packaging, and logistics decisions.
Structural fact (U.S.): A mandatory treatment program for almonds (aiming at a minimum 4‑log Salmonella reduction) was implemented under USDA marketing order rules and became effective in 2007. [2]
What to validate (technical reality): Roasting and cutting increase oxidation susceptibility; peroxide value testing is a common way to monitor oxidation/rancidity risk, and the Almond Board highlights that processing can increase susceptibility to oxidation. [5]

| Supply Chain Node | Cost Ratio | What moves it most |
|---|---|---|
| Raw material (kernels) | 55% | Kernel market + grade/size |
| Primary processing + treatment | 10% | Yield loss, sorting intensity, treatment validation |
| Secondary processing (roast) | 12% | Energy, OEE, roast loss |
| Packaging & QA | 8% | Barrier film, QA testing, foreign material controls |
| Logistics & distribution | 8% | Freight + warehousing |
| Supplier/Channel margin | 7% | Service level, payment terms |
| Supply Chain Node | Cost Ratio | What moves it most |
|---|---|---|
| Raw material (kernels) | 45% | Kernel market + grade/size |
| Primary processing + treatment | 8% | Yield + compliance |
| Secondary processing (roast + oil + seasoning) | 18% | Oil/flavor inputs, scrap, allergen controls |
| Packaging & QA | 12% | Retail packaging, label complexity, QA overhead |
| Logistics & distribution | 7% | Case config, returns, temperature exposure |
| Supplier/Channel margin | 10% | Retail program requirements |
| Supply Chain Node | Cost Ratio | What moves it most |
|---|---|---|
| Raw material (kernels) | 50% | Starting grade + piece size yield |
| Primary processing + treatment | 9% | Defect removal, breakage control |
| Secondary processing (roast + cutting) | 16% | Cutting yield, fines, dust management |
| Packaging & QA | 9% | Sifting specs, foreign material controls |
| Logistics & distribution | 8% | Freight + warehousing |
| Supplier/Channel margin | 8% | Service + consistency requirements |
Structural fact: The almond industry is organized around a crop‑year and carryover logic. Buyers often experience “tightness” not when the crop is small, but when carryover is low relative to shipment pace.
Crop-year definition (important for governance): The Almond Board position reports follow a crop year from August 1 to July 31. [3]
Example of the type of data procurement should track (industry reporting): the Almond Board’s crop‑year supply/demand accounting shows total salable supply, shipments, and carryover; for crop year 2024/25 it reports total shipments 2,646.5 million lbs and salable carryover 483.8 million lbs. [4]
Why it matters: If you only watch your suppliers’ quotes, you miss the structural indicators that predict when suppliers will:
Procurement teams often assume roasted‑almond pricing should track kernel pricing closely. In practice, the linkage is delayed and distorted by:
Procurement translation: “Kernel down” does not automatically equal “roasted down” unless you can see the supplier’s coverage position (inventory), yield, and conversion constraints.
Start from the buyer decision and map intelligence to action.
What changes: you build a tier‑aware supplier set.
What changes: you negotiate around cost drivers you can evidence.
What changes: you move from reactive to triggered playbooks.
The same procurement logic repeats across other food categories where upstream concentration + processing + shelf‑life create hidden risks:
Generalizable lesson: teams win when they can distinguish:
Roasted almonds are an unusually clean example because they combine:
For procurement leadership, this category makes it easy to operationalize intelligence into governance:

Make Faster, Data-Driven Sourcing Decisions
The insights in this report are just the starting point. Tridge Eye is the data intelligence solution that gives procurement and sourcing leaders real-time market signals, price benchmarks, and supply risk alerts — so you can act before the market moves.


