INDUSTRY TRENDS

Rice Sourcing Intelligence for Inventory & Warehouse Buyers: Prevent Stockouts Without Overbuying

Author
Team Tridge
DATE
March 13, 2026
9 min read
Rice Cover
Tridge Eye Data Intelligence Solution

This report is powered by Tridge Eye Data Intelligence.

Every data point, price signal, and supply risk insight in this analysis comes from the same platform that procurement and sourcing leaders worldwide rely on daily. As you read, consider what this level of market intelligence could do for your sourcing decisions.

Explore Tridge Eye →

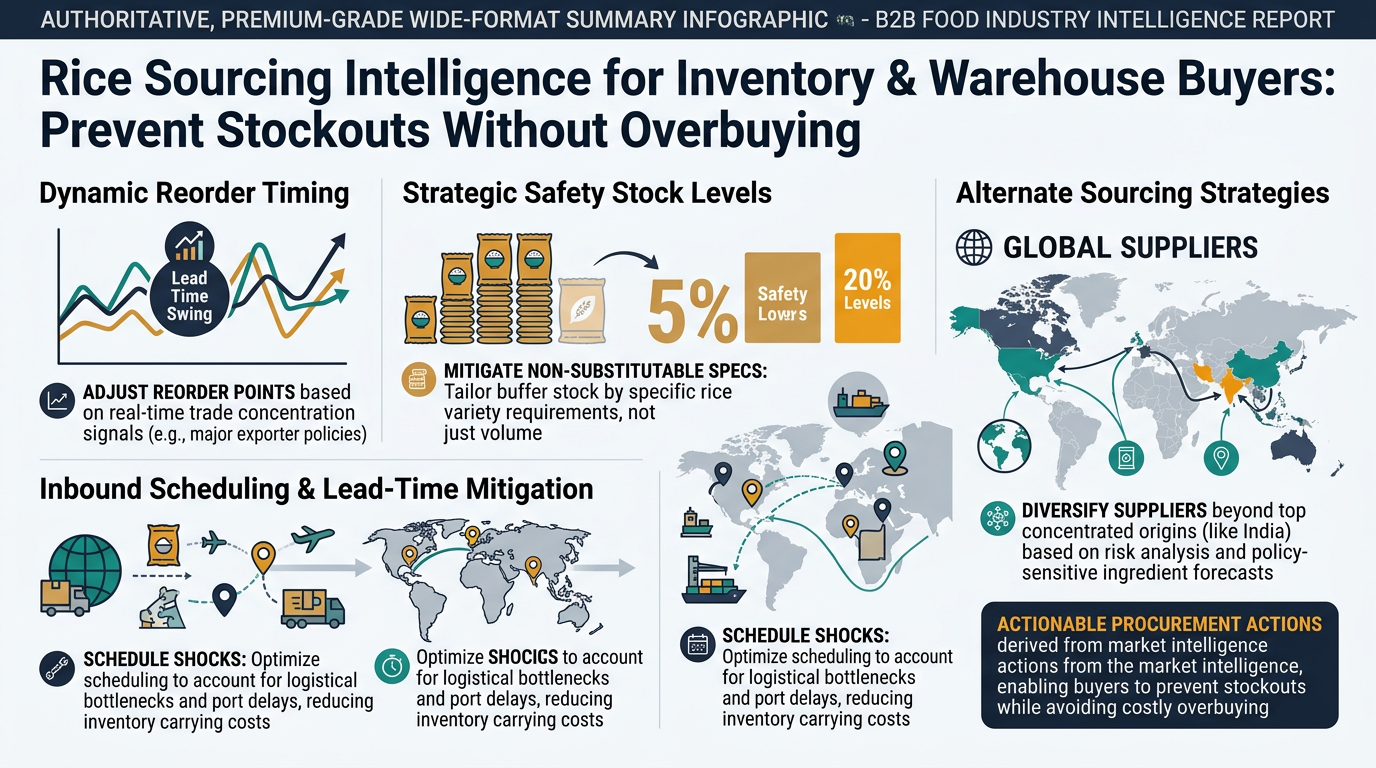
Rice is often treated like a “simple staple,” but for inventory and warehouse-led buyers it behaves like a policy- and logistics-sensitive ingredient: lead times swing, specs are not always substitutable, and landed cost can move for reasons that don’t show up in the commodity headline.

This guide translates rice supply-chain realities into actions Purchase roles can actually take—reorder timing, safety stock, inbound scheduling, and alternate sourcing—while being clear about what market intelligence can and cannot infer.

Executive Summary

  • Trade concentration is real: India plus a small set of exporters (Thailand, Vietnam, Pakistan, U.S., China, Burma/Myanmar, Cambodia) account for ~90% of global rice exports, so a single-origin disruption can reprice availability quickly. [1]
  • Lead time ≠ transit time: For rice, the “true” lead time includes mill scheduling, container booking, port dwell, customs/inspection, and QA hold/release—which is where warehouse plans break.
  • Quality is an inventory variable: Safe storage moisture is commonly cited at <14% for rough rice / grain storage; moisture and pest control failures show up downstream as rejects, shrink, and service failures. [2]
  • Policy can reprice overnight: India issued a notification banning exports of non-basmati white rice on July 20, 2023, illustrating how quickly “normal” lead time and availability assumptions can become invalid. [3]
  • Milling yield economics matter: Milling recovery and head rice recovery vary materially by system and paddy condition; tighter broken% specs effectively raise cost because mills must sort out more product. [4]
  • Best operational KPI set: stockout days, expedite spend, OTIF, lead-time standard deviation, QA hold days, and landed-cost variance (not just unit price).
Stacked bar chart with annotated timeline showing the components of true lead time for imported rice (mill scheduling, container booking, origin port dwell, ocean transit, destination port dwell, customs/inspection, drayage to DC, QA sampling/testing, QA hold/release) across typical, congested port, and policy shock allocation scenarios, with variance bands and callouts highlighting uncertainty in port dwell, booking, and QA hold.

Key Insights

Analyzed at: Mar, 2026

Rice Infographic
  • Strategy: Hold
  • Reliability: Medium
  • Potential Saving: 3% ~ 8%
  • Insight: Treat 2026 rice buying as a lead-time and allocation management problem first, not just a unit-price problem. Given trade concentration and recurring policy sensitivity, prioritize (1) dual-sourcing by corridor for your highest-volume long-grain SKUs, (2) pre-approved alternates for aromatics (where substitution is hardest), and (3) dynamic safety stock triggers tied to origin policy signals and port/corridor dwell risk. The savings typically come from fewer expedites/demurrage and fewer stockout-driven spot buys—not from “calling the bottom” on price. The concentration point (top exporters ~90% of trade) and recent policy shock precedent support the risk posture, but the exact “buy vs hold” timing should be calibrated to your current cover, warehouse capacity, and supplier allocation signals. [1]

1) What’s Actually Happening in the Rice Supply Chain (Ground Truth for Warehouse Teams)

Rice looks like a “simple staple,” but the supply chain behaves more like a policy- and logistics-sensitive manufactured ingredient than a stable grain.

Ground truth that matters for inventory & warehouse control:

  • Global export supply is concentrated. A small set of exporters (India, Thailand, Vietnam, Pakistan, U.S., plus others including China, Burma/Myanmar, Cambodia) accounts for ~90% of global rice exports, meaning disruptions in one country can reprice/reshuffle global availability quickly. [1]
  • “Rice” is not one market. Long-grain, jasmine, basmati, parboiled, organic, fortified blends, and broken rice each have different substitution limits (label/spec/customer acceptance) and different supply seasonality.
  • The physical chain is yield-sensitive. Small changes in moisture handling, storage pests, or milling efficiency can swing usable output and deliverable grades.
  • Lead time is not just transit time. It includes: mill scheduling, container booking, port dwell, inland drayage, customs/inspection, and QA hold time at destination.

A practical supply-chain flow (where costs and risks accumulate):

  1. Upstream / Raw Material: paddy (rough rice) production + harvest + drying start
  2. Primary Processing: drying, cleaning, storage of paddy; dehusking to brown rice
  3. Secondary Processing / Manufacturing: milling/polishing & grading; optional parboiling; fortification blending
  4. Packaging & QA: bagging (25–50kg) vs retail packs; testing; lot release
  5. Logistics & Distribution: inland to port, container freight, destination drayage/warehousing
  6. End Markets: retail, foodservice, industrial/B2B

2) Where Cost and Margin Build Up (And Why It’s Not Just the Commodity Price)

2.1 Upstream / Raw Material (Paddy Production & Harvest)

Key insight: In rice, farmgate paddy price is the anchor, but usable supply depends heavily on post-harvest handling speed (drying) and weather/policy shocks.

Cost drivers

  • Seed/varietal premium (especially aromatic types)
  • Fertilizer + irrigation energy/water availability
  • Harvest labor/mechanization
  • Yield risk from drought/flood/heat events

Margin reality

  • Farmers are price takers in many systems; policy (minimum support prices, public procurement) can set floors.

2.2 Primary Processing (Drying, Cleaning, Storage of Paddy)

Key insight: Drying and storage are where quality loss becomes “hidden cost.” If moisture is not controlled, the warehouse later pays via rejects, downgrades, and infestation risk.

Quality constraint that becomes an inventory constraint

  • Rough rice must be dried to safe storage moisture; FAO references below 14% moisture as a common safe-storage threshold, otherwise quality deteriorates and pest/microbial damage increases. [2]
  • IRRI also notes grain stored above 14% moisture is more prone to mold and quality loss (and provides safe moisture guidance by storage duration). [5]

Cost drivers

  • Drying fuel/energy; drying capacity bottlenecks at peak harvest
  • Storage losses (insects, mold, breakage risk later)
  • Working capital tied up while paddy is conditioned

2.3 Secondary Processing / Manufacturing (Milling, Grading, Parboiling, Fortification)

Key insight: Milling economics are yield economics. Your delivered spec (broken %, chalkiness, foreign matter, moisture) is not free—mills “pay” for it in sorting losses and lower outturn.

Typical yield reality

  • IRRI provides typical ranges for milling recovery and head rice recovery by milling system, showing meaningful variability based on equipment and paddy condition. [4]
  • FAO literature and IRRI-linked references commonly cite wide ranges for head rice recovery in practice (often roughly 25% to 65% depending on conditions and milling). Use this as a risk range for scenario planning, not as a contract spec. [6]

Parboiled rice

  • Adds processing steps (soak/steam/dry), typically improving grain integrity and changing cooking characteristics; it also adds energy/water handling complexity and can shift which origins/suppliers are viable. [7]

Cost drivers

  • Energy + labor + wear parts
  • Sorting/grading losses to meet broken% and cleanliness specs
  • Fortification inputs and blending controls (where required)

2.4 Packaging & QA (Where Warehouse Flow Can Get Stuck)

Key insight: Packaging format decisions create MOQ and handling constraints that directly affect reorder points and dock scheduling.

  • Bulk (25–50kg) often easier for B2B handling but can amplify infestation risk if storage discipline is weak.
  • Retail packs introduce packaging lead time, film/label availability risk, and more QA/traceability steps.
  • QA hold time (sampling, lab tests, COA validation) can add days to “available-to-pick,” even when the container is physically on site.

2.5 Logistics & Distribution (The Landed-Cost Swing Factor)

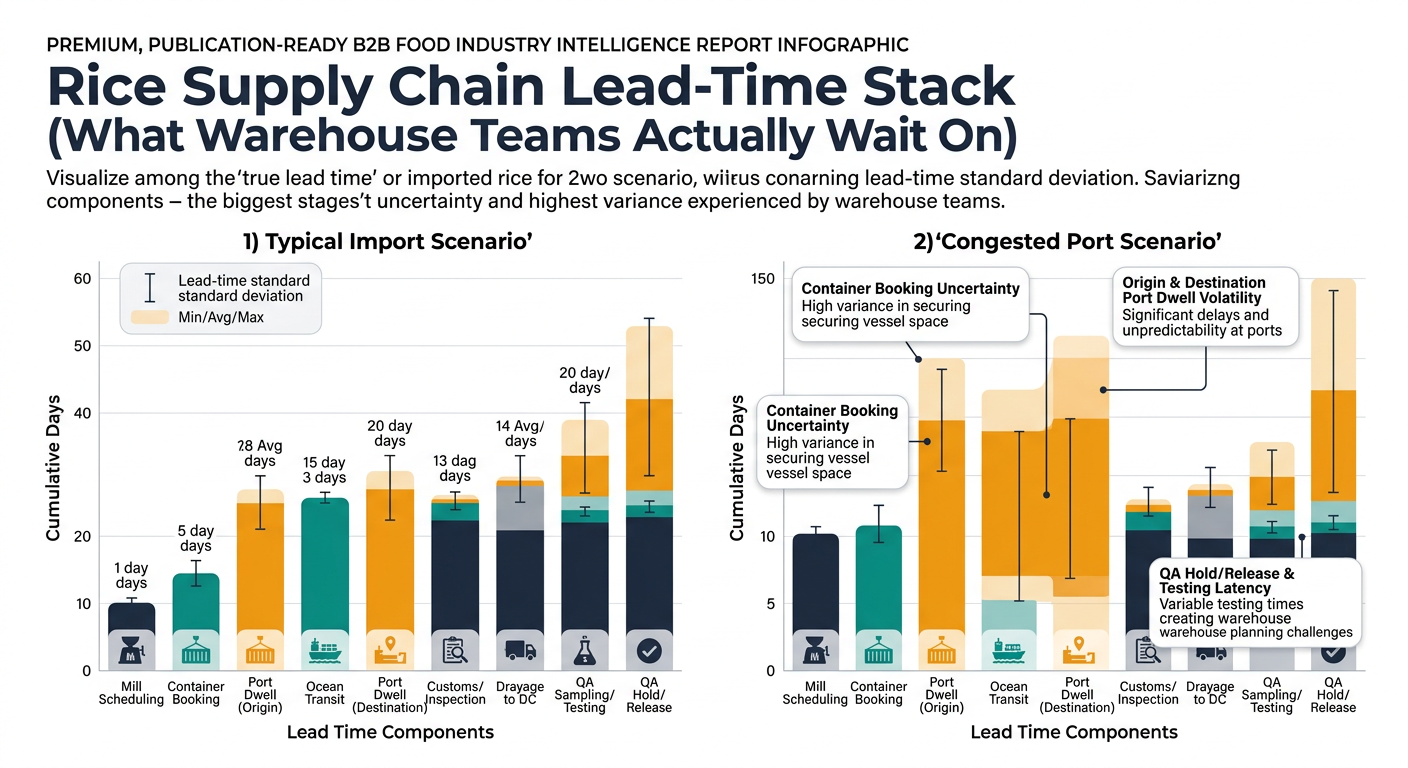
Key insight: Rice is frequently containerized; when container markets tighten, freight becomes a first-order cost driver and a lead-time variance driver.

  • Practical implication for inventory teams: even if the commodity component is stable, port dwell + drayage variability can create inbound bunching (dock congestion, demurrage exposure, labor overtime).

2.6 End Markets (Where Spec Rigidity Becomes a Supply Risk)

Key insight: The tighter the end-customer spec (aroma, varietal purity, broken%, cooking performance), the fewer true alternates you have—so your inventory buffer requirement increases unless you dual-source.

Product-Level Cost Breakdown (Illustrative, Modeled % of Final Delivered Cost)

These are illustrative ratios to show where costs tend to concentrate. Actual splits vary by origin, crop year, contract terms, packaging, and freight.

Grouped stacked bar chart comparing illustrative landed-cost breakdown by rice type (commodity long-grain, parboiled, premium aromatic jasmine/basmati), segmented into upstream paddy, primary processing, secondary processing, packaging & QA, logistics & distribution, and trading/wholesale margin, with annotations highlighting higher secondary processing share for parboiled, higher upstream and packaging/QA for aromatics, and logistics as a major swing factor.

A) Commodity Long-Grain White Rice (bulk bags, containerized)

Supply Chain Node Cost Ratio (% of Final Cost) What moves it most Warehouse implication
Upstream (paddy) 45% farmgate + policy floors price shifts can be fast in tight markets
Primary processing (dry/store) 7% drying energy, loss rates poor handling shows up later as rejects
Secondary processing (milling/grading) 12% outturn, broken% spec tighter spec = higher effective cost
Packaging & QA 6% bag/label, QA holds longer “available” lead time
Logistics & distribution 18% ocean + port + inland biggest landed-cost swing factor
Trading/wholesale margin 12% allocation power, financing allocation risk in tight supply

B) Parboiled Rice (bulk bags)

Supply Chain Node Cost Ratio (% of Final Cost) What moves it most Warehouse implication
Upstream (paddy) 40% paddy price similar exposure as white rice
Primary processing (dry/store) 7% drying capacity peak-season bottlenecks
Secondary processing (parboil + mill) 18% steam/energy, drying time longer production lead time
Packaging & QA 6% bag/COA QA holds still apply
Logistics & distribution 17% freight/port same corridor risks
Trading/wholesale margin 12% allocation supply can tighten if parboil capacity is constrained

C) Premium Aromatic (Jasmine/Basmati) (often higher QA + stricter spec)

Supply Chain Node Cost Ratio (% of Final Cost) What moves it most Warehouse implication
Upstream (varietal paddy) 50% crop quality + varietal purity fewer acceptable substitutes
Primary processing (dry/store) 6% quality preservation higher downgrade risk
Secondary processing (milling/grading) 12% head rice recovery tighter broken% drives cost
Packaging & QA 8% testing, traceability longer release time likely
Logistics & distribution 14% freight still meaningful but less dominant
Trading/wholesale margin 10% brand/grade premiums allocation risk higher in short crop

3) The Structural Fact You Must Plan Around: Rice Trade Can Reprice Overnight

Structural fact: A meaningful share of globally traded rice is exposed to government export actions, and when a major exporter changes rules, the effect is immediate for importers.

  • Example: India implemented a ban on non-basmati white rice exports on July 20, 2023 (with subsequent adjustments and exceptions across time and product types). [3]

Why this matters for inventory teams:

  • Your “normal” lead time distribution can become invalid in a single week.
  • Supplier allocation behavior changes before your ERP parameters do.

4) The Critical Insight: Why Paddy/Export Prices Don’t Translate Cleanly to Your Landed Cost

Inventory buyers often expect: export benchmark down ⇒ my delivered cost down. In rice, the pass-through is frequently broken by four disconnects:

  1. Milling yield & grade economics: If head rice recovery drops (weather, drying delays), mills need higher prices even if paddy is flat. [4]
  2. Spec tightening: A 2–3% tighter broken% or foreign matter spec can force more sorting loss, raising the effective cost.
  3. Freight/port variability: Port dwell and inland variability can dominate short-term landed cost variance.
  4. Policy and allocation: Export rules and domestic procurement can redirect supply away from export channels, creating “paper availability” but no deliverable slots.

5) Where Procurement + Inventory Teams Commonly Misstep (And the Warehouse Pays)

Mistake 1: Setting reorder points off average lead time

  • Rice lead time variance is often driven by non-transit factors (mill scheduling, container booking, QA release).

Mistake 2: Treating “alternate supplier” as “alternate spec”

  • Aromatic and premium grades are not plug-and-play; substitution can require label changes, customer approval, or new QA validation.

Mistake 3: Negotiating only unit price, not landed-cost volatility

  • Freight, demurrage exposure, and port corridor reliability can outweigh a small unit-price win.

Mistake 4: Ignoring storage/quality as a sourcing variable

  • Safe moisture handling is not academic; moisture and pest risk create real shrink and service failures; FAO and IRRI commonly cite 14% moisture as a key safe-storage threshold reference point. [2]

6) How Intelligence-Driven Buying Changes the Outcome (Without Promising Perfect Forecasts)

The goal is not “predict prices.” It’s to make replenishment and buffering decisions that survive volatility.

Decision 1: When to buy (pull-forward vs stagger)

  • Use price intelligence to separate:
  • commodity move vs freight move vs policy-driven scarcity
  • Translate into actions:
  • Pull-forward only when you have space + shelf-life + QA capacity
  • Otherwise stagger POs and widen supplier mix to reduce allocation risk

Decision 2: How much safety stock is justified

  • Use risk monitoring to adjust safety stock dynamically when:
  • a key export origin tightens policy
  • a port corridor shows rising dwell/blank sailings
  • harvest quality risk increases (head rice recovery risk)

Decision 3: Who can be a real alternate (not a theoretical one)

  • Use supplier discovery & benchmarking to pre-qualify alternates by:
  • spec capability (broken%, moisture, varietal)
  • packaging format and MOQs
  • certifications and traceability fit
  • Be explicit about limits: this does not replace audits, QA trials, or contract negotiation.

Decision 4: Governance and post-mortems

  • Use procurement performance analysis to connect:
  • supplier OTIF + lead-time variability
  • price variance vs market context
  • warehouse impacts (dock congestion incidents, demurrage, expedites)

Measurable outcomes inventory teams can track:

  • Stockout days (by SKU family)
  • Expedite spend and premium freight incidents
  • OTIF and lead-time standard deviation
  • Landed-cost variance vs budget (not just unit price)
  • QA hold-time days and rejection/downgrade rates

7) Strategic Use Cases (Practical Plays for Purchase Roles Owning Inventory & Warehousing)

  1. Disruption trigger ladder (port + origin)
  2. Trigger levels (watch / warn / act) tied to corridor signals
  3. Pre-approved actions: raise safety stock, shift split, book earlier vessel windows
  4. Dual-source design by rice type (not one-size-fits-all)
  5. Commodity long-grain: diversify by corridor + packaging capability
  6. Aromatic: diversify by approved varietal/origin equivalence and customer acceptance lead time
  7. Spec-to-inventory policy mapping
  8. Tight spec SKUs: higher safety stock or more suppliers
  9. Flexible spec SKUs: lower safety stock, more spot buying allowed
  10. Landed-cost decomposition for negotiation
  11. Separate what’s market-wide (freight, policy) from supplier-specific margin expansion
  12. Inbound smoothing for warehouse stability
  13. Use expected arrival variance to proactively reserve dock slots and labor
  14. Reduce “all containers arrive at once” congestion cycles

8) Why This Matters Beyond Rice (Same Intelligence Logic, Other Categories You Likely Buy)

The same decision discipline applies wherever policy, yield, and logistics variance dominate outcomes:

  • Edible oils (palm/soy/sunflower): export taxes/bans and crush margins can disconnect futures from delivered prices.
  • Coffee: origin concentration + quality differentials; “same origin” does not mean “same cup profile,” similar to aromatic rice substitution limits.
  • Cocoa: structural supply deficits and price spikes force inventory buffers and alternate formulation decisions.
  • Wheat flour: milling yield, protein specs, and freight corridors create spec-driven cost disconnects similar to rice milling outturn.

In each case, intelligence is most valuable when it changes reorder timing, buffers, and supplier mix—not when it just describes the market.

9) Why This Example Converts Skeptics: Rice Makes the Value of Better Decisions Obvious

Rice is a strong “proof category” because:

  • Export concentration + policy sensitivity create real, repeatable shock events (top exporters ~90% of trade). [1]
  • Quality/yield mechanics (milling recovery, head rice) make specs financially meaningful, not cosmetic. [4]
  • Trade is concentrated even though global production is broad, which is why a small number of exporter policy decisions can matter disproportionately for importers. [8]

For Purchase roles managing inventory and warehouse stability, the win is straightforward to validate: fewer stockouts and expedites, smoother inbound flow, and more defensible buffer decisions—without pretending anyone can perfectly forecast the next shock.

Tridge Eye Data Intelligence Solution

Make Faster, Data-Driven Sourcing Decisions

The insights in this report are just the starting point. Tridge Eye is the data intelligence solution that gives procurement and sourcing leaders real-time market signals, price benchmarks, and supply risk alerts — so you can act before the market moves.

Explore Tridge Eye →

References

  1. ers.usda.gov
  2. fao.org
  3. fas.usda.gov
  4. knowledgebank.irri.org
  5. knowledgebank.irri.org
  6. fao.org
  7. fao.org
  8. usitc.gov
Subscribe
By subscribing you agree to with our Privacy Policy and provide consent to receive updates from our company.
Thank you! Your submission has been received!
Oops! Something went wrong while submitting the form.
Subscribe to receive the latest blog posts, updates, promotions, and announcements from Tridge.