INDUSTRY TRENDS

Raw Walnut Sourcing Guide (2026): Where Cost, Quality, and Risk Actually Accumulate—And How Procurement Can Control Them

Author
Team Tridge
DATE
March 30, 2026
9 min read
raw-walnuts Cover
Tridge Eye Data Intelligence Solution

This report is powered by Tridge Eye Data Intelligence.

Every data point, price signal, and supply risk insight in this analysis comes from the same platform that procurement and sourcing leaders worldwide rely on daily. As you read, consider what this level of market intelligence could do for your sourcing decisions.

Explore Tridge Eye →

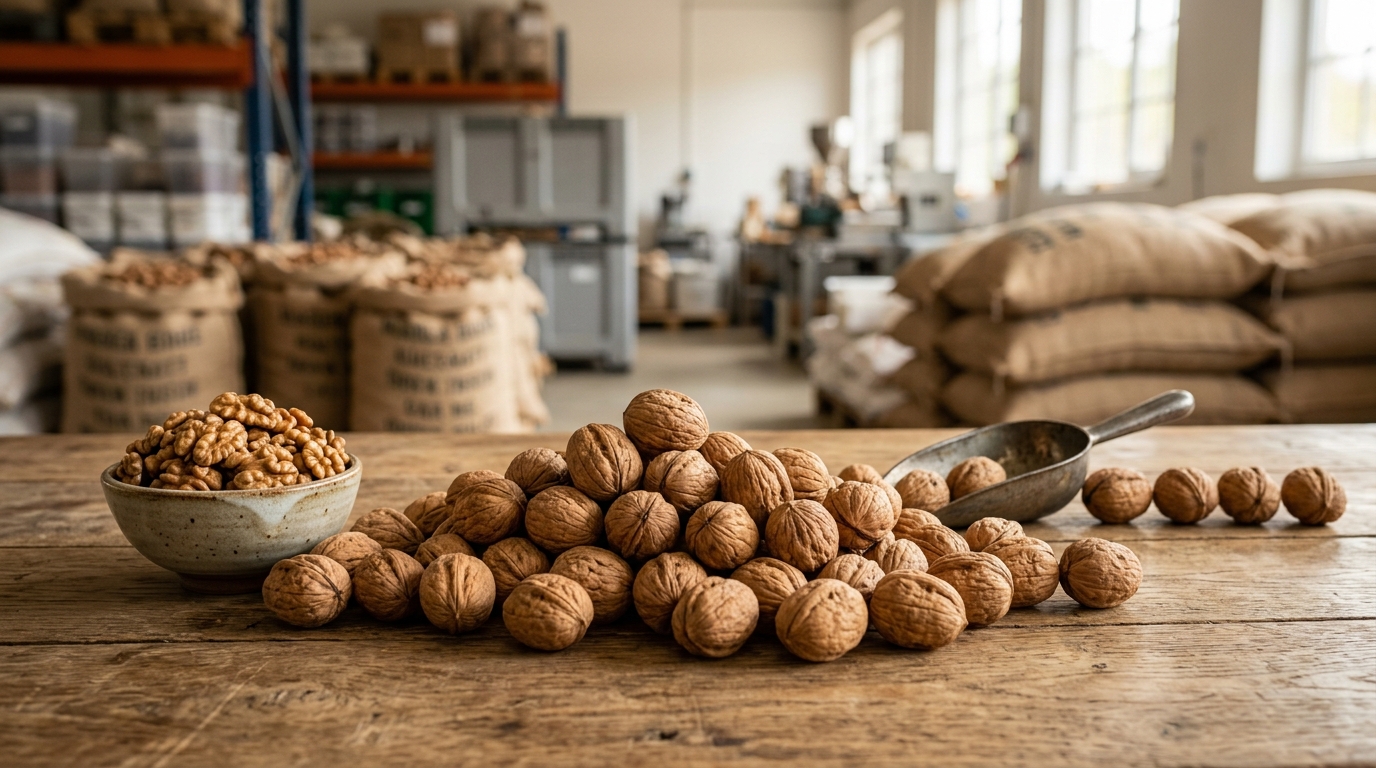
Raw walnuts can look like a straightforward commodity buy, but most procurement “surprises” (claims, yield loss, late shipments, sudden price gaps between in-shell and kernels) come from a few structural realities: seasonality, spec-driven value segmentation, and how post-harvest handling and logistics protect (or degrade) quality. This guide translates the walnut supply chain into procurement language—so you can set negotiation guardrails, build a defensible supplier panel, and reduce total cost variance without overreacting to headlines.

Executive Summary

  • Walnuts are spec-sensitive, not purely commodity: Your grade/color/defect tolerances are an economic position (they determine cracking yield, usable yield, and rework/claims exposure).
  • Harvest timing is a real planning constraint: California harvest is typically mid-September to early November; many buyers see “decision windows” around Northern Hemisphere harvest and counter-season supply (e.g., Chile).
  • Kernel vs in-shell prices can decouple structurally: Kernel quotes embed a “yield bet” (halves yield, color distribution, defect load), plus inventory carry and channel switching.
  • Most controllable TCO levers sit downstream of the farm: packaging spec, QA release discipline, foreign material controls, temperature/heat exposure management, and claims mechanics.
  • Governance matters: A documented supplier scorecard + risk triggers typically improves auditability and reduces last-minute spot buys.

Key Insights

(Analyzed at: Mar, 2026)

  • Strategy: Hold
  • Reliability: Medium
  • Potential Saving: 4% ~ 10%
  • Insight: Treat the next contracting cycle as a risk-controlled hold rather than an aggressive “chase the lowest bid” moment: lock in continuity for your core spec with clear quality/yield protections (COA fields, inspection/claims mechanics, temperature handling), while using competitive tension on the controllable cost components (pack format, QA/testing cadence, freight/Incoterms). The most repeatable savings in walnuts usually come from reducing hidden TCO (claims, rework, expedites) and tightening supplier performance governance—not from trying to time the absolute market low.

1) What You’re Actually Buying: The Real Raw-Walnut Supply Chain (Ground Truth)

Raw walnuts look simple (a nut in a shell), but procurement outcomes are driven by where you are in the chain (in-shell vs kernels) and how quality is protected from harvest through shipment.

A procurement-oriented flow diagram showing the end-to-end walnut pathway with two branches (in-shell program vs shelled kernels), highlighting stages from orchard production through drying, grading, packaging, export logistics, and destination handling, with callouts for key risk and cost points like moisture stabilization, grading/channel split, shelling yield, packaging barrier/vacuum/MAP oxidation risk, and heat exposure/dwell time in logistics.

The practical flow (what moves, who adds value)

  1. Orchard production (multi-year asset)
  2. Trees are long-lived assets; annual output swings with weather and agronomy.
  3. What matters to you: yield + kernel quality (color, size, defect rate).
  4. Hulling / washing / drying (post-harvest stabilization)
  5. This is where moisture is driven down to safe storage levels.
  6. Bottlenecks here can turn into mold/rancidity risk later.
  7. Grading & channel split (in-shell vs shelling stream)
  8. Better lots may go to in-shell programs; others to shelling.
  9. Your “raw walnut” may be:
  10. In-shell (often holiday-driven demand), or
  11. Shelled kernels (industrial/retail ingredient demand).
  12. Shelling / sorting / food safety steps (kernel manufacturing)
  13. Value is created (and lost) here through:
  14. halves yield vs breakage into pieces
  15. optical/hand sorting for defects and foreign material
  16. lethality treatment (where required by customers/markets)
  17. Packaging & QA release
  18. Kernels are oxidation-sensitive; packaging choices (vacuum/MAP liners) affect shelf-life and claims.
  19. QA release typically anchors: moisture, color, defects, foreign material, sometimes chemical freshness indicators.
  20. Export logistics & destination handling
  21. Ocean freight dominates; kernels are more sensitive to heat exposure and long dwell times.

Seasonality: why the calendar matters

  • California (U.S.) harvest is typically mid-September through early November (Northern Hemisphere cycle).
  • Chile’s walnut export season typically runs from mid-April into August (in-shell), and roughly May into August (shelled), reflecting harvest and processing timing.

For procurement, this creates two contracting/availability “decision windows” each year (Northern + Southern Hemisphere), plus inventory carry dynamics.

2) Where the Money Goes: Cost & Margin Build-Up by Supply Chain Node

Key insight: In walnuts, “price” is often a proxy for (a) expected cracking yield and color outcome, (b) inventory carry, and (c) logistics risk—not just farm supply.

Below is a procurement-friendly breakdown of what typically drives cost and margin at each node.

2.1 Orchard production (raw material economics)

  • What makes it expensive/volatile
  • Weather-driven yield swings (heat/rain timing affects both volume and kernel quality).
  • Water and orchard operating costs (irrigation, inputs, labor/mechanization).
  • Procurement implication
  • Farm-level shocks often show up first in in-shell pricing and later in kernel pricing (lag).

2.2 Hulling, washing, drying (stabilization economics)

  • What adds cost
  • Energy for drying + capacity constraints during peak harvest.
  • Shrink/moisture loss and defect removal.
  • Procurement implication
  • This is a major driver of quality drift risk (mold/rancidity complaints later), which becomes TCO.

2.3 Grading & lot formation (value segmentation)

  • What adds margin
  • Sorting by size/variety and early quality selection.
  • Channel decisions (in-shell vs shelling) based on market premiums.
  • Procurement implication
  • Two suppliers quoting “light halves & pieces” may be sourcing from very different upstream grade pools.

2.4 Shelling + sorting + food safety steps (kernel manufacturing)

  • What adds the most value (and hidden cost)
  • Halves yield is the economics engine: breakage turns premium product into discounted pieces.
  • Optical sorting/hand rework and foreign material controls.
  • Customer-required lethality steps (where applicable) add cost and constrain eligible supply.
  • Procurement implication
  • Kernel quotes embed a “yield bet.” If your supplier’s in-shell input quality shifts, your delivered kernel economics can change without an obvious market headline.

2.5 Packaging & QA release

  • What adds cost
  • Barrier liners, vacuum/MAP, carton specs, labeling.
  • Testing and inspection release.
  • Procurement implication
  • Packaging choices can reduce oxidation risk (claims, rework) but increase unit cost—classic TCO trade.

2.6 Logistics, duties, working capital

  • What adds cost
  • Ocean freight, insurance, demurrage, inland drayage.
  • Inventory carry (walnuts are stored and sold over many months).
  • Procurement implication
  • Long transit + heat exposure can be a bigger driver of complaints than the farm itself.
A 3-bar 100% stacked chart comparing modeled delivered cost composition for in-shell walnuts, shelled kernels (Light Halves & Pieces blend), and industrial walnut pieces, with labeled percentage segments for orchard raw material, hulling/drying/grading, shelling/sorting/food safety (0% for in-shell), packaging & QA, logistics & distribution, and exporter/importer or processor/exporter margin, plus a legend and a footnote noting ratios are illustrative and vary by origin, pack style, and contract terms.

Product-level cost breakdown (illustrative)

Modeled % of final delivered cost to your receiving dock. Actual ratios vary by origin, pack style, contract terms, and market tightness. Use this to see where negotiation levers realistically sit.

A) In-shell walnuts (export program)

Supply Chain Node Cost Ratio (% of Final Cost) Notes
Orchard raw material 55% Farmgate/in-shell price dominates when supply is tight.
Hulling/drying/grading 12% Drying energy + defect removal + sizing.
Shelling/manufacturing 0% N/A.
Packaging & QA 6% Bags/cartons + inspection/testing.
Logistics & distribution 15% Freight + port performance + insurance.
Exporter/importer margin 12% Program risk + working capital.

B) Shelled kernels – Light Halves & Pieces blend (ingredient grade)

Supply Chain Node Cost Ratio (% of Final Cost) Notes
Orchard raw material (in-shell input) 35% Embedded in-shell cost.
Hulling/drying/grading 8% Stabilization + initial sorting.
Shelling/sorting/food safety steps 25% Yield loss + labor/capex + rework.
Packaging & QA 10% Barrier packaging + testing.
Logistics & distribution 12% Kernels more sensitive to dwell/heat.
Processor/exporter margin 10% Yield risk + inventory carry.

C) Industrial walnut pieces (bakery grade)

Supply Chain Node Cost Ratio (% of Final Cost) Notes
Orchard raw material (in-shell input) 30% Lower value capture than halves.
Hulling/drying/grading 7% Similar steps, lower premium.
Shelling/sorting 22% Still labor-intensive; less strict appearance sorting.
Packaging & QA 8% Often bulk packs; still needs FM controls.
Logistics & distribution 13% Similar freight exposure.
Processor/exporter margin 20% Pieces pricing often reflects market clearing + byproduct economics.

3) The Structural Fact Procurement Needs to Internalize

Raw walnuts are not a single commodity—your “spec” is an economic position.

Two structural realities drive most sourcing surprises:

  1. Quality segmentation is monetized hard
  2. Kernel color and defect tolerances directly change realizable value.
  3. USDA grade language for shelled walnuts explicitly ties grade to kernel color classes (e.g., extra light, light, light amber, amber) and related requirements.
  4. Processing concentration and yield mechanics create “non-linear” pricing
  5. Small changes in breakage, defects, or color can swing a lot from “halves” to “pieces,” moving value disproportionately.

Procurement takeaway: treat walnuts like a category where spec-fit and yield stability are as important as the headline price.

4) The Critical Insight: Why In-Shell and Kernel Prices Can Disconnect

You’ll often see kernels moving differently than in-shell (or moving later). The drivers are structural:

  1. Kernel prices embed a yield/quality expectation
  2. If handlers believe the crop will crack into fewer halves or darker color, kernel prices can rise even if in-shell volume looks adequate.
  3. Inventory carry and timing lag
  4. Kernels are produced and released over time; shellers work through contracted in-shell supply.
  5. That can create a lag between harvest signals and kernel market realization.
  6. Channel switching (in-shell vs shelling)
  7. If in-shell demand spikes (or premiums change), more volume can be pulled away from shelling, tightening kernel availability without a “crop failure” headline.
  8. Logistics and shelf-life risk are priced in
  9. Kernels are more sensitive to heat and oxidation during long transit; risk premiums show up as tighter terms, not always as a clean commodity index move.

5) Where Procurement Teams Commonly Misstep (Even Strong Teams)

These are recurring failure modes when a team is experienced in other categories but newer to walnuts:

  1. Over-indexing on the lowest compliant bid
  2. Walnuts punish “paper compliance” when lot consistency is weak.
  3. Savings get erased through: rework, yield loss, customer complaints, expedited replacements.
  4. Treating “Light Halves & Pieces” as interchangeable across origins/suppliers
  5. Same label, different upstream grade pool, different foreign material controls, different packaging discipline.
  6. Single-sourcing because the incumbent is operationally easy
  7. Works until a quality event or logistics disruption forces spot buying (usually at the worst time).
  8. Negotiating price without negotiating the drivers
  9. Missing levers: packaging spec, inspection regime, defect tolerances, shipment temperature handling, claims mechanics, and substitution rules.
  10. Late risk detection
  11. Teams react when the supplier misses a shipment or QA rejects a lot—when options are already constrained.

6) How Intelligence Changes the Decision (Without Turning It Into “More Data”)

Here’s how an intelligence-driven workflow changes outcomes for a procurement & sourcing manager—using only 3 capability blocks.

Capability 1: Price intelligence + cost-driver attribution

What it changes: your buy-timing and negotiation guardrails.

  • Instead of “supplier says market is up,” you anchor discussions on:
  • harvest timing and early crop/quality signals
  • inventory/stock narrative and channel demand
  • freight/port conditions affecting delivered cost
  • Procurement artifact:Negotiation brief with “walk-away” ranges tied to drivers.

Capability 2: Supplier benchmarking (quality fit + service reliability)

What it changes: award decisions and allocation strategy.

  • Compare suppliers on:
  • spec-fit history (color/defect consistency)
  • packaging/QA maturity
  • lead times, OTIF proxies, export experience
  • Procurement artifact:Supplier scorecard that includes TCO fields (claims, rework, expedites).

Capability 3: Supply chain risk monitoring (actionable triggers)

What it changes: speed and governance of disruption response.

  • Monitor disruption signals that matter in walnuts:
  • weather anomalies during maturation/harvest windows
  • port congestion and dwell-time risk for kernels
  • regulatory or inspection disruptions
  • Procurement artifact:Risk register with triggers (e.g., “if X happens, launch RFI to alternates; if Y happens, shift allocation split”).

Measurable outcomes (typical targets, not guarantees)

  • Lower total cost variance (price + claims + expedites)
  • Fewer emergency substitutions (because alternates are pre-qualified)
  • Better auditability (documented rationale for awards and risk mitigations)

7) Strategic Use Cases (What You Can Operationalize in 30–90 Days)

Use case A: Reduce cost volatility without increasing supply risk

  • Build a buy plan around the two harvest cycles (U.S. + Chile) and inventory carry.
  • Set negotiation guardrails: price bands + freight assumptions + packaging/QA trade-offs.
  • Output:category strategy one-pager + negotiation brief.

Use case B: Pre-qualify backups (before you need them)

  • Create a longlist by origin/capability and narrow to 2–3 alternates.
  • Run a lightweight pre-qual: certifications, QA system, sample protocol, pilot shipment.
  • Output:approved supplier panel with allocation rules.

Use case C: Prevent “false savings” driven by quality drift

  • Track lot-level issues and map them back to supplier process controls.
  • Tighten specs where it matters (FM, color distribution, moisture) and loosen where it doesn’t (to avoid paying for unnecessary premium).
  • Output:spec rationalization + TCO model.

Use case D: Executive-ready governance reporting

  • Standardize: why supplier A gets 60% and supplier B gets 40%.
  • Show: cost movement, risk posture, mitigation actions, and compliance status.
  • Output:quarterly supplier governance pack.

8) Why This Matters Beyond Walnuts (Examples from Adjacent Categories You Likely Buy)

Walnuts are a clean example of a broader procurement truth: the highest-impact decisions happen where quality, yield, and logistics interact—not where the price index is loudest.

Comparable patterns you’ll recognize:

  • Almonds / pistachios (tree nuts): origin concentration + quality segmentation; small defect shifts can change usable yield and customer acceptance.
  • Cocoa: price isn’t the whole story—quality, origin risk, and compliance requirements reshape the true landed cost.
  • Coffee: differentials, defects, and logistics timing can dominate the “C price” impact for specific SKUs.
  • Dairy powders: commodity pricing moves fast, but specs (protein, solubility) and supplier process capability drive line performance and rework.

If you build an intelligence-led workflow for walnuts, you’re essentially building a reusable operating system for spec-sensitive commodities.

9) Why This Is a High-Signal Example for Procurement Leaders

Raw walnuts compress many procurement challenges into one category:

  • Two-hemisphere seasonality that creates discrete decision windows (contract timing matters).
  • Spec-driven economics where yield and color distribution can quietly swing value.
  • Quality and shelf-life exposure where logistics dwell time becomes a cost driver.
  • Governance needs because supplier changes are often triggered by risk events, not planned strategy.

What to monitor next (practical signal list)

  • Harvest timing and quality commentary in key origins (U.S. and Chile)
  • Kernel color distribution / defect trends in supplier COAs and inspection outcomes
  • Freight + port dwell times on your main lanes
  • Claims and rework rates by supplier/lot (turn this into allocation decisions)

Assumptions (so you can calibrate this to your reality)

  • Your buying form is either in-shell or shelled kernels (halves/pieces) for industrial, retail, or ingredient use.
  • Your risk exposure depends heavily on: destination market requirements, packaging spec, and allowable color/defect tolerances.

If you share (1) product form (in-shell vs kernels), (2) target color/grade, (3) annual volume, and (4) destination region, the cost-node table and the “monitor list” can be tightened into a category strategy brief.

Tridge Eye Data Intelligence Solution

Make Faster, Data-Driven Sourcing Decisions

The insights in this report are just the starting point. Tridge Eye is the data intelligence solution that gives procurement and sourcing leaders real-time market signals, price benchmarks, and supply risk alerts — so you can act before the market moves.

Explore Tridge Eye →

Subscribe
By subscribing you agree to with our Privacy Policy and provide consent to receive updates from our company.
Thank you! Your submission has been received!
Oops! Something went wrong while submitting the form.
Subscribe to receive the latest blog posts, updates, promotions, and announcements from Tridge.