INDUSTRY TRENDS

Ranch Dressing Sourcing (2026): Cost Drivers, Continuity Risks, and Contract Structures That Actually Hold

Author
Team Tridge
DATE
April 3, 2026
10 min read
ranch-dressing Cover
Tridge Eye Data Intelligence Solution

This report is powered by Tridge Eye Data Intelligence.

Every data point, price signal, and supply risk insight in this analysis comes from the same platform that procurement and sourcing leaders worldwide rely on daily. As you read, consider what this level of market intelligence could do for your sourcing decisions.

Explore Tridge Eye →

Ranch dressing procurement looks simple until you map what really drives service and COGS: a high-oil emulsion (process-sensitive), built on a handful of volatile inputs (oil, eggs, dairy), and frequently constrained by packaging lead times and co-manufacturing windows. This guide translates those realities into procurement actions you can run this quarter—cost-driver modeling, contract/index design, packaging and co-man contingency governance—without pretending any of this replaces QA/regulatory sign-off.

Executive Summary

  • Cost concentration reality: For most shelf-stable bottled ranch, the biggest controllable cost drivers are typically edible oil + packaging, while egg/dairy + co-man capacity are the most disruption-prone risk drivers.
  • Egg volatility is real (and recent): U.S. retail egg prices hit $4.95/dozen in January 2025 and reached $6.23/dozen in March 2025 (BLS-reported averages cited in major reporting), then eased as supply recovered—proof that egg exposure needs explicit governance, not “absorbed variance.” [1]
  • Corrugate is not “noise”: The Producer Price Index for corrugated shipping containers is tracked by BLS/FRED and moves materially over time—corrugate belongs in your packaging cost-driver model and index discussions. [2]
  • pH is a contracting/gating item, not a lab footnote: U.S. FDA frameworks define acidified foods as finished equilibrium pH ≤ 4.6 (with aw > 0.85), and processors of shelf-stable acidified foods in hermetically sealed containers have specific registration/process filing expectations. [3]
  • 2026 market signal (practical): Egg markets have been off the 2025 highs and wholesale levels have been much lower at points in early 2026—creating a window to reset egg-related surcharges/indexing terms while keeping contingency language for renewed HPAI shocks. [4]

Key Insights

(Analyzed at: Apr, 2026)

  • Strategy: Buy
  • Reliability: Medium
  • Potential Saving: 3% ~ 8%
  • Insight:Use the current egg-price normalization vs. 2025 peaks to renegotiate contract mechanics—not just price. Specifically:
  • remove or tighten “emergency egg surcharges,”
  • convert egg exposure to a documented index/benchmark with clear lag and audit rules, and
  • trade some unit-price concession for stronger packaging/co-man service commitments (reserved windows, OTIF definitions).
  • The savings is typically modest on unit price alone, but the bigger value is fewer mid-cycle disputes and fewer expedite events when volatility returns. Recent market reporting shows egg prices were dramatically elevated in early 2025 and materially lower later, and industry commentary in early 2026 cites low wholesale levels—supporting a renegotiation window, but not eliminating renewed HPAI risk. [5]

1) What you’re actually buying: the ranch-dressing supply chain in plain terms (ground truth)

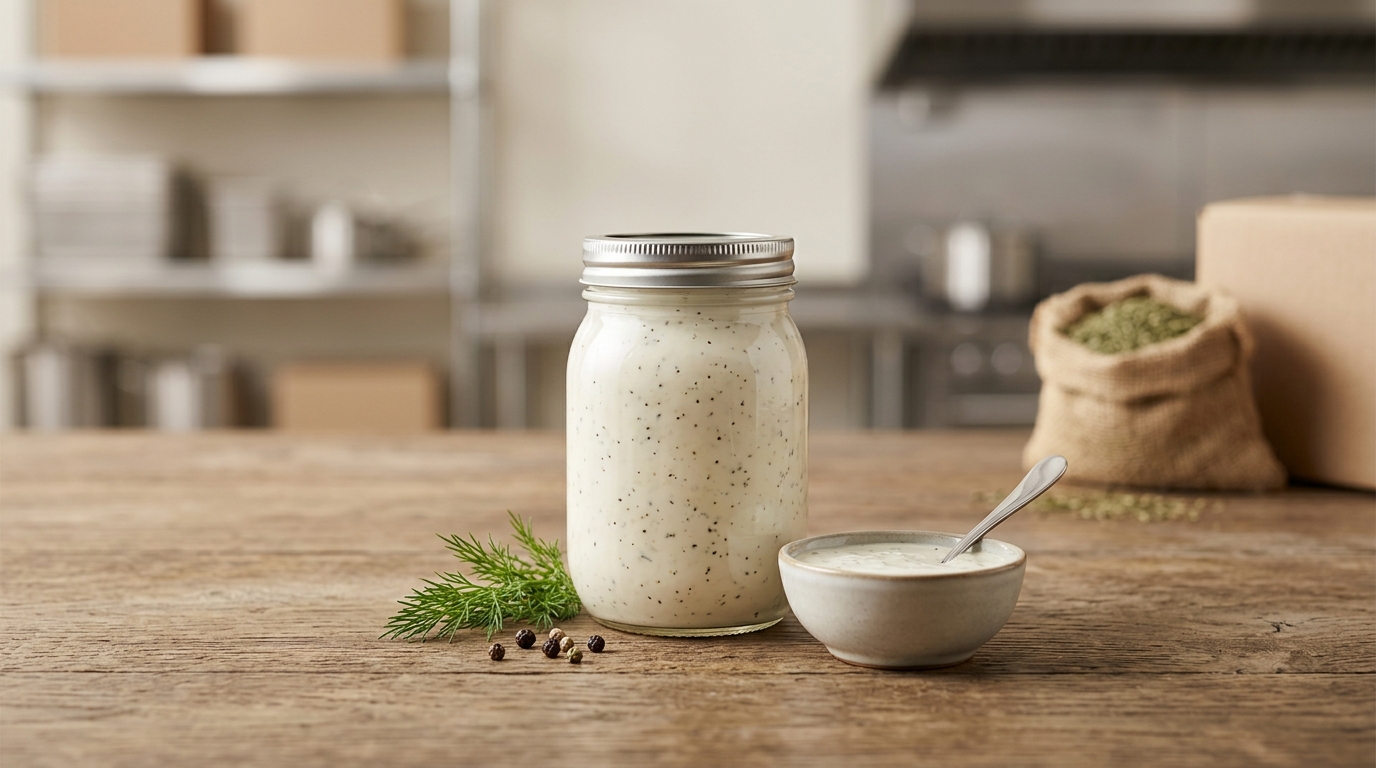
Ranch dressing looks like a simple SKU, but procurement outcomes are driven by how a high-oil emulsion moves through a packaging- and co-man–constrained ecosystem.

The physical flow (what must go right)

  1. Upstream inputs
  2. Edible oils (often soybean and/or canola)
  3. Egg + dairy (egg yolk/whole egg; buttermilk powder, whey, cultured dairy powders)
  4. Acids + salt/sugar (vinegar; citric/lactic acid)
  5. Stabilizers (xanthan/guar, modified starch)
  6. Herbs/spices (garlic, onion, dill, parsley, chives; sometimes oleoresins)
  7. Primary processing
    Oil refining/deodorization; dairy and egg drying/pasteurization; spice dehydration/standardization
  8. Secondary manufacturing (in-house or co-man)
    Hydration, emulsification, pH control, pasteurization/heat step (as applicable), filling
  9. Packaging + QA release
    Bottles/caps/liners/labels; coding; traceability; micro/pH/viscosity checks
  10. Distribution
    Ambient for shelf-stable; cold chain for refrigerated ranch/dips
A left-to-right flowchart showing the ranch dressing supply chain across five stages: upstream inputs, primary processing, secondary manufacturing (co-man vs in-house), packaging and QA release, and distribution (ambient vs cold chain), with callouts for failure points like packaging lead times, co-man capacity windows, allergen changeovers, QA hold times, and volatile oil/egg inputs.

Why this matters for procurement cadence

  • Weekly decision pressure often comes from: packaging lead times, co-man capacity windows, and oil/egg volatility.
  • Quarterly decision pressure comes from: contract indexing design, dual-sourcing approvals, and co-man contingency qualification.

Trade-off to keep visible: Lowest unit cost vs. continuity + change-control burden (QA validation, sensory, labeling, customer approval).

2) Where the money accumulates: cost & margin by supply-chain node (with procurement levers)

Key insight (the “so what”)

For most shelf-stable ranch, edible oil + packaging often dominate the controllable cost base, while egg/dairy and co-man constraints drive the biggest continuity and quality risks. This is why “beat up the blender” negotiations often miss the real drivers.

Below is a node-by-node view of what typically drives cost, margin, and failure modes.

2.1 Upstream / Raw materials (ingredients + packaging components)

What drives cost

  • Edible oils: often the largest single ingredient cost; linked to oilseed markets and biofuel demand.
  • Egg products: shock-prone (HPAI), often the most volatile “small-ish” line item.
  • Dairy powders: energy-intensive drying economics; global dairy trade dynamics.
  • Spices/herbs: smaller cost share but higher risk of quality nonconformance/adulteration.
  • Packaging resin + paper: HDPE/PET for bottles, PP/HDPE caps, liners, and corrugate.

What fails in real life

  • Oil substitutions that look equivalent on paper but shift mouthfeel or emulsion stability.
  • Egg/dairy supplier changes that trigger allergen controls, micro holds, and shelf-life revalidation.
  • “Minor” spice changes that create sensory drift and customer complaints.

Procurement levers that work

  • Separate the category into (A) index-linked commodities (oil, resin/corrugate) vs. (B) spec-governed inputs (egg/dairy/spices/stabilizers).
  • Use indexing rules for the commodity bucket and spec + service governance for the rest.

Data points worth anchoring

  • In U.S. vegetable oil consumption, soybean oil is the largest share (SOYSTATS reference guide shows soybean at ~54% of vegetable oil consumption in a cited marketing year view). [6]
  • Egg pricing has shown extreme swings during the HPAI era; major reporting cited $4.95/dozen (Jan 2025) and $6.23/dozen (Mar 2025) national averages. [1]

Trade-off: Indexing reduces negotiation friction but can increase short-term COGS volatility if finance prefers fixed pricing.

2.2 Primary processing (refining, drying, standardization)

What drives cost

  • Refining and deodorization cost embedded in oil pricing.
  • Pasteurization/spray-drying economics for egg and dairy powders.
  • Standardization/blending for seasoning systems.

What fails

  • Micro or quality deviations upstream that only show up as downstream instability (separation, off-flavors).

Procurement levers

  • Require lot-level CoAs aligned to what matters in ranch: micro limits, moisture, emulsification performance, flavor intensity.
  • Build spec bands (acceptable ranges) rather than single-point specs where possible—this increases alternate supplier feasibility without breaking the product.

Trade-off: Wider spec bands increase supply flexibility but can increase sensory variability if not paired with robust incoming QA and sensory guardrails.

2.3 Secondary manufacturing (your plant or a co-man)

What drives cost

  • Conversion/tolling fees, labor, sanitation/CIP, line OEE, changeover losses, QA holds.
  • Capacity premiums during peak demand windows.

What fails

  • Co-man line scheduling conflicts due to allergen changeovers (egg/milk) and sanitation windows.
  • Startup scrap and rework constraints for emulsions.

Procurement levers

  • Contract for capacity access (defined run windows, minimum reserved hours) not just $/case.
  • Put service-level definitions in writing: OTIF, fill-weight compliance, hold-and-release timelines, escalation paths.

Trade-off: Paying for capacity/reservation can look like “extra cost,” but it often reduces the far more expensive cost of out-of-stocks and expedited freight.

2.4 Packaging & QA release (where lead times quietly kill service)

What drives cost

  • Bottle/cap/label/corrugate unit costs and scrap.
  • QA testing and hold time (micro, pH, viscosity; allergen verification).

What fails

  • Packaging shortages or artwork/label compliance delays that stop production even when ingredients are available.

Procurement levers

  • Dual-source critical packaging (bottle + cap + liner as a system).
  • Lock change-control: no resin/liner changes without compatibility checks (torque, sealing, leakage, induction seal performance).

Market signal to watch

The U.S. PPI for corrugated shipping containers is tracked by BLS/FRED and demonstrates meaningful movement over time—use it to govern corrugate pass-throughs rather than treating corrugate as “misc packaging.” [2]

Trade-off: Dual-sourcing packaging increases qualification workload and may reduce economies of scale, but materially improves continuity.

2.5 Logistics & distribution (ambient vs refrigerated changes everything)

What drives cost

  • Weight/volume economics (ranch is heavy and ships as “water + oil”).
  • Cold-chain premiums for refrigerated ranch/dips.

What fails

  • Temperature excursions for refrigerated items.
  • Peak-season trucking constraints.

Procurement levers

  • Separate freight strategy by channel: ambient network optimization vs. cold-chain service assurance.

Trade-off: Lowest-cost carriers can increase damage/leakage claims if handling discipline is weak.

Product-level cost breakdown tables (illustrative, decision-useful)

The tables below model typical cost concentration by node for major ranch product forms. These are not “universal truths”; they’re designed to help procurement teams see where to focus negotiations and risk controls. Ratios sum to 100% and should be tuned to your actual pack size, channel, and conversion model.

A 3-bar 100% stacked bar chart comparing cost ratios across ranch formats: shelf-stable bottled ranch (35/5/15/25/10/10), refrigerated ranch/dip (38/6/14/18/16/8), and foodservice bulk ranch (40/5/18/12/15/10). Each bar is segmented into consistent supply-chain nodes (upstream ingredients, primary processing, secondary manufacturing, packaging and QA, logistics and distribution, and margin/trade or distributor margin) with callouts noting that oil plus packaging dominate shelf-stable, cold chain increases logistics share, and bulk shifts more to ingredients plus conversion.

A) Shelf-stable bottled ranch (retail, HDPE/PET)

Supply Chain Node Cost Ratio (% of final delivered cost) What usually moves it most
Upstream raw materials (ingredients) 35% Oil index moves; egg/dairy volatility
Primary processing embedded in inputs 5% Drying/refining pass-through
Secondary manufacturing (conversion/co-man) 15% OEE, changeovers, labor, capacity premiums
Packaging & QA 25% Bottle/cap resin + corrugate + scrap/holds
Logistics & distribution 10% Weight-based freight, seasonality
Wholesale/retail margin & trade 10% Channel mix, promo intensity

B) Refrigerated ranch / dip (dairy-forward, cold chain)

Supply Chain Node Cost Ratio (% of final delivered cost) What usually moves it most
Upstream raw materials (ingredients) 38% Dairy system cost; egg; cultured ingredients
Primary processing embedded in inputs 6% Dairy drying/processing economics
Secondary manufacturing (conversion/co-man) 14% Sanitation/allergen scheduling; yield loss
Packaging & QA 18% Tubs/lids/films; QA holds; shelf-life testing
Logistics & distribution 16% Refrigerated freight + shrink risk
Wholesale/retail margin & trade 8% Category pricing architecture

C) Foodservice bulk ranch (bag-in-box / pails)

Supply Chain Node Cost Ratio (% of final delivered cost) What usually moves it most
Upstream raw materials (ingredients) 40% Oil + egg/dairy
Primary processing embedded in inputs 5% Refining/drying pass-through
Secondary manufacturing (conversion/co-man) 18% Run efficiency, batch size, capacity
Packaging & QA 12% BIB film/fitments or pails; fewer labels
Logistics & distribution 15% Heavy shipments, DC-to-operator routing
Distributor margin 10% Foodservice distribution economics

3) One structural fact that changes how you should contract: pH governance is a “license to operate”

For shelf-stable dressings, pH control is not a lab detail—it’s a procurement governance requirement because it governs microbial stability, shelf life, and whether a supplier/co-man can reliably run the process.

  • FDA guidance content and the underlying regulatory framework define acidified foods as those with finished equilibrium pH of 4.6 or below (and aw > 0.85). [3]
  • Published food-science work shows ranch products can sit in the acidified range; one study referenced a premium ranch dressing at pH 4.4 (used in shelf-life work). [7]

What procurement should do with this

  • Put pH measurement method, calibration frequency, and hold/release rules into supplier quality agreements.
  • If you use co-mans, require clarity on who owns process authority (scheduled process / process filing responsibility where applicable) and what happens when pH drifts (rework, disposal, deviation handling).

Trade-off: Tighter QA release gates can increase lead time; the alternative is higher risk of quality escapes and recalls.

4) The critical insight: why ranch input costs and supplier price moves often “don’t match”

Procurement teams often expect ranch pricing to track “food inflation” broadly. In reality, ranch COGS behaves like a portfolio of partially uncorrelated drivers:

  • Oil can move with crop yields, crush margins, and biofuel demand.
  • Egg can spike on disease shocks (HPAI), independent of oil.
  • Packaging can move with resin and corrugate cycles.
  • Co-man conversion can jump when capacity tightens—even if commodities soften.

That’s why you can see:

  • A supplier pushing a price increase during a period when one input (e.g., oil) is down—because packaging or capacity is up.
  • A supplier refusing to hold price despite indexing—because the contract indexed the wrong driver or used a lag that doesn’t match their coverage.

Concrete example of shock behavior

  • U.S. egg prices experienced major swings in 2025 tied to bird flu impacts, with reported record-high monthly averages (e.g., $6.23/dozen in March 2025) and subsequent declines as supply recovered. [5]

Trade-off: Over-indexing everything can reduce negotiating leverage; under-indexing creates constant disputes and surprise increases.

5) Where procurement teams typically get ranch wrong (and the avoidable consequences)

  1. Treating ranch as a single “condiment” category
  2. Consequence: you miss that packaging and co-man capacity are often as constraining as ingredients.
  3. Negotiating only on $/case without a cost-driver model
  4. Consequence: you accept broad increases you could have challenged—or you force cuts that break specs.
  5. Assuming alternates are easy (especially for egg/dairy systems)
  6. Consequence: emergency substitutions trigger QA rework, sensory failures, or label changes.
  7. Not qualifying packaging as a system (bottle+cap+liner)
  8. Consequence: leak issues, torque drift, line downtime.
  9. No “decision-ready” contingency plan for co-mans
  10. Consequence: when a co-man slips, you start qualification too late and lose weeks.

Trade-off: Building a deeper governance model takes time; it pays back by reducing firefighting and expediting.

6) What an intelligence-driven approach changes (without pretending it replaces QA)

The practical shift is from reactive buying to decision-grade governance.

A) Price intelligence that procurement can actually use

  • Decompose ranch COGS into oil vs egg/dairy vs packaging vs conversion vs freight.
  • Benchmark supplier moves against the relevant drivers (not generic CPI).
  • Set indexing and surcharge rules (what indexes, what lags, what caps/floors, what documentation is required).

B) Risk monitoring that triggers actions early

Watch for signals that matter to ranch continuity:

  • Egg supply shocks (HPAI waves)
  • Corrugate and resin cycle shifts
  • Co-man capacity constraints and lead-time creep

C) Alternative pathways mapped to spec bands

Pre-map alternates by spec bands (oil type, egg format, stabilizer system) and flag constraints:

  • allergen controls
  • sensory drift risk
  • labeling changes
  • process compatibility

What remains to validate (explicitly)

  • QA/regulatory sign-off, sensory, shelf-life validation, and customer approvals where required.

Trade-off: Intelligence increases option value; it doesn’t eliminate validation time.

7) Strategic use cases procurement leadership can operationalize this quarter

  1. Rebuild the ranch contract architecture (cost vs continuity portfolio)
  2. Split into: commodities (indexed) + spec-governed inputs (fixed/negotiated) + conversion (capacity + SLA)
  3. KPI outcomes: fewer disputes, improved savings realization, fewer surprise increases
  4. Packaging dual-source program (bottle/cap/liner) with qualification pipeline
  5. Paper audit → samples → line trial → commercial approval
  6. KPI outcomes: reduced downtime, reduced expedite freight, lower concentration risk
  7. Co-man continuity plan with staged alternates
  8. Define “ready states” (paper-qualified vs trialed vs commercially ready)
  9. KPI outcomes: reduced time-to-switch, improved OTIF
  10. Egg/dairy risk governance (allergen + micro + availability)
  11. Tighten supplier quality agreements and contingency specs
  12. KPI outcomes: lower incident rate, faster containment

Trade-off: Each use case increases upfront workload; it reduces the much larger cost of service failures and emergency changeovers.

8) Why this matters beyond ranch: transferable lessons to adjacent categories you likely buy

If you source ranch, you likely also source categories with similar “multi-driver” behavior:

  • Mayonnaise & aioli: even more oil/egg exposure; similar emulsion stability and allergen governance.
  • Creamy dips & refrigerated sauces: cold-chain cost-to-serve and shelf-life risk dominate.
  • BBQ sauce / ketchup: packaging + sweeteners + tomato paste dynamics; high promo sensitivity.
  • Seasoning blends (including dry ranch): smaller freight footprint but higher spice authenticity and contamination/adulteration governance needs.

The transferable procurement principle

Build a cost-driver model + qualification pipeline once, then reuse the governance pattern across emulsified sauces and dips.

Trade-off: Standardization can oversimplify truly different formulations; keep spec libraries product-specific.

9) Why ranch is a strong “proof case” for procurement intelligence

Ranch is a high-signal category because it combines:

  • Commodity exposure (oil, resin, corrugate)
  • Food safety and allergen governance (egg, milk)
  • Process sensitivity (emulsion stability, pH control)
  • Capacity constraints (qualified co-mans and sanitation scheduling)

That combination makes it easy to measure whether better intelligence is improving outcomes:

  • Savings realization (vs. budget)
  • OTIF / service level
  • Incident rate (quality holds, complaints, rework)
  • Concentration risk (single-source exposure for packaging/co-man/egg)

Trade-off: The category is complex enough that “simple” sourcing playbooks underperform—so governance discipline matters more than heroic negotiation.

Tridge Eye Data Intelligence Solution

Make Faster, Data-Driven Sourcing Decisions

The insights in this report are just the starting point. Tridge Eye is the data intelligence solution that gives procurement and sourcing leaders real-time market signals, price benchmarks, and supply risk alerts — so you can act before the market moves.

Explore Tridge Eye →

References

  1. apnews.com
  2. fred.stlouisfed.org
  3. fda.gov
  4. incredibleegg.org
  5. apnews.com
  6. soystats.com
  7. pubmed.ncbi.nlm.nih.gov
Subscribe
By subscribing you agree to with our Privacy Policy and provide consent to receive updates from our company.
Thank you! Your submission has been received!
Oops! Something went wrong while submitting the form.
Subscribe to receive the latest blog posts, updates, promotions, and announcements from Tridge.