INDUSTRY TRENDS

Quail Egg Sourcing (U.S.-Led): A Practical Playbook for Landed Cost, Allocation Risk, and Audit-Ready Supply Continuity

Author
Team Tridge
DATE
April 3, 2026
10 min read
quail-egg Cover
Tridge Eye Data Intelligence Solution

This report is powered by Tridge Eye Data Intelligence.

Every data point, price signal, and supply risk insight in this analysis comes from the same platform that procurement and sourcing leaders worldwide rely on daily. As you read, consider what this level of market intelligence could do for your sourcing decisions.

Explore Tridge Eye →

Quail eggs can look like a “small, specialty” subcategory, but the buying dynamics are not small: supply is often fragmented, quality losses are highly nonlinear (breakage/yield), and the governance burden changes materially once you move from shell eggs into processed egg products. This guide translates those realities into procurement decisions—how to qualify suppliers, normalize quotes, set the right contract cadence, and run governance with metrics that actually predict cost and service outcomes.

Executive Summary

  • Two different supply chains: In-shell is a fragility + cold-chain problem; peeled/value-added is a labor + yield + allocation problem.
  • Cold chain reference point (U.S.): FDA retail guidance commonly references holding raw shell eggs at ≤45°F (7°C) during storage/display. [1]
  • Regulatory step-change: In the U.S., processed egg products are under USDA-FSIS inspection/oversight (Egg Products Inspection Act framework) and commonly rely on pasteurization as a lethality step—your supplier qualification packet must tighten accordingly. [2]
  • EU documentation reality (if you buy from/into the EU): EU marketing standards set grading/labeling/packing and record-keeping expectations for eggs sold in the EU. [3]
  • Cost truth: For in-shell quail eggs, “savings” often evaporate via breakage, claims, and expedited replacements. For peeled products, the big swing is intact-yield % and labor throughput.
  • Govern like a system: Manage quail eggs as landed cost (unit + freight + shrink + compliance + service failure cost), not as $/dozen.

Key Insights

(Analyzed at: Apr, 2026)

  • Strategy: Buy
  • Reliability: Medium
  • Potential Saving: 6% ~ 14%
  • Insight: If you are still single-sourcing (common in quail due to “small volume”), the fastest, most repeatable savings and risk reduction in 2026 is dual-source + lane-level shrink control: (1) pre-qualify one secondary supplier per format (in-shell and/or peeled), and (2) normalize all quotes into $/1,000 eggs delivered (or $/kg peeled) with explicit defect and temperature responsibilities. This tends to unlock savings by reducing emergency buys, lowering breakage/claims, and improving negotiation leverage—without betting on a specific “market price drop.”

Quail Egg Sourcing: Cost, Risk, and Supply Continuity Playbook

1) The Ground Truth: How Quail Eggs Actually Flow (and Where It Breaks)

Quail eggs look like a simple commodity, but procurement outcomes are driven by two very different supply chains:

A side-by-side flow diagram with two lanes. Lane A (Fresh In-Shell): Farm (layers) → Collection trays → Washing/Sanitizing + Candling/Inspection + Grading → Packing (cartons/trays) → Refrigerated distribution → Retail/Foodservice. Lane B (Processed): Farm → Breaking/Cooking (boil) → Peeling (yield bottleneck highlighted) → Chilled packs OR Brined/Pickled/Marinated OR Retort/Canned → Distribution (chilled vs ambient called out). Add callouts for primary risk drivers: 'Fragility + Cold Chain' on Lane A and 'Labor + Yield + Allocation' on Lane B.
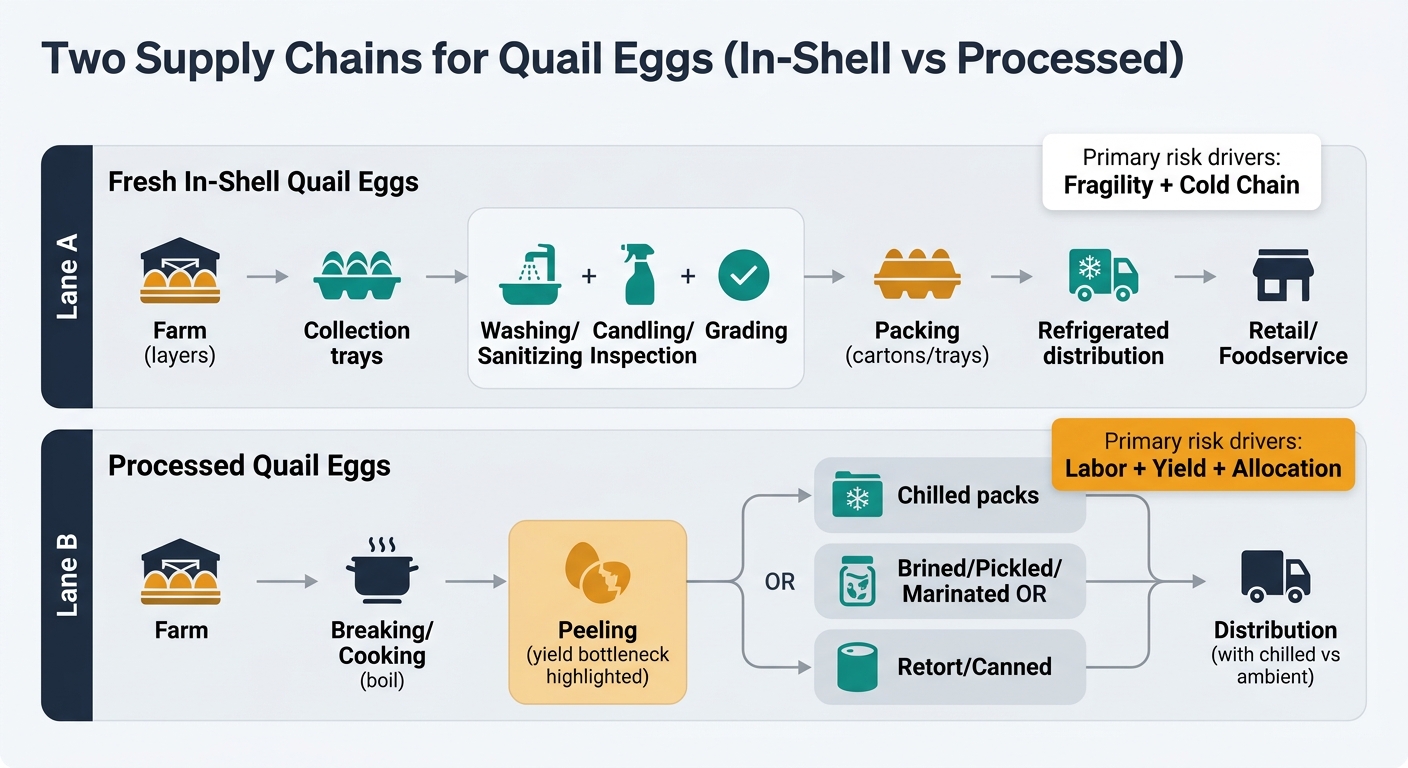
  1. Fresh in-shell quail eggs (local/regional, fragile, cold-chain sensitive)

  2. Farm (layers)collection trayswashing/sanitizing + candling/inspection + gradingpacking (cartons/trays)refrigerated distributionretail/foodservice
  3. Procurement reality: breakage + shell cleanliness + temperature control drive claims and service failures more than “unit price.”
  4. Processed quail eggs (more tradable, processing-bottlenecked)

  5. Farmbreaking/cooking line (boil) → peeling (yield bottleneck)chilled packsorbrined/pickled/marinatedorretort/canneddistribution (often ambient for retort)
  6. Procurement reality: labor/throughput and yield loss at peeling can create sudden allocation—even when farm output looks stable.

What makes quail eggs structurally different from chicken eggs (for sourcing teams)

  • Capacity is “lumpy.” Many suppliers are small-to-mid scale; adding volume often requires flock expansion + time.
  • Cycle speed is fast, but not instant. Japanese quail (Coturnix) commonly begin laying at roughly 6–8 weeks of age under managed conditions—helpful for recovery, but not a next-week fix. [4]
  • Cold chain is not optional for fresh. U.S. retail food safety guidance commonly references holding raw shell eggs at 45°F (7°C) or below while stored/displayed. [1]
  • Processed egg products shift oversight and audit scope in the U.S. Egg products are under USDA-FSIS inspection/oversight (Egg Products Inspection Act framework) and typically rely on pasteurization/heat treatment controls; FSIS also runs verification programs for domestic egg products. [2]

Procurement implication: you are not buying “quail eggs.” You are buying a fragility profile (in-shell) or a processing-yield profile (peeled/value-added)—and each one has different cost drivers, risks, and governance controls.

2) Where the Money Goes: Cost & Margin Build-Up by Supply-Chain Node

Key insight

In quail eggs, procurement teams often over-index on farmgate/unit price. But the major cost swings typically come from:

  • Feed and energy (farm)
  • Shrink/breakage (fresh logistics)
  • Labor + yield loss (boil/peel lines)
  • Packaging format (glass jars/retort pouches vs trays)
  • Compliance and lot-traceability overhead (especially for processed)

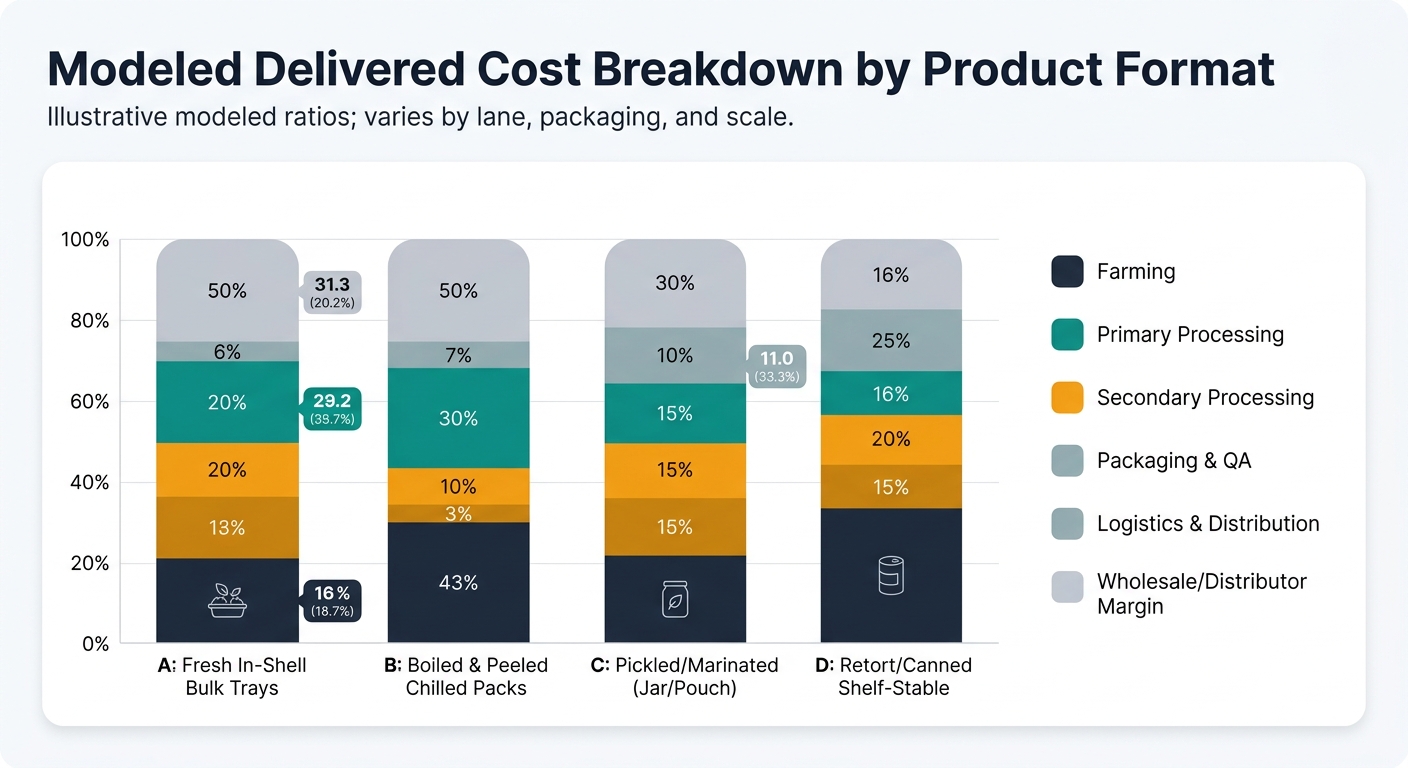
Below is a practical, procurement-oriented node-by-node view.

2.1 Upstream: Layer Farming (Live quail → raw eggs)

What matters operationally

  • Output depends on lay rate, mortality, and shell integrity (which drives downstream pack-out).
  • Quail can start laying around 6–8 weeks and ramp quickly, but flock health and management can still create volatility. [4]

Cost drivers you can actually negotiate/monitor

  • Feed pass-through logic (corn/soy proxies), energy (ventilation/cooling), labor.
  • Biosecurity and veterinary costs (often show up as “supply tightness” rather than line-item surcharges).

Procurement governance controls

  • Require flock/lot traceability fields on packing docs (e.g., pack date/lot code; farm/flock identifier where available).
  • Agree on minimum shelf-life at receipt and temperature expectations for handoff.

2.2 Primary processing: Washing/Sanitizing, Candling, Grading, Packing (in-shell channel)

What matters operationally

  • Grading yield: cracks, dirty shells, thin shells, off-size distribution.
  • Pack format choice (bulk trays vs retail cartons) influences breakage and labor.

Cost drivers

  • Labor for inspection/packing, packaging materials, rework.
  • “Invisible” cost: higher crack rates mean suppliers either raise price or quietly reduce service levels.

Procurement controls

  • Define acceptance thresholds (e.g., max crack rate at delivery, cleanliness standard, size/weight band).

2.3 Secondary processing: Boiled/Peeled, Pickled/Marinated, Retort/Canned

What matters operationally

  • Peeling is the bottleneck. It is labor-intensive and yield-sensitive; small changes in shell strength or cook parameters change intact-egg yield.
  • Shelf-stable retort/canned products trade higher packaging + process validation cost for lower cold-chain risk.

Regulatory/verification context (U.S.)

  • Egg products are under USDA-FSIS oversight under the Egg Products Inspection Act framework, and commonly use pasteurization/heat treatment controls; FSIS also issues guidance for egg products plants and runs verification programs for domestic egg products. [2]

Cost drivers

  • Labor (peeling/inspection), yield loss from cracks, energy/steam, ingredients (vinegar/salt/soy-based marinades), packaging (jars/cans/pouches), QA testing.

Procurement controls

  • Require yield and defect reporting (intact %, doubles, tears) for peeled products.
  • For shelf-stable: require process authority/retort validation documentation and lot coding discipline (and align on who owns deviation disposition).

2.4 Packaging & QA (all channels)

What matters operationally

  • Packaging is not cosmetic—it is a shrink-control system (shock absorption, seal integrity, tamper evidence).

Cost drivers

  • Glass/metal/pouch costs, labels, coding, QA sampling, audit costs.

Procurement controls

  • Packaging performance KPIs by lane (breakage per 1,000 eggs; seal failures; label/code accuracy).

2.5 Logistics & distribution

What matters operationally

  • Fresh and chilled peeled require reliable refrigeration; U.S. retail guidance commonly references ≤45°F (7°C) for raw shell eggs while stored/displayed. [1]
  • Shelf-stable formats are more resilient to cold-chain disruption but can have longer lead times and higher working-capital.

Cost drivers

  • Refrigerated freight, accessorials, damage claims, inventory holding.

Procurement controls

  • Lane-level OTIF + temperature excursion reporting (define data source: recorder, carrier telematics, or receiver probe).

2.6 End markets (retail/foodservice/industrial)

What matters operationally

  • Retail penalizes defects visibly; foodservice penalizes inconsistency and stockouts.
  • Industrial users care about uniformity and defect rates because it hits line efficiency.

Cost drivers

  • Distributor margin, retailer markup, chargebacks.

Product-level cost breakdown (illustrative, modeled)

Values below are modeled % of final delivered cost to a mid-size U.S. buyer. Actual ratios vary by region, packaging, lane length, and supplier scale. Use these as a should-cost discussion scaffold, not as a pricing “truth.”

A stacked bar chart with four bars (A: Fresh In-Shell Bulk Trays, B: Boiled & Peeled Chilled Packs, C: Pickled/Marinated (Jar/Pouch), D: Retort/Canned Shelf-Stable). Each bar is segmented by cost nodes with percentages matching the tables: Farming, Primary Processing, Secondary Processing, Packaging & QA, Logistics & Distribution, Wholesale/Distributor Margin. Use consistent colors for each node across all bars and include a legend. Title and subtitle note: 'Illustrative modeled ratios; varies by lane, packaging, and scale.'

A) Fresh in-shell quail eggs (bulk trays for foodservice)

Supply Chain Node Cost Ratio (% of Final Cost) Notes
Farming (egg production) 45% Feed + flock performance dominate.
Primary processing (wash/grade/pack) 15% Labor + grading yield + trays/cartons.
Secondary processing 0% N/A
Packaging & QA 8% Tray spec and inspection discipline reduce breakage.
Logistics & distribution 17% Refrigerated freight + damage/shrink is material.
Wholesale/distributor margin 15% Varies by channel concentration.

B) Boiled & peeled quail eggs (chilled, vacuum/MAP packs)

Supply Chain Node Cost Ratio (% of Final Cost) Notes
Farming (egg production) 30% Still important, but downstream dominates.
Primary processing 10% Pre-sort and routing to cook line.
Secondary processing (boil/peel/inspect) 28% Labor + yield loss is the swing factor.
Packaging & QA 12% Pack integrity + micro testing expectations.
Logistics & distribution 10% Chilled chain, shorter shelf-life.
Wholesale/distributor margin 10% Often negotiated via volume commitments.

C) Pickled/marinated quail eggs (jar or pouch; often ambient if retorted)

Supply Chain Node Cost Ratio (% of Final Cost) Notes
Farming (egg production) 22% Raw egg share diluted by packaging and processing.
Primary processing 8% Sorting + pre-cook handling.
Secondary processing (cook + formulation + fill) 20% Ingredients + line efficiency.
Packaging & QA 25% Glass/metal/pouch + coding + QA.
Logistics & distribution 10% Ambient lowers freight volatility.
Wholesale/distributor margin 15% Brand and channel power matter.

D) Retort/canned quail eggs (shelf-stable)

Supply Chain Node Cost Ratio (% of Final Cost) Notes
Farming (egg production) 18% Lower share; processors capture more value.
Primary processing 7% Pre-processing and grading.
Secondary processing (retort/can) 18% Energy + process controls + throughput.
Packaging & QA 32% Can/jar + retort validation + QA overhead.
Logistics & distribution 10% Typically dry freight; longer lead times.
Wholesale/distributor margin 15% Long shelf-life supports inventory programs.

3) The Structural Facts That Shape Your Category Strategy (Whether You Like It or Not)

  1. Fresh in-shell is a breakage business. If your supplier’s packaging and handling controls are weak, you will “save” on unit price and lose on claims, rework, and emergency buys.
  2. Processed (peeled) is a yield business. Your real exposure is not just price—it’s allocation when labor or yield drops at peeling lines.
  3. Regulatory/governance burden increases when you move from shell eggs to egg products (U.S.). Egg products fall under USDA-FSIS oversight under the Egg Products Inspection Act framework, with pasteurization/heat-treatment control expectations and FSIS verification programs—so your supplier QA packet must be tighter than a typical shell-egg program. [2]
  4. EU buyers and suppliers operate under marketing standards for eggs (grading/labeling/packing rules), which can affect cross-border spec alignment and documentation expectations. [3]

4) The Critical Insight: Why “Egg Price” and “Delivered Cost” Diverge in Quail

Procurement teams often assume a linear relationship: farm price up → delivered price up.

In quail eggs, the relationship frequently breaks because:

  • Shrink and damage are nonlinear. A small deterioration in shell strength or packaging can double breakage on a lane. That converts into:
  • more credits/claims
  • more expedited replacements
  • more downtime (receiving QA holds)
  • Peeled egg economics are dominated by yield and labor. When labor tightens or shell integrity changes, suppliers protect themselves by:
  • allocating volume to “best” customers
  • widening spec tolerance (appearance defects)
  • raising price more than farm egg inflation would suggest
  • Cold-chain constraints create step-changes. A tight refrigerated lane can swing landed cost more than the egg itself.

Practical takeaway: treat quail eggs as a landed-cost system (unit + shrink + freight + compliance + service failure cost), not a unit-price line item.

5) Where Procurement Teams Typically Misstep (and the Predictable Consequences)

  1. Single-source “because volume is small.”
  2. Misstep: one farm/packer looks “good enough.”
  3. Consequence: a single biosecurity event or lane disruption becomes an immediate stockout.
  4. Specs that are too vague to enforce.
  5. Misstep: “clean, intact eggs” without measurable thresholds.
  6. Consequence: recurring disputes, inconsistent pack-out, and hidden shrink.
  7. Comparing quotes without normalization.
  8. Misstep: comparing $/dozen across different tray counts, grade distributions, delivery terms, and temperature obligations.
  9. Consequence: you award to the lowest apparent price and pay later via freight, breakage, or quality holds.
  10. Treating processed formats as interchangeable.
  11. Misstep: assuming peeled chilled and retort shelf-stable are just packaging choices.
  12. Consequence: you under-plan working capital and lead time—or overpay for cold chain you don’t need.

6) What an Intelligence-Driven Sourcing Workflow Changes (Decision-by-Decision)

This is not about “more data.” It’s about changing the specific procurement decisions that drive cost, continuity, and governance.

Decision A: “Who else can supply our spec, reliably?” (Supplier discovery + pre-qualification)

  • Build a tiered supplier longlist by:
  • format: in-shell vs peeled vs pickled/retort
  • capacity tier: primary / secondary / emergency
  • geography: diversify lanes to reduce correlated disruption
  • Pre-qualify with a consistent packet:
  • cold-chain capability (for fresh/chilled)
  • grading/yield controls
  • traceability fields (lot/flock/date)
  • audit and testing cadence (especially for egg products)

Decision B: “Is this quote actually competitive?” (Benchmarking + should-cost framing)

  • Normalize quotes into a true comparable:
  • $/1,000 eggs delivered (or $/kg for peeled)
  • include packaging spec, delivery term, minimum shelf-life, defect allowance
  • Build a should-cost narrative:
  • farm drivers (feed/energy)
  • processing drivers (labor/yield)
  • logistics drivers (refrigerated vs ambient)

Decision C: “When do we lock in vs stay flexible?” (Price intelligence + risk monitoring)

  • Segment volume:
  • base-load under stability terms (service-level + allocation clauses)
  • swing volume kept contestable across alternates
  • Set trigger thresholds:
  • breakage > X per 1,000 eggs on a lane
  • OTIF < Y% for 4 weeks
  • defect/claim rate trend inflection

Decision D: “Are suppliers improving or just apologizing?” (Performance analytics)

  • Track:
  • OTIF
  • defect rate (cracks, dirty shells, peel defects)
  • claims per shipment
  • price variance vs benchmark
  • concentration risk (% volume by supplier/region)

7) Strategic Use Cases Procurement Leaders Can Operationalize in 30–90 Days

  1. Dual-source design for continuity (without doubling admin work)
  2. One primary + one secondary per format
  3. Align specs so switching doesn’t require emergency waivers
  4. Lane-by-lane shrink reduction program (biggest hidden ROI in fresh in-shell)
  5. Test packaging upgrades (tray strength, corner protection)
  6. Measure breakage and temperature excursions by lane and carrier
  7. Peeled egg yield governance (protect against allocation and silent quality drift)
  8. Require monthly yield/defect reporting
  9. Tie renewal to sustained improvement, not one-time corrective actions
  10. Format strategy: replace cold-chain exposure with shelf-stable where feasible
  11. For some foodservice and industrial uses, retort/pickled formats can reduce disruption risk
  12. Trade-off: higher packaging cost + longer lead time + working capital
  13. Audit-ready documentation and traceability standardization
  14. Standard fields across suppliers (lot code, pack date, farm/flock identifier)
  15. Reduces time-to-investigate and recall exposure

8) Why This Matters Beyond Quail Eggs (and Where You’ll See the Same Pattern)

Quail eggs are a clean example of a broader procurement truth: unit price is rarely the largest lever once you include yield, logistics, and governance.

Similar patterns show up in:

  • Berries (fresh): cheap unit price can be erased by shrink, temperature excursions, and short code life.
  • Leafy greens: supplier selection is often a food-safety and traceability decision as much as a cost decision.
  • Seafood (IQF vs fresh): format choice (frozen vs fresh) changes landed cost volatility and service continuity.
  • Dairy ingredients: compliance and testing regimes can dominate total cost of ownership when risk is priced in.

For procurement leadership, the transferable capability is the same:

  • normalize costs
  • monitor risk signals early
  • maintain qualified alternates
  • govern performance with measurable KPIs

9) Why This Quail Egg Example Persuades Internally (CFO, QA, Ops) Better Than Most Categories

Quail eggs force cross-functional alignment because the trade-offs are visible and measurable:

  • Finance: landed-cost variance improves when you separate unit price from shrink/freight.
  • Ops: continuity improves when alternates are pre-qualified and switch-ready.
  • QA/Food safety: governance improves when specs, traceability, and verification expectations are standardized (especially for egg products under USDA-FSIS oversight). [2]

The metrics that make the story real

  • Landed cost variance (vs prior quarter and vs benchmark band)
  • OTIF (by supplier and lane)
  • Defect/claim rate (cracks, cleanliness, peel defects)
  • Concentration risk (% volume by supplier/region/facility)
  • Time-to-switch (days to move X% volume to an approved alternate)

When those metrics are in place, quail eggs stop being a “specialty item problem” and become a repeatable procurement playbook for any fragile, yield-sensitive, compliance-exposed food category.

Tridge Eye Data Intelligence Solution

Make Faster, Data-Driven Sourcing Decisions

The insights in this report are just the starting point. Tridge Eye is the data intelligence solution that gives procurement and sourcing leaders real-time market signals, price benchmarks, and supply risk alerts — so you can act before the market moves.

Explore Tridge Eye →

References

  1. fda.gov
  2. fsis.usda.gov
  3. eur-lex.europa.eu
  4. agriculture.institute
Subscribe
By subscribing you agree to with our Privacy Policy and provide consent to receive updates from our company.
Thank you! Your submission has been received!
Oops! Something went wrong while submitting the form.
Subscribe to receive the latest blog posts, updates, promotions, and announcements from Tridge.