INDUSTRY TRENDS

Processed Eucheuma Seaweed (PES/SRC) Sourcing Guide: Cost Drivers, Risk Bottlenecks, and Procurement Control Points

Author
Team Tridge
DATE
April 3, 2026
9 min read
processed-eucheuma-seaweed Cover
Tridge Eye Data Intelligence Solution

This report is powered by Tridge Eye Data Intelligence.

Every data point, price signal, and supply risk insight in this analysis comes from the same platform that procurement and sourcing leaders worldwide rely on daily. As you read, consider what this level of market intelligence could do for your sourcing decisions.

Explore Tridge Eye →

Procurement teams don’t “just buy seaweed” in this category—they buy functional performance, predictable yield, documentation readiness, and continuity from a supply chain that is fragmented upstream (smallholders) but often bottlenecked midstream (processors with alkali throughput and QA release discipline). This guide explains the real control points that determine total landed cost (TLC/TCO), why “cheaper PES” often becomes more expensive after receipt, and how to operationalize a sourcing approach that is defensible to QA, operations, and auditors.

Executive Summary

  • Supply chain structure: Eucheuma/Kappaphycus farming is highly fragmented (smallholders), while semi-refined processing (PES/SRC) is concentrated in fewer facilities—creating processor bottleneck risk, not just “country risk.” [1]
  • Origin concentration (baseline reality): FAO analyses identify Indonesia and the Philippines as the dominant carrageenan seaweed farming countries historically, with Tanzania/Zanzibar a smaller but important eucheumatoid supply base (often export-oriented). [2]
  • What “PES/SRC” means (terminology): Semi-refined carrageenan is commonly referred to as Processed Eucheuma Seaweed (PES) (also “Philippine Natural Grade/PNG” in some contexts). [3]
  • Process reality that drives cost and variability: Semi-refined processing typically includes KOH alkali treatment, repeated washing/rinsing, optional bleaching, then drying + milling + blending—and the final product retains cellulosic solids. [3]
  • Key hidden-cost mechanism: “Price/kg” is a weak award anchor because moisture, insolubles/foreign matter, and functional consistency drive yield loss, rework, filtration issues, and line downtime.
  • Risk pattern to plan around: Environmental stress (e.g., hyposalinity after heavy rainfall) is documented as a trigger for “ice-ice” disease dynamics in eucheumatoid cultivation—meaning supply/quality shocks can appear upstream before pricing fully resets downstream. [4]

Key Insights

(Analyzed at: Apr, 2026)

  • Strategy: Buy
  • Reliability: Medium
  • Potential Saving: 6% ~ 12%
  • Insight:Run your next PES/SRC award as a “normalized TLC event,” not a price/kg event. In practical terms: (1) convert all bids to usable-solids cost using agreed moisture + insolubles assumptions, (2) require test-method alignment (same sampling plan + method for moisture/ash/insolubles and your functional proxy), and (3) pre-award a qualified backup (docs + COA trend + lab validation) so you can reallocate volumes if a processor’s intake quality or lead time drifts. This usually yields mid-single-digit savings by eliminating false savings and reducing holds/rework/expedites—without needing a “perfect” market forecast.

1) What You’re Actually Buying: The Ground Truth Supply-Chain Flow

Processed Eucheuma Seaweed (PES) sits in the middle of a supply chain that starts as smallholder coastal aquaculture and ends as a functional hydrocolloid input (often into dairy/alt-dairy, processed meats, sauces, confectionery, and pet food). In practice, sourcing teams are rarely buying “seaweed” in a simple sense—they’re buying functional performance + documentation + continuity.

How the flow typically works (and where procurement pain shows up):

  1. Farming (Kappaphycus/Eucheuma “eucheumoids”)

  2. Smallholder farms on lines/rafts in warm tropical waters.
  3. Output: wet seaweed → sun-dried raw seaweed.
  4. Risk: weather and water conditions can change quickly; farming is fragmented.
  5. Aggregation & Primary Handling (village consolidators → traders)

  6. Seaweed moves through middlemen (often 1–2 layers) before a processor sees it.
  7. Sorting and baling decisions here materially affect downstream impurities and moisture risk. [1]
  8. Primary Processing (Cleaned/Graded Dried Seaweed; and/or PES/SRC)

  9. Cleaning, washing, sand/salt removal, controlled drying.
  10. For PES/SRC: alkaline treatment + washing + drying + milling into chips/flakes/powder.
  11. This is where “spec ambiguity” becomes expensive: suppliers can meet a headline spec while delivering very different yield/performance.
  12. Secondary Processing (Refined carrageenan or blended systems)

  13. Some buyers go beyond PES/SRC into refined carrageenan or custom blends.
  14. Higher standardization, higher processing intensity.
  15. Packaging & QA release

  16. Packaging is usually 25 kg multiwall bags with liners.
  17. QA release is where rejections/holds happen if impurity, microbial, or functional tests fail.
  18. Logistics & Distribution

  19. Ambient shipping, but moisture control is non-negotiable.
  20. Lead times are exposed to port performance and container dynamics.

Origin reality (concentration):

  • FAO analyses of carrageenan seaweed farming identify Indonesia and the Philippines as the major producing countries historically, with other producers (including United Republic of Tanzania, especially Zanzibar) contributing at smaller scale but with strategic relevance for diversification. [2]
A left-to-right flowchart showing the end-to-end PES/SRC chain with labeled nodes and procurement control points, including risk bottlenecks such as processor alkali throughput, intake quality variability, QA release discipline, and moisture pickup in transit.

2) Where the Money Really Accumulates: Cost & Margin by Node (PES/SRC economics)

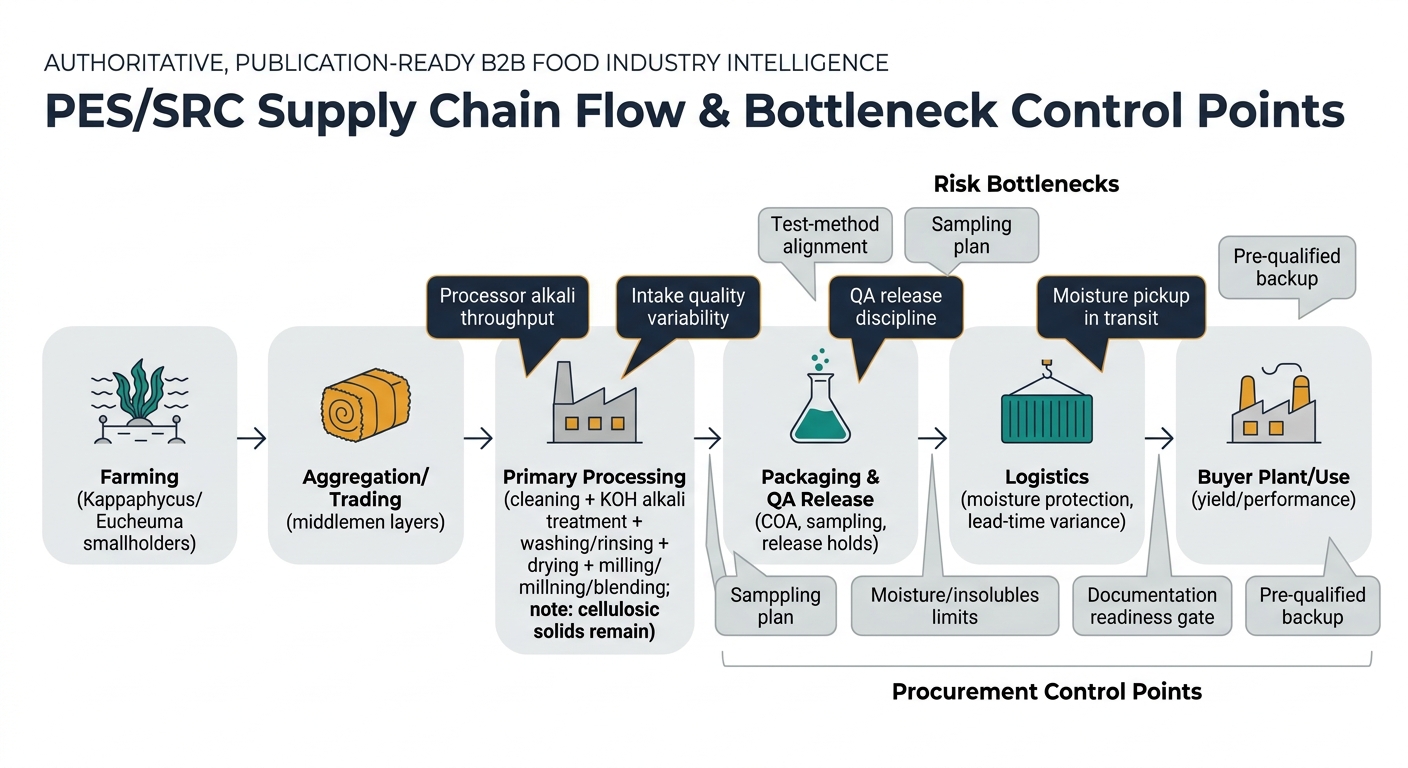
Key insight: In PES/SRC, the “price per kg” is often a misleading procurement anchor because moisture, insolubles/foreign matter, and functional performance variability drive hidden cost via yield loss, rework, and plant disruptions. The biggest value-add (and margin capture) tends to sit in cleaning/drying discipline + alkali processing throughput + QA release capability, not in farming alone.

2.1 Upstream Farming (Wet → Sun-dried raw seaweed)

What matters operationally

  • Harvest cycles can be short (weeks), but output is highly sensitive to water conditions.
  • Fragmented smallholders mean inconsistent drying practices.

Cost drivers

  • Labor (planting/harvest/drying)
  • Yield shocks from weather and stress events
  • Local transport from coastal sites to consolidators

Procurement “tell”

  • When farmgate supply tightens, prices can move quickly; downstream contract prices often lag until inventories clear.

2.2 Aggregation & Trading (Consolidators/middlemen)

What matters operationally

  • Middlemen are common; sometimes multiple layers exist before processors. [1]

Cost drivers

  • Shrink and sorting losses
  • Working capital (holding bales)
  • Informal quality grading (risk of mixed lots)

Procurement “tell”

  • Lot traceability often weakens here unless the processor enforces intake controls.

2.3 Primary Processing: Cleaning/Grading → PES/SRC conversion

What matters operationally

  • Cleaning and controlled drying determine impurity and moisture stability.
  • Semi-refined carrageenan (often called PES/PNG) is typically produced by aqueous KOH treatment (e.g., ~75–80°C for hours), followed by rinsing/washing, optional bleaching, then drying + milling + blending; cellulosic solids remain in the final product. [3]

Cost drivers

  • Labor-intensive cleaning/sorting
  • Water use and wastewater handling
  • Alkali chemicals and energy for heating/drying
  • Milling and sieving
  • QA testing and rework for off-spec lots

Procurement “tell”

  • Two suppliers can quote the same “PES” but differ materially in: insolubles, ash, odor/color, and functional consistency—changing your true cost.

2.4 Secondary Processing: Refined carrageenan / standardization / blends

What matters operationally

  • Refined processing is more capital- and water/energy-intensive than semi-refined.
  • Buyers pay for tighter standardization, documentation, and application support.

Cost drivers

  • Energy/steam, filtration media (for refined)
  • Higher QA/testing frequency
  • Blending agents and formulation know-how

2.5 Packaging & QA release

What matters operationally

  • Packaging integrity and moisture barriers protect functional performance.
  • QA release gates are where shipments get stuck (holds) if documentation or tests fail.

Cost drivers

  • Bags/liners/palletization
  • Sampling, retain samples, third-party testing
  • Certification maintenance (where required by buyer)

2.6 Logistics & distribution

What matters operationally

  • Ambient shipping, but moisture pickup can create mold risk and performance drift.
  • Port congestion and lane changes can create real lead-time variance.

Cost drivers

  • Ocean freight + insurance
  • Inland/inter-island freight (for archipelagic origins)
  • Inventory carrying cost (buffers)

Product-level cost breakdown (illustrative, normalized to “delivered to your plant/DC”)

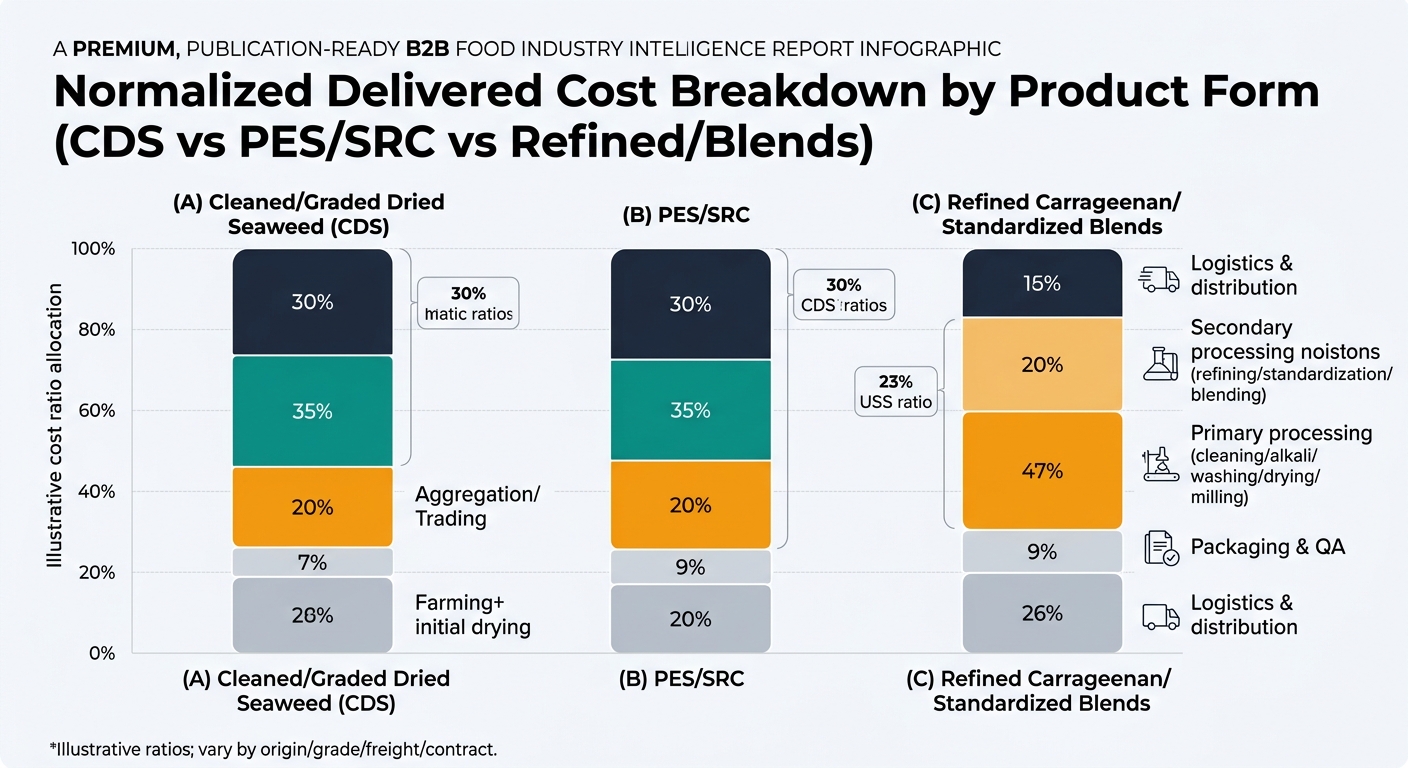
These are modeled ratios to show where cost concentrates by product form. Actual ratios vary by origin, grade, contract structure, and freight market. Use them as a sanity-check framework, not as a quoting tool.

A 3-bar 100% stacked bar chart comparing normalized delivered cost ratios across supply chain nodes for CDS, PES/SRC, and Refined/Blends, with consistent colors per node and segment labels (e.g., 30%, 35%) plus a footnote that ratios are illustrative and vary by origin, grade, freight, and contract.

A) Cleaned/Graded Dried Seaweed (CDS)

Supply chain node Cost ratio (% of final delivered cost) What moves the needle
Farming + initial drying 45% Weather-driven yield, labor availability
Aggregation/trading 15% Sorting losses, mixed lots, working capital
Primary processing (cleaning/grading) 20% Labor + drying control
Packaging & QA 5% Sampling/testing discipline
Logistics & distribution 15% Inter-island + ocean freight volatility

B) Processed Eucheuma Seaweed / Semi-Refined Carrageenan (PES/SRC)

Supply chain node Cost ratio (% of final delivered cost) What moves the needle
Farming + initial drying 30% Raw material tightness after disruption
Aggregation/trading 10% Intake variability, traceability loss
Primary processing (alkali + washing + drying + milling) 35% Energy/chemicals, throughput, rework rate [3]
Packaging & QA 8% Test failures → holds/rework
Logistics & distribution 17% Freight + inventory buffers

C) Refined Carrageenan (RC) / standardized blends

Supply chain node Cost ratio (% of final delivered cost) What moves the needle
Farming + initial drying 20% Raw seaweed price cycles
Aggregation/trading 8% Traceability and lot segregation
Primary processing to semi-refined input 20% Conversion yield
Secondary processing (refining/standardization/blending) 32% Energy/water, filtration, QA intensity
Packaging & QA 10% Compliance + tighter release specs
Logistics & distribution 10% Value density reduces freight share

3) The Structural Fact You Need to Design Your Sourcing Around

PES/SRC is a “processed commodity,” but the supply chain behaves like a hybrid of commodity + specialty ingredient:

  • Upstream is fragmented (many small farms) and shock-prone.
  • Midstream processing is concentrated (fewer plants with alkali throughput + QA labs).
  • Downstream users experience cost through functional performance, not just kg price.

This is why supplier risk is not only “country risk.” It’s processor bottleneck risk (capacity, intake controls, QA release discipline) layered on top of origin exposure.

4) The Critical Insight: Why Your “Cheaper PES” Often Becomes More Expensive After Receipt

The most common price-performance disconnect comes from unpriced variability:

  1. Moisture and insolubles behave like a hidden tax

  2. Higher moisture can inflate delivered weight but reduce usable solids and increase storage risk.
  3. Insolubles/foreign matter create filtration issues, line downtime, or higher rejection rates.
  4. “Same grade” is not the same product unless test methods match

  5. Suppliers may quote to a headline spec, but use different test methods, sampling plans, or internal limits.
  6. Processing discipline determines functional consistency

  7. Semi-refined performance is strongly shaped by alkali treatment and the effectiveness of subsequent washing/drying/milling controls. [3]
  8. Disruption signals hit upstream first, but your cost impact hits later

  9. Farming shocks (monsoons/typhoons, rainfall-driven salinity shifts) tighten raw supply first; processors and traders may buffer with inventory, then downstream prices re-rate when inventories clear.

Real-world risk pattern (disease/environment):

  • Recent research on Eucheuma denticulatum links “ice-ice” disease development to environmental stress (including hyposalinity), consistent with broader FAO discussion that “ice-ice” outbreaks have constrained production in multiple regions historically. [4]

5) The Three Ways Procurement Teams Typically Get This Wrong (and the avoidable consequences)

  1. Awarding on lowest quote without spec normalization

  2. Consequence: false savings → yield loss, higher testing, more holds.
  3. Treating origin diversification as sufficient risk management

  4. Consequence: you still have single points of failure if alternates share the same constrained processor tier or lack documentation readiness.
  5. Running qualification only after a disruption

  6. Consequence: spot premiums + QA backlog + import/document delays—exactly when the business needs speed.

6) How an Intelligence-Driven Approach Changes Monday-Morning Decisions (without false precision)

Selected capabilities (only what changes decisions):

  1. Benchmarking & should-cost inputs
  2. Alternative supplier identification (redundancy planning)

6.1 What changes in your bid event (Benchmarking & should-cost)

Decision you control: “Are these quotes comparable enough to award?”

Action pattern

  • Build a bid normalization checklist that forces like-for-like comparison:
  • Product form: CDS vs PES/SRC vs refined/blend
  • Moisture, insolubles/foreign matter, ash
  • Functional targets and test methods (gel strength/viscosity proxies where relevant)
  • Packaging spec (liner, palletization), shelf-life, storage conditions
  • Incoterms, shipment size (FCL/LCL), inspection/testing responsibility
  • Convert “price/kg” into expected usable solids cost (a procurement-friendly way to capture moisture/insolubles risk).

Outcome

  • Fewer awards that look cheaper but inflate TCO after receipt.

What we cannot conclude without your inputs (explicit limits)

  • We cannot “guarantee” performance without your spec sheet, COA history, and at least a lab/pilot validation plan.

6.2 What changes in your continuity plan (Alternate supplier identification)

Decision you control: “Do we have qualified backups per critical spec—and how fast can we switch?”

Action pattern

  • Create a qualification pipeline with gates:
  • Documentation screen (traceability, certifications, allergen statements, heavy metals/micro limits as required)
  • COA review + sample plan
  • Lab validation (your methods)
  • Pilot trial / plant trial (if needed)
  • Approved backup with allocation rules
  • Maintain a coverage ratio KPI: “qualified backups per critical spec” (target often ≥2).

Outcome

  • Lower disruption premium and faster recovery time when upstream shocks hit.

7) Strategic Use Cases Procurement Leaders Can Operationalize

  1. Quote-to-award governance that prevents false savings

  2. A standard “spec + test method + incoterm” normalization pack for every PES/SRC bid.
  3. Supplier segmentation for allocation rules

  4. Strategic/core suppliers: proven QA consistency + documentation readiness.
  5. Approved backups: pre-qualified, smaller volume allocations to keep them warm.
  6. Risk register designed for this category (not generic)

  7. Track: origin exposure, processor capacity constraints, quality incident rate, documentation gaps, and logistics lead-time variance.
  8. Performance governance cadence

  9. Monthly: OTIF + lead-time variance + price variance
  10. Quarterly: quality incidents + COA drift (moisture/insolubles) + audit/document renewals

8) Why This Intelligence Pattern Matters Beyond Seaweed (for categories you likely also buy)

The same “processed commodity with hidden variability” pattern shows up in:

  • Spices (e.g., paprika, black pepper): headline price hides contamination/adulteration risk; true cost appears in rejections and recalls.
  • Cocoa powder: alkalization level, fat content, and microbiological controls change performance; origin shocks create price volatility.
  • Dairy powders (e.g., SMP/WPC): functional specs and test methods drive plant performance; logistics and shelf-life constraints amplify risk.
  • Hydrocolloids (e.g., guar, locust bean gum): viscosity specs and supplier standardization discipline drive formulation stability.

The procurement lesson is consistent: normalize specs, measure performance drift, and pre-qualify alternates before the market forces you to.

9) Why This Example Is Powerful for Procurement Teams Evaluating Better Sourcing Decisions

Processed Eucheuma Seaweed is a high-leverage category because it forces clarity on the procurement fundamentals that auditors, QA, and operations care about:

  • Decision traceability: why a supplier won (not just “lowest price”).
  • TCO discipline: converting variability (moisture/insolubles/performance) into comparable cost.
  • Resilience by design: backups that are actually qualified, not just “names on a list.”
  • Cross-functional alignment: procurement, QA, and plant operations share the same acceptance logic.

In short: PES/SRC sourcing is where procurement maturity shows—because the market will punish any gap between price and delivered performance.

Tridge Eye Data Intelligence Solution

Make Faster, Data-Driven Sourcing Decisions

The insights in this report are just the starting point. Tridge Eye is the data intelligence solution that gives procurement and sourcing leaders real-time market signals, price benchmarks, and supply risk alerts — so you can act before the market moves.

Explore Tridge Eye →

References

  1. openknowledge.fao.org
  2. fao.org
  3. ams.usda.gov
  4. sciencedirect.com
Subscribe
By subscribing you agree to with our Privacy Policy and provide consent to receive updates from our company.
Thank you! Your submission has been received!
Oops! Something went wrong while submitting the form.
Subscribe to receive the latest blog posts, updates, promotions, and announcements from Tridge.