INDUSTRY TRENDS

Processed Butter Supply Chain Map, Cost Drivers, and Contract Levers (Procurement View)

Author
Team Tridge
DATE
May 4, 2026
8 min read
processed-butter Cover
Processed ButterBlended Butter · Emulsified Butter · Flavored Butter
Powered by Tridge Eye
🇩🇪 Germany↓ 7.5%
$7.18/kg
🇫🇷 France↓ 5.2%
$7.76/kg
🇮🇳 India
$0.35/kg
🇮🇹 Italy↓ 13.8%
$4.72/kg
Wholesale reference prices across 93 markets

Processed butter looks like a “simple” ingredient, but procurement outcomes are mostly determined by a few physical realities: milkfat availability, conversion/packaging capacity, and cold-chain discipline. This guide maps the chain node-by-node, shows where costs get locked in, and translates those realities into contracting and supplier-management decisions.

Executive Summary

  • Standards anchor the physics: butter is typically ≥80% milkfat and ≤16% water; AMF/anhydrous milk fat is commonly ≥99.8% milkfat and ≤0.1% moisture, which changes both processing control and logistics economics [1].
  • Your biggest controllable cost levers are usually moisture control capability (yield vs compliance), pack-format/changeover burden, and temperature-history integrity from dock to dock.
  • Cost-to-serve can rival raw material economics when you move from bulk blocks to high-SKU retail prints/portions due to labor, changeovers, and QA holds.
  • 2026 context (buyer opportunity, still operational risk): U.S. butter pricing has been volatile and recently lower versus prior peaks, but inventory/eligibility dynamics and logistics/packaging constraints can still create allocation-like behavior even in “cheap” markets [2].

1) How Butter Physically Moves (and Where Costs Get “Locked In”)

Processed butter is a milkfat concentration business: you start with raw milk, separate and standardize cream, then convert that fat into a water-in-oil emulsion (butter) or an almost water-free fat (AMF). The physical chain is short, but it is capital- and cold-chain-dependent—so conversion capacity, refrigeration, and packaging lines often matter as much as the farm.

Insight: Butter cost structure is “built” upstream (milkfat availability) and “realized” downstream (conversion yield, cold-chain handling, and pack format complexity).

Data: Codex-aligned references commonly define butter as a water-in-oil emulsion with ≥80% milkfat and ≤16% water; industry standards for anhydrous milk fat (AMF) commonly reference ≥99.8% milkfat with ≤0.1% moisture, reflecting very different processing and logistics requirements [1].

Procurement Impact: Even before commercial strategy, your physical constraints (spec, pack format, storage temperature, and lane length) determine which suppliers are feasible and which cost nodes will dominate your landed cost.

  • Quick Win: Write your internal “butter map” as two parallel flows—(A) butter blocks/prints and (B) AMF/butter oil—because they behave differently in storage, freight, and defect risk.
Node-by-node supply chain flowchart with two parallel lanes: (A) Butter (blocks/prints) and (B) AMF/Butter Oil (drums/IBC), showing upstream milk collection through cream separation/standardization, pasteurization and aging/tempering, secondary processing split (butter making/churning vs concentration/dehydration/vacuum for AMF), packaging & QA, and logistics/storage (chilled/frozen for butter; protected storage/transport for AMF), with callouts for constraints: milkfat availability, conversion/packaging capacity (changeovers/CIP), and cold-chain/temperature-history integrity.

2) Where Money Is Made or Lost: Node-by-Node Cost and Margin Structure

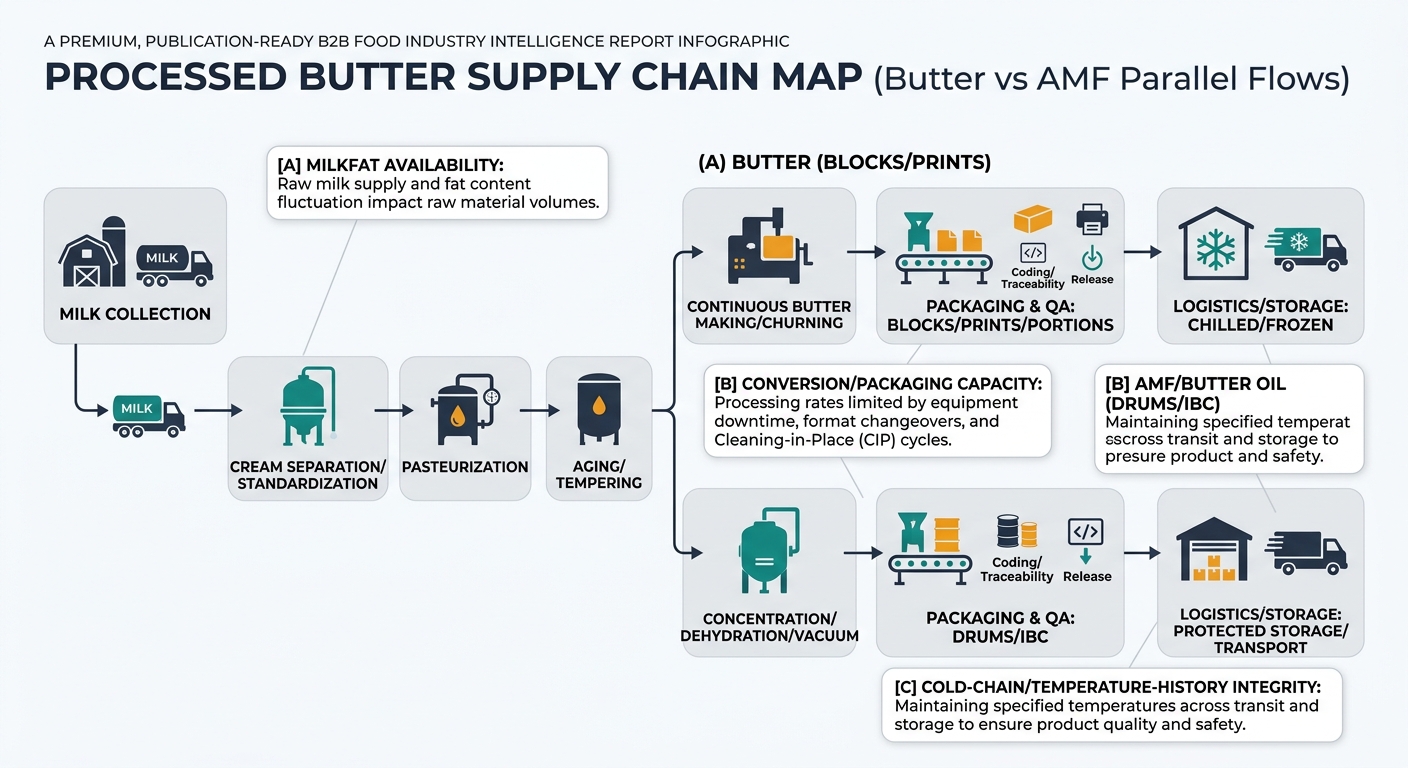
Insight: Butter has fewer supply-chain steps than many ingredients, but each node has a high fixed-cost base (plant utilization, energy, sanitation/CIP, and refrigeration). Margins are often earned by controlling yield loss, moisture compliance, oxidation defects, and pack-format efficiency—not by “mystery markups.”

Data: Butter and AMF must meet compositional limits (fat/water/SNF) and sensory/defect expectations; AMF’s very low moisture is a stability requirement for storage and long-haul distribution [1].

Procurement Impact: Your total cost is most sensitive to (1) milkfat-to-butter yield economics, (2) conversion capacity and downtime risk, and (3) cold-chain and packaging choices that change handling loss and shelf-life risk.
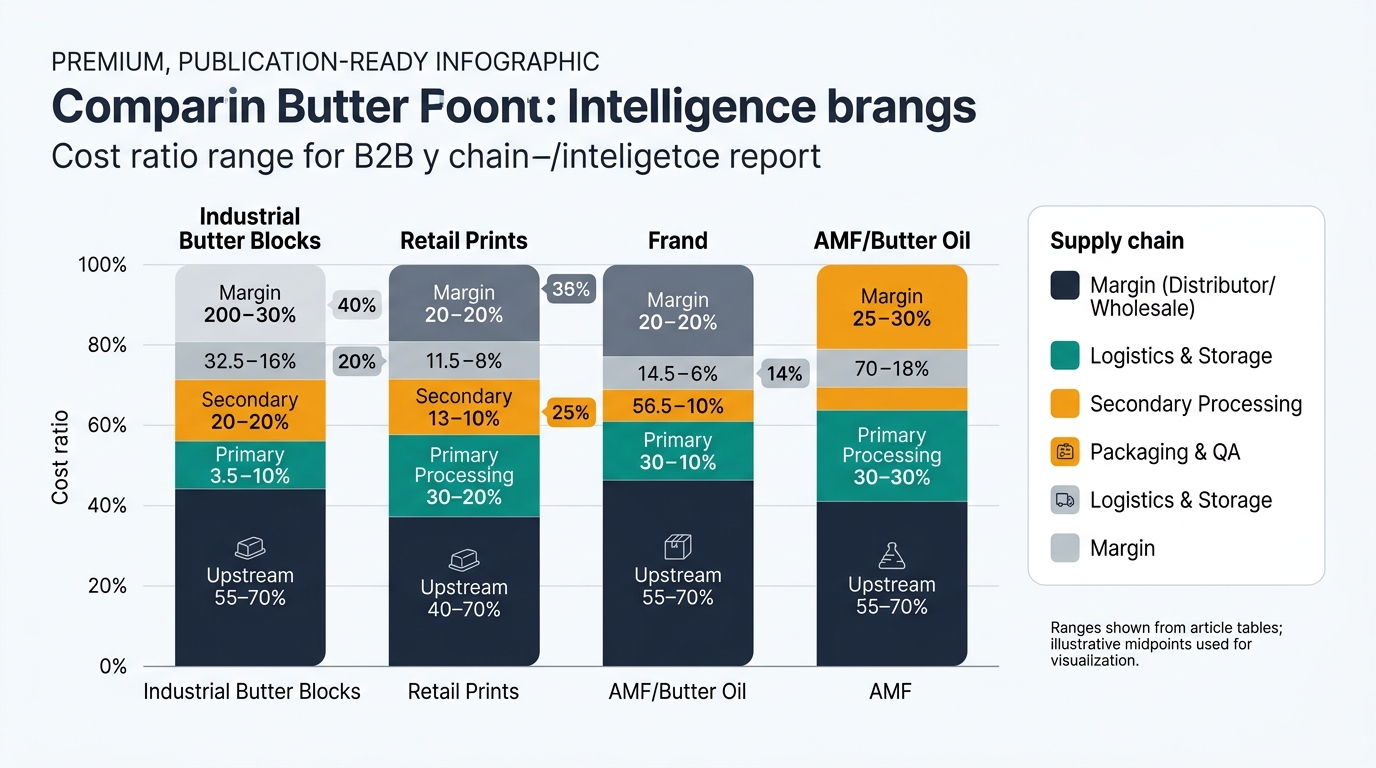
1. Upstream / Raw Material (Milk Collection → Cream Separation)

  • Insight: This node “creates” the butterfat stream; everything downstream is constrained by fat yield, microbial quality, and how consistently cream can be standardized.
  • Data: Butter is fundamentally a milkfat product (minimum 80% milkfat in finished butter); upstream variability in fat % and microbial load drives downstream losses (more rework, more downgrades, shorter shelf life) [1].
  • Procurement Impact: If your spec is tight (e.g., unsalted, flavor-sensitive industrial), upstream quality variance becomes a hidden cost via higher reject/rework rates and shorter usable life.
  • Fixed cost drivers: Milk testing (antibiotics/inhibitors), collection logistics, separators/centrifuges, cooling capacity, and sanitation.
  • Where margin leaks: Cream standardization losses, high bacteria counts leading to shorter shelf-life or flavor defects later.

2. Primary Processing (Cream Pasteurization, Aging/Tempering)

  • Insight: This is the “texture and flavor setup” step—fat crystallization behavior and flavor stability are strongly influenced by time/temperature history.
  • Data: Butter is a water-in-oil emulsion; controlling the fat crystal network requires controlled cooling/tempering and consistent pasteurization to reduce spoilage organisms that can drive off-flavors [1].
  • Procurement Impact: The same nominal butter spec can behave differently in your plant (plasticity, cutting, melt profile) depending on how cream was tempered—this is a physical performance risk, not a commercial one.
  • Fixed cost drivers: Pasteurizers, plate heat exchangers, refrigeration load, energy (heat + chill), holding tanks, and QA lab throughput.
  • Where margin leaks: Temperature excursions, insufficient control of aging/tempering that increases texture variability and downstream customer complaints.

3. Secondary Processing (Churning/Continuous Butter Making or AMF Concentration)

  • Insight: This is the highest “conversion” node: you either form butter grains and work them into a compliant emulsion, or you remove nearly all water/SNF to make AMF.
  • Data: Standards anchor the composition: butter commonly targets ≥80% milkfat and ≤16% water; AMF commonly targets ≥99.8% milkfat and ≤0.1% moisture—which requires dehydration/vacuum and tight process control [1].
  • Procurement Impact: This node drives the biggest swings in conversion cost per pound: plant utilization, line speed, and moisture control determine whether you get saleable product, rework, or downgrade.
  • Fixed cost drivers: Continuous butter makers/churns, vacuum dehydration (for AMF), CIP systems, skilled operators, and maintenance.
  • Where margin leaks: Off-spec moisture (too high → noncompliance; too low → yield loss), oxidation risk from air incorporation, and downtime that forces short runs.

4. Packaging & QA (Blocks/Prints/Portions, Coding, Metal Detection, Release)

  • Insight: Packaging format is not “just a box”—it changes labor content, line efficiency, and defect exposure (oxygen/light, seal integrity, temperature abuse).
  • Data: Butter’s water-in-oil structure and flavor are sensitive to oxidation and taints; QA release typically includes composition checks aligned to butter standards (fat and moisture compliance) and sensory/defect evaluation [1].
  • Procurement Impact: The same butter can have materially different cost-to-serve depending on pack format (bulk blocks vs prints vs portions) because packaging lines, changeovers, and inspection intensity scale nonlinearly.
  • Fixed cost drivers: Wrapping/form-fill-seal equipment, carton erection, coding/traceability, checkweighers, metal detection/X-ray (as applicable), and QA sampling.
  • Where margin leaks: Seal failures, coding/traceability holds, and rework from incorrect pack configuration.

5. Cold-Chain Logistics & Storage (Chilled/Frozen Butter; Ambient-ish AMF)

  • Insight: Butter is a refrigerated inventory business; storage temperature and time are part of the “process,” not an afterthought.
  • Data: Butter quality is temperature-history dependent; chilled/frozen distribution reduces texture drift and slows oxidation, while AMF’s very low moisture improves shipping efficiency but still requires protection from heat/light/oxygen to preserve flavor [3].
  • Procurement Impact: Landed cost is often dominated by refrigerated warehousing, reefer freight, and shrink (temperature excursions → texture defects → claims).
  • Fixed cost drivers: Cold storage fees, reefer trailers/containers, fuel/energy surcharges, monitoring (temperature loggers), and insurance.
  • Where margin leaks: Temperature excursions, long dwell times at docks, and partial loads that increase cost per pound.
Stacked bar chart comparing cost-to-serve ratio ranges by product format: Industrial Butter Blocks, Retail Prints, and AMF/Butter Oil. Each bar is segmented by supply chain node (Upstream/Raw Material, Primary Processing, Secondary Processing, Packaging & QA, Logistics & Storage, and Margin), sized using illustrative midpoints and annotated with the ranges from the article tables, with a legend and a note that midpoints are used for visualization.

Product-Level Cost Breakdown

A) Industrial Butter (25 kg / 50 lb blocks; chilled/frozen)

Supply Chain Node Cost Ratio (% of Final Cost) Notes
Upstream / Raw Material (milk → cream) 55–70% Milkfat value dominates; yield and quality set the baseline.
Primary Processing (pasteurize/temper) 4–7% Energy + refrigeration + QA throughput.
Secondary Processing (butter making) 6–10% Conversion labor, CIP, utilization, moisture control losses.
Packaging & QA 4–8% Blocks are efficient but still sensitive to coding/traceability holds.
Cold-chain logistics & storage 6–12% Reefer freight + cold storage + shrink/claims risk.
Distributor/wholesale margin 5–12% Varies by channel and service requirements.

B) Retail Prints (sticks/wrapped; high SKU complexity)

Supply Chain Node Cost Ratio (% of Final Cost) Notes
Upstream / Raw Material (milk → cream) 40–60% Still dominant, but packaging and retail margin rise sharply.
Primary Processing (pasteurize/temper) 3–6% Similar physics; tighter sensory expectations often increase QA.
Secondary Processing (butter making) 5–9% Conversion cost similar, but smaller runs can hurt utilization.
Packaging & QA 10–18% Wraps/cartons, frequent changeovers, higher inspection intensity.
Cold-chain logistics & storage 6–12% More handling points increase temperature-excursion exposure.
Retail/brand margin 10–25% Marketing, slotting, and retailer markup dominate.

C) Anhydrous Milk Fat (AMF) / Butter Oil (drums/IBC)

Supply Chain Node Cost Ratio (% of Final Cost) Notes
Upstream / Raw Material (milk → cream/butter feedstock) 70–85% Nearly pure fat product; raw fat economics dominate.
Primary Processing (pasteurize/condition) 2–5% Conditioning before concentration; energy and QA.
Secondary Processing (concentration/dehydration) 5–10% Must achieve very low moisture (≤0.1%) for typical AMF specs [4].
Packaging & QA 2–5% Drums/liners; oxygen/light control matters for flavor stability.
Logistics & storage 3–8% Better freight per unit of fat than butter, but heat exposure still a risk.
Distributor/wholesale margin 3–8% Often lower than retail butter channels.
Sourcing Window Radar
Processed Butter — Global Harvest Calendar
FRANCE SEASON ACTIVE
🇫🇷 France
APR — OCT
🇳🇿 New Zeala.
APR — OCT
🇮🇪 Ireland
AUG — OCT
🇮🇳 India
APR — OCT
🇺🇸 United St.
AUG — OCT
JanFebMarAprMayJunJulAugSepOctNovDec

3) Structural Realities Every Butter Buyer Inherits (Whether You Like It or Not)

Insight: Butter supply chains are structurally constrained by biology (milk seasonality), concentrated conversion assets (plants), and cold-chain physics (temperature history). These realities don’t disappear in “normal” markets.

Reality 1: Butter is defined by composition limits—moisture control is a yield lever and a compliance risk

  • Insight: Moisture is simultaneously a legal/spec limit and a cost lever: too high is noncompliant; too low is lost yield.
  • Data: Codex-aligned definitions commonly reference ≤16% water and ≥80% milkfat for butter; U.S. requirements also anchor butter at ≥80% milkfat [1].
  • Procurement Impact: Moisture control capability is a supplier “hard skill.” It affects both conformance risk and effective cost per pound of butterfat delivered.

Reality 2: Processing capacity and sanitation time create practical minimum run sizes

  • Insight: Butter/AMF lines are high-CIP, high-uptime assets; frequent changeovers (salted/unsalted, allergen adjacency, pack format shifts) reduce throughput.
  • Data: Butter manufacturing is designed around hygienic operation and repeated cleaning-in-place cycles; the chain is engineered for long, stable runs rather than constant SKU switching [1].
  • Procurement Impact: If you need many SKUs or small lots, you are buying not only butter but also line time and changeover capacity.

Reality 3: Cold-chain isn’t just freight—it’s product quality control

  • Insight: Butter texture and flavor are temperature-history dependent; a “perfect” butter leaving the plant can become a claims problem after one warm dock.
  • Data: Butter’s fat crystal structure and oxidative stability are sensitive to storage and handling conditions; temperature abuse can show up later as texture defects and flavor deterioration [3].
  • Procurement Impact: Lane design (dwell time, cross-docks, last-mile handling) is a technical quality variable that shows up later as brittleness, oiling-off, or sensory complaints.

Key Insights (What You Should Remember When You Look at Any Butter Supply Chain)

  • Insight: Butter is a short chain with long consequences: upstream fat quality, midstream conversion control, and downstream cold-chain discipline determine whether you get compliant, functional butter—or rework and claims.
  • Data: Composition standards anchor the physics: butter typically ≥80% milkfat and ≤16% water, while AMF is typically ≥99.8% milkfat and ≤0.1% moisture, which changes processing intensity and logistics economics [1].
  • Procurement Impact: Your most important “technical levers” are (1) moisture control capability, (2) conversion line utilization and changeover burden, and (3) cold-chain integrity from dock to dock.

Key Takeaways: Moisture compliance is both a quality requirement and a yield driver; packaging format can rival conversion cost in retail; and cold-chain failures often masquerade as “supplier quality” issues.

4) The Bottom Line for Your Next Contract

(Analyzed at: Apr, 2026)

Lock in a two-part commercial structure: (1) an index-linked price component tied to a transparent butter/butterfat reference, and (2) a separately negotiated capacity-and-service addendum that hard-codes pack-format line time, changeover expectations, and cold-chain controls (temp logging, max dock dwell, claim rules). This works because 2026 pricing has shown meaningful volatility while operational constraints (eligible inventory dynamics, cold storage tightness, and packaging/logistics bottlenecks) can still create “allocation outcomes” even when the headline price looks favorable. Teams that separate commodity value from cost-to-serve typically protect on the order of ~1–3% of landed cost through fewer holds, fewer shorts, and fewer temperature-history claims—without pretending they can outsmart the market [2].

Unlock Full Data
Processed Butter Market Intelligence
Prices · Trends · Origins · Forecasts

References

  1. dairyprocessinghandbook.tetrapak.com
  2. marketing.highgrounddairy.com
  3. cdr.wisc.edu
  4. adpi.org
Subscribe
By subscribing you agree to with our Privacy Policy and provide consent to receive updates from our company.
Thank you! Your submission has been received!
Oops! Something went wrong while submitting the form.
Subscribe to receive the latest blog posts, updates, promotions, and announcements from Tridge.