INDUSTRY TRENDS

Plum Puree Supply Chain Map for Procurement (Quality/Safety/Compliance): Flow, Specs, and Cost Drivers

Author
Team Tridge
DATE
September 4, 2026
8 min read
plum-puree Cover
Unlock Full Data
Plum Puree Market Intelligence
Prices · Trends · Origins · Forecasts

Plum puree looks like a simple ingredient, but it is a “campaign-manufactured” product where quality and cost-to-serve are largely determined by (a) how fast perishable fruit can be converted during a short harvest window and (b) whether you choose an aseptic (ambient) or frozen (cold-chain) format. This guide maps the physical flow, the real failure modes, and the procurement levers that prevent holds, claims, and late-stage compliance surprises.

Executive Summary

  • Cost locks in at three points: orchard yield/harvest labor, plant throughput during peak weeks, and format choice (aseptic packaging integrity vs frozen cold-chain continuity).
  • Specs are mostly “manufactured,” not inherent: Brix/pH/color/particles are typically achieved via refining, blending, and thermal processing; tighter tolerances can reduce effective capacity.
  • Format drives QA controls: aseptic concentrates risk in sterility + bag/drum integrity; frozen concentrates risk in time–temperature abuse and dock discipline.
  • Reality-check on specs: industry references commonly show single-strength plum puree minimum ~12 °Brix and pH ~2.8–4.1 (varies by product and buyer). [1]
  • 2026 logistics note: refrigerated freight has remained comparatively strong/volatile; frozen programs should assume higher exposure to reefer capacity/rate swings than aseptic. [2]

1) How Plum Puree Physically Moves—and Where Costs “Lock In”

Plum puree is a seasonal, orchard-driven raw material converted into a shelf-stable (aseptic) or cold-chain (frozen) ingredient through a short but capital- and QA-intensive processing window. Most cost is structurally “locked in” at three points: (1) harvest labor and yield at orchard, (2) pitting/refining + thermal treatment capacity at the plant during peak weeks, and (3) packaging integrity (aseptic bags/drums) or cold-chain energy/storage (frozen).

Insight

The chain is built to convert a highly perishable fruit into an industrially consistent input by using time-sensitive processing capacity and controlled packaging formats.

Data

Typical physical flow: orchard harvest → rapid intake/receiving → wash/sort → pit/destone → crush/heat → refine/standardize (Brix/pH/color) → pasteurize/UHT → aseptic drum/BIB or freeze → ambient containerized export (aseptic) or reefer + cold storage (frozen).

Procurement Impact

Your “true” supply risk and cost-to-serve are determined less by the puree itself and more by how fast fruit can be processed at origin, and whether the finished format depends on sterile packaging or continuous cold chain.
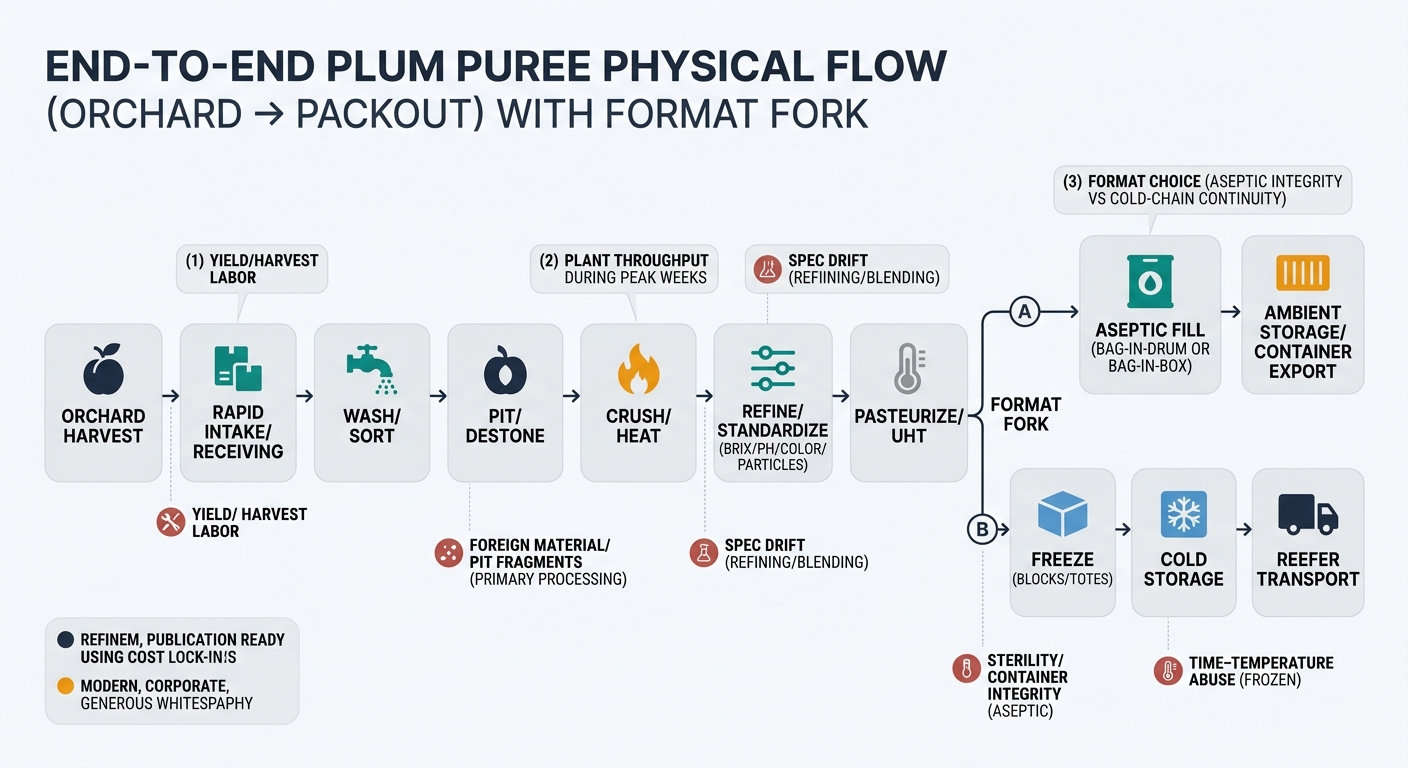
A left-to-right supply chain flow showing: Orchard Harvest → Rapid Intake/Receiving → Wash/Sort → Pit/Destone → Crush/Heat → Refine/Standardize (Brix/pH/color/particles) → Pasteurize/UHT → format fork to (A) aseptic fill (bag-in-drum or bag-in-box) → ambient storage/container export or (B) freeze (blocks/totes) → cold storage → reefer transport, with callouts for three cost lock-in points and icons for key failure modes (foreign material/pit fragments, spec drift, sterility/container integrity, time–temperature abuse).

2) Where Value Accumulates: Cost & Margin Structure by Supply Chain Node

Insight: Plum puree is a yield- and throughput-driven ingredient: every node has a measurable loss mechanism (fruit defects, pit/skin removal, evaporation, sterility failures, temperature abuse) that turns into fixed cost per kg.

Data: The highest structural cost drivers are (a) labor + yield at harvest, (b) plant uptime and line utilization during a short harvest window, (c) energy for thermal processing/freezing, and (d) packaging materials (aseptic) or storage/reefer (frozen).

Procurement Impact: Expect node-to-node cost pass-through to show up as: tighter availability during harvest peaks, higher minimum order quantities (MOQs) for aseptic runs, and higher working-capital burden for frozen inventory.

1. Upstream / Raw Material (Orchards + Harvest)

  • Insight: Farm economics are dominated by labor availability and yield variability; processors pay for “processable” fruit, but still absorb defect and rot risk.
  • Data: Key cost drivers are hand labor (picking, sorting), irrigation/water, crop protection, and yield loss from weather (frost/hail/heat/rain at harvest). Fruit can be diverted between fresh and processing channels, changing what reaches processors.
  • Procurement Impact: The physical constraint here is not just acreage—it’s harvest execution. In short-crop years, puree plants compete for fruit and may run shorter campaigns, tightening downstream availability regardless of your spec.

2. Primary Processing (Receiving → Washing/Sorting → Pitting/Destoning → Pulp)

  • Insight: This is the first major “loss node”: pits, skins, and defect removal determine conversion yield and foreign-material risk.
  • Data: Cost concentrates in high-throughput equipment (washers, destoners/pitters), water + wastewater treatment, labor for sorting, and downtime risk from clogging/fruit variability. Foreign material control (stones, pit fragments, metal) is structurally tied to receiving quality and pitting performance.
  • Procurement Impact: If you run sensitive applications (baby food, dairy fruit prep), your downstream hold/release risk often traces back to this node’s sorting rigor and pit-fragment control—not to later thermal steps.

3. Secondary Processing (Refining + Standardization + Thermal Treatment)

  • Insight: “Puree” is manufactured consistency: refiners, blending, and thermal processing convert variable fruit into a spec-defined ingredient.
  • Data: Main cost drivers: sieving/refining to particle-size targets, blending lots to hit Brix/pH/color, deaeration to reduce oxidation, and pasteurization or UHT. Energy (steam/electricity) and line utilization drive unit cost; any process deviation can force rework or downgrade.
  • Procurement Impact: Specs that demand tight particle size, low skin/seed tolerance, and narrow Brix windows increase rework/blending needs and reduce effective capacity—especially during peak harvest weeks.

4. Packaging & QA Release (Aseptic Drums/BIB vs Frozen Blocks/Totes)

  • Insight: Packaging format is a structural fork: aseptic shifts risk to sterility and packaging materials; frozen shifts risk to energy, storage, and temperature control.
  • Data: Aseptic requires validated sterile barriers (bag integrity, filler sterility, seals) and drives costs in aseptic bags/liners, drums, filler maintenance, and QA verification. FDA inspection guidance for aseptic systems emphasizes documentation and attention to container integrity issues; release practices commonly include record review and integrity-focused checks. [3] Frozen adds blast/freezing energy, cold storage, and higher handling cost; temperature fluctuations (melt–refreeze “heat shock”) are a known driver of quality loss, including drip loss and texture degradation upon thaw. [4]
  • Procurement Impact: Your cost-to-serve is often decided here: aseptic minimizes downstream warehousing and freight complexity but raises “single-lot write-off” exposure if sterility fails; frozen reduces sterility dependence but increases working capital and logistics fragility.

5. Logistics & Distribution (Ambient Containers vs Reefer + Cold Storage)

  • Insight: Finished puree logistics are packaging-driven: aseptic is optimized for ambient container flow; frozen is optimized for continuous cold chain.
  • Data: Aseptic typically ships ambient (palletized drums or bag-in-box), with costs in containers, inland drayage, handling, and transit time variability. Frozen adds reefer equipment, cold storage at origin/destination, energy surcharges, and higher insurance exposure.
  • Procurement Impact: Receiving operations must match format: aseptic needs controlled storage conditions and packaging inspection; frozen needs dock discipline, temperature verification, and sufficient cold storage capacity to avoid “warm-up” quality defects.
Comparative stacked bar chart with three side-by-side bars (Aseptic Single-Strength, Frozen Puree, Concentrate) segmented by supply chain nodes (Upstream Raw Fruit, Primary Processing, Secondary Processing, Packaging & QA or Freezing + Cold Storage, Logistics & Distribution, Distributor/Importer Margin), showing midpoint values with subtle min–max ranges and an annotation explaining how format shifts cost exposure.

Product-Level Cost Breakdown

A) Aseptic Plum Puree (Single-Strength, Industrial)

Supply Chain Node Cost Ratio (% of Final Cost) Notes
Upstream Raw Fruit (farm + harvest) 35–45% Yield and harvest labor set the base cost.
Primary Processing (wash/sort/pit) 10–15% Water/wastewater + pitting throughput + defect removal losses.
Secondary Processing (refine + thermal) 12–18% Energy + blending/standardization + line utilization.
Packaging & QA (aseptic bags/drums) 12–20% Aseptic packaging materials and sterility assurance dominate.
Logistics & Distribution (ambient) 8–15% Container/inland freight + handling; less than frozen on average.
Distributor/Importer Margin (where applicable) 5–12% Depends on channel and services (inventory, financing).

B) Frozen Plum Puree (Blocks/Totes)

Supply Chain Node Cost Ratio (% of Final Cost) Notes
Upstream Raw Fruit (farm + harvest) 35–45% Similar base exposure to yield/labor.
Primary Processing (wash/sort/pit) 10–15% Same loss mechanics as aseptic.
Secondary Processing (refine + thermal) 8–14% Often less UHT intensity than aseptic, but still energy-driven.
Freezing + Cold Storage (pack & hold) 12–22% Blast/freezing energy + storage time are structural costs.
Logistics & Distribution (reefer) 12–20% Reefer freight, cold-chain handling, and temperature-risk buffers.
Distributor/Importer Margin (where applicable) 5–12% Higher if inventory holding is provided.

C) Plum Puree Concentrate (Higher Brix Stream)

Supply Chain Node Cost Ratio (% of Final Cost) Notes
Upstream Raw Fruit (farm + harvest) 30–40% More fruit input per kg finished, but freight per solids improves.
Primary Processing (wash/sort/pit) 8–12% Similar mechanics; yield losses still apply.
Concentration (evaporation) 18–28% Energy-intensive; equipment utilization matters.
Packaging & QA (often aseptic) 10–18% Aseptic common for export stability.
Logistics & Distribution 6–12% Lower per-unit freight vs single-strength due to higher solids.
Distributor/Importer Margin (where applicable) 5–12% Channel-dependent.
Sourcing Window Radar
Plum Puree — Global Harvest Calendar
MEXICO SEASON ACTIVE
🇲🇽 Mexico
FEB — DEC
🇨🇷 Costa Rica
JAN — OCT
🇨🇱 Chile
FEB — NOV
🇫🇷 France
JAN — DEC
🇺🇸 United St.
SEP — NOV
JanFebMarAprMayJunJulAugSepOctNovDec

3) Structural Facts That Don’t Change (and Why They Matter)

Insight: Plum puree behaves like a “campaign-manufactured” ingredient: the orchard and the plant must synchronize in a narrow time window, and the format you choose determines the long tail of cost and risk.

Data: Three structural realities shape availability, consistency, and downstream QA workload.

Procurement Impact: These are the constraints that drive holds, claims, and rework—independent of supplier promises.

Processing capacity is seasonal and multi-fruit shared

Data: Many plants run several fruit lines (stone fruit, apple/pear). During peak harvest, line time is allocated to the highest-throughput or highest-margin fruit streams, and any downtime (equipment, sanitation, sterility) is extremely expensive because fruit is perishable.

Procurement Impact: In constrained seasons, even “approved” suppliers may ration capacity across customers or shift pack schedules, affecting lot timing and consistency.

Format choice creates different “catastrophic failure modes”

Data: Aseptic processing depends on maintaining commercial sterility through thermal treatment + sterile packaging + sterile filling environment, and regulators focus on documentation and container integrity issues as key risk points. [3] Frozen quality is highly sensitive to temperature fluctuations that accelerate recrystallization and drip loss on thaw, even when microbiological risk is controlled by low temperature. [4]

Procurement Impact: Your incoming inspection and storage SOPs should mirror the failure mode: packaging integrity checks and retain/hold logic for aseptic; temperature mapping and strict dock handling for frozen.

Spec compliance is largely manufactured via blending and refining—not inherent in the fruit

Data: Brix and pH targets for plum puree are commonly specified by buyers; as a reference point, USDA’s aseptic fruit puree specs list plum (prune) minimum single-strength 12.0 °Brix with pH range 2.8–4.1, and commercial spec sheets show similar ranges depending on product style. [1]

Procurement Impact: When you see repeated out-of-spec on color/viscosity/particles, the root cause is often upstream variability plus insufficient blending/refining capacity—not “random quality.”

Key Insights (What to Remember When You Look at Any Plum Puree Source)

  • Insight: The supply chain is short, but the constraints are hard.
    Data: Costs structurally concentrate at harvest yield, pitting/refining throughput, thermal energy, and packaging/cold chain—each with a distinct loss mechanism.
    Procurement Impact: Most downstream disruptions (holds, claims, urgent substitutions) trace to one of four physical issues: fruit quality at intake, pit/foreign material control, format-specific integrity (aseptic vs frozen), or logistics handling discipline.
  • Insight: “Same spec” does not guarantee “same behavior” in application.
    Data: Varietal/origin differences and campaign blending practices can meet Brix/pH yet shift color, acidity perception, and viscosity.
    Procurement Impact: Expect application variability unless the chain has enough blending and standardization capacity—and unless your spec includes the right physical attributes (particle size distribution, viscosity targets, color metrics).

The Bottom Line for Your Next Contract

(Analyzed at: Sep, 2026)

If you buy frozen plum puree, treat cold-chain continuity as a contracted control—not a logistics afterthought: require time–temperature evidence at handoffs (origin cold store → carrier → receiving), and write explicit reject/claim rules for temperature excursions. This works because frozen puree quality loss accelerates under temperature fluctuations (melt–refreeze drives recrystallization and drip loss), and 2026 refrigerated capacity/rate volatility increases the odds of non-ideal transit conditions. [4]

What’s at stake is not just freight: one warm event can cascade into texture defects, line disruption, and claims that easily reach high single digits of annual puree cost-to-serve—especially when you’re forced into emergency substitutions under time pressure.

Plum PureeSupply Chain Intelligence
141 countries tracked
10
Exporters
10
Importers
$355M
Top Export Value
Top Exporters (2024)
🇹🇷
Turkey
$355M
🇮🇹
Italy
$315M
🇧🇪
Belgium
$255M
🇩🇪
Germany
$172M
🇳🇱
Netherlands
$151M
+136 more
Top Buyers
🇺🇸 United States $626M🇩🇪 Germany $390M🇨🇦 Canada $188M🇬🇧 United Kingdom $150M🇳🇱 Netherlands $144M

References

  1. ams.usda.gov
  2. actresearch.net
  3. fda.gov
  4. sciencedirect.com

Related Contents

Subscribe
→
By subscribing you agree to with our Privacy Policy and provide consent to receive updates from our company.
Thank you! Your submission has been received!
Oops! Something went wrong while submitting the form.
Subscribe to receive the latest blog posts, updates, promotions, and announcements from Tridge.