INDUSTRY TRENDS

Peanut Butter Spread Sourcing (2026): Managing Cost Volatility, Aflatoxin Compliance, and Packaging Constraints

Author
Team Tridge
DATE
April 15, 2026
10 min read
peanut-butter-spread Cover
Tridge Eye Data Intelligence Solution

This report is powered by Tridge Eye Data Intelligence.

Every data point, price signal, and supply risk insight in this analysis comes from the same platform that procurement and sourcing leaders worldwide rely on daily. As you read, consider what this level of market intelligence could do for your sourcing decisions.

Explore Tridge Eye →

Peanut butter spread looks simple from the outside—“just peanuts.” For procurement leadership, it behaves more like a multi-constraint category where compliance (aflatoxin), capacity (roast/grind/fill), and packaging (jars/lids/labels) decide whether product ships on time and within spec. This guide translates those realities into management-grade decisions: where to dual-source, how to structure contracts, what to monitor, and which KPIs actually predict continuity.

Executive Summary

  • Continuity is gated by a chain of constraints: compliant peanuts + available line time + the right jar/lid/label + QA release capacity must align in the same window.
  • Aflatoxin compliance is market-specific: the EU commonly applies 2 μg/kg (AFB1) and 4 μg/kg (total) for groundnuts intended for direct human consumption, which can be materially tighter than U.S. commonly referenced 20 ppb action level for peanuts and peanut products.
  • “Kernel price down” does not guarantee “delivered spread cost down” because effective cost is driven by (1) compliance yield loss, (2) capacity premiums, (3) packaging constraints, and (4) contract/inventory timing.
  • Packaging is a frequent hidden bottleneck: jar/lid/induction seal/label lead times and MOQs can stop shipments even when ingredients are available.
  • Governance matters: the 2022 Jif-linked Salmonella outbreak and recall illustrates how a single facility-level food safety issue can become a continuity and reputational event.
  • Most practical KPI set (management altitude): OTIF by pack format, quality incident rate, aflatoxin nonconformance/diversion rate, and cost variance split (kernels vs conversion vs packaging vs freight).

Key Insights

Analyzed at: Apr, 2026

  • Strategy: Hold
  • Reliability: Medium
  • Potential Saving: 4% ~ 10%
  • Insight: If you are buying finished goods or paste tied to U.S.-origin peanuts, the near-term opportunity is less about “timing the peanut commodity” and more about capturing cost-to-serve savings: (1) lock or de-risk packaging (jars/lids/seals/labels) with alternates and safety stock policy, (2) renegotiate capacity and changeover terms (line reservation, surge rates, sanitation downtime assumptions), and (3) tighten market-specific aflatoxin governance so you pay for compliance intentionally (sampling plans, disposition pathways) rather than through emergency premiums and yield surprises. This is a “Hold” (not “Strong Buy”) because savings are real but depend heavily on your current contract structure, pack formats, and whether you already have packaging alternates pre-approved.

1) The “Real” Peanut Butter Spread Supply Chain (What Actually Breaks)

Most procurement teams think peanut butter spread is a single-ingredient category (peanuts) with a simple conversion cost. In practice, it’s a multi-constraint system where supply continuity is gated by:

  • Food safety compliance (especially aflatoxin control and allergen segregation)
  • Processing capacity (shelling/sorting/roasting/grinding/filling; sanitation downtime)
  • Packaging availability (jars, lids, induction seals, labels, corrugate)
  • Spec governance (oil separation tolerance, particle size/texture, sugar/salt profile, “natural” vs stabilized)

Ground-truth flow (what you’re really buying)

  1. Upstream / Raw peanuts
  2. In-shell → shelled kernels (edible grades) + off-grade streams
  3. Primary processing
  4. Cleaning, shelling, grading, optical sorting
  5. Blanching (optional), roasting (dry/oil), microbiological controls
  6. Secondary manufacturing
  7. Grinding to paste, mixing with salt/sweeteners/oils/emulsifiers (if stabilized)
  8. De-aeration, viscosity/texture control, allergen cleaning/changeovers
  9. Packaging & QA
  10. Filling, sealing, coding, metal detection/X-ray, net-weight control
  11. Release testing (incl. aflatoxin sampling plans, micro, sensory)
  12. Logistics & distribution
  13. Ambient warehousing; heat exposure risks quality drift
  14. End markets
  15. Retail (branded/private label), foodservice, industrial bulk

Procurement implication: Your continuity risk is rarely “peanuts unavailable.” It’s more often “compliant peanuts + available line time + the right jar/lid + release testing capacity” all aligning in the same window.

A left-to-right flow diagram that shows the real gating logic for continuity. Include stages: (1) Compliant peanuts (aflatoxin-controlled lots) → (2) Primary processing (shell/sort/blanch/roast) → (3) Secondary manufacturing (grind/formulate) → (4) Packaging availability (jar/lid/induction seal/label/corrugate) → (5) QA release capacity/testing turnaround → (6) Ship/Distribution. Overlay a bold 'AND' gate concept: product ships only when compliant peanuts + available line time + correct packaging + QA release align in the same window. Add small callouts for common breakpoints: aflatoxin nonconformance/diversion, sanitation/changeover downtime, packaging MOQ/lead time, QA hold time.

2) Where the Money Accumulates (Cost & Margin by Node)

Below is a management-grade view of where cost and margin tend to stack—not as accounting truth, but as a practical map for negotiation posture and risk trade-offs.

2.1 Upstream / Raw Material (Farming + first-market kernels)

Key insight: In peanut butter spreads, kernel cost volatility is often the biggest P&L driver, but the food-grade compliant premium can become the swing factor when aflatoxin risk rises (because rejects/diversion increase effective cost per compliant pound).

Cost drivers

  • Yield variability (drought/heat; harvest rain)
  • Drying/curing and storage losses
  • Local basis and carryover stocks (inventory overhang can depress price even when quality is mixed)

Margin reality

  • Fragmented farm base → margins distributed; price formation often happens at sheller/handler level

2.2 Primary Processing (Shelling, sorting, blanching, roasting)

Key insight: This node is where food safety compliance becomes a cost function—sampling density, rejects, and rework can materially change effective yield.

Cost drivers

  • Optical sorting + aflatoxin sampling plans (more testing when risk is elevated)
  • Reject rates (aflatoxin/foreign material) → yield loss
  • Energy for roasting; labor for QA and segregation

Margin reality

  • Processors monetize capability: consistent roast profile, tight defect specs, documented controls

2.3 Secondary Manufacturing (Grinding, formulation, filling readiness)

Key insight: “Same peanut butter” is not the same operationally. Natural vs stabilized, crunchy vs smooth, and sugar/salt profiles change line rates, sanitation time, and rework risk.

Cost drivers

  • Changeovers + allergen cleaning (especially in co-manufacturing environments)
  • Added oils/emulsifiers (stabilized SKUs)
  • Viscosity/texture control and scrap/rework

Margin reality

  • Co-manufacturers price in scheduling complexity and service-level penalties

2.4 Packaging & Quality Assurance (the hidden gating item)

Key insight: Packaging is often the constraint that turns a peanut event into a customer-service event. Even when ingredients are available, the wrong jar, lid, or label can stop shipments.

Cost drivers

  • Jar/lid/induction seal availability and minimum order quantities
  • QA release testing turnaround time
  • Label compliance changes (allergen statements, claims)

Packaging format changes are rarely 1:1 substitutes; tooling, line settings, performance, and consumer expectations create friction. In many programs, glass also carries longer and less flexible supply/transport dynamics than plastic—validate by your specific jar finish/closure and decoration method.

2.5 Logistics & Distribution

Key insight: Peanut butter is “ambient,” but not “risk-free.” Heat exposure accelerates oil separation and rancidity, which can turn into customer complaints and returns.

Cost drivers

  • Warehousing, inland freight, export container availability (for international programs)
  • Inventory carrying cost (especially when buyers build buffers)

2.6 End Market Margin Stack (importer/distributor/retail)

Key insight: Retail pricing often lags kernel cost moves due to inventory and promo calendars; procurement gets squeezed when input costs move faster than shelf price resets.

A 3-bar stacked chart comparing cost ratios (% of final delivered cost) across: A) Retail Private Label (stabilized, 16–18 oz), B) Natural Peanut Butter, C) Industrial Bulk Peanut Paste. Each bar segmented into: Raw peanuts, Primary processing, Secondary manufacturing, Packaging & QA, Logistics & distribution, Manufacturer margin & overhead. Use the article’s modeled percentages (A: 35/12/15/18/8/12; B: 40/13/12/18/7/10; C: 50/15/18/7/5/5). Add a small annotation emphasizing 'Packaging & QA is a frequent hidden bottleneck' and 'Raw material dominates bulk'.

Product-level cost breakdown (illustrative, modeled)

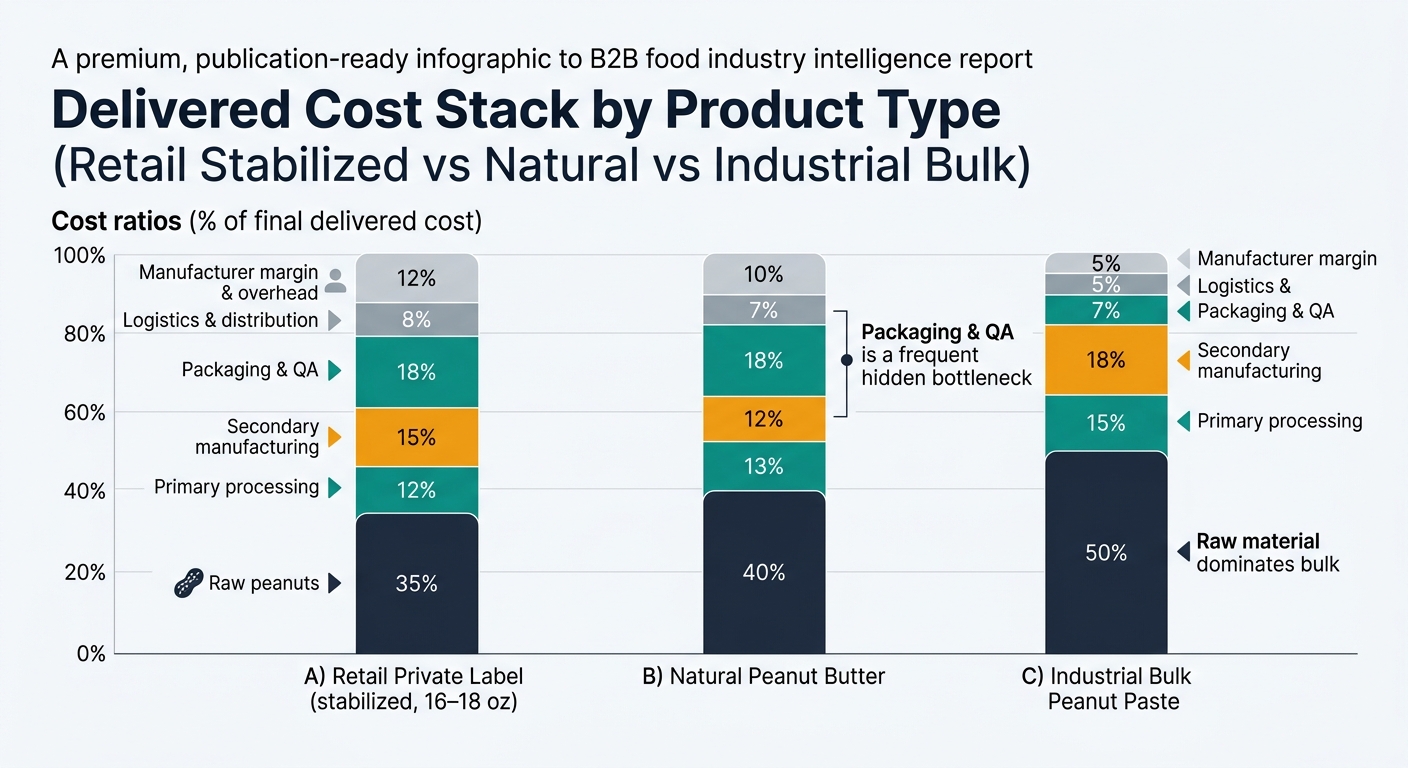
Percentages below are approximate shares of final delivered cost to the buyer (retail-ready or bulk-delivered). Actual ratios vary by origin, contract structure, pack format, and whether you’re buying branded, private label, or industrial.

A) Retail Private Label Peanut Butter (16–18 oz jar, stabilized)

Supply Chain Node Cost Ratio (% of Final Cost) Notes
Raw peanuts (kernels equivalent) 35% Dominant driver; quality/compliance premium can widen in aflatoxin years
Primary processing 12% Sorting/roasting energy + QA; yield loss matters
Secondary manufacturing 15% Mixing + changeovers + line efficiency
Packaging & QA 18% Jar/lid/label/corrugate + release testing
Logistics & distribution 8% Ambient freight + warehousing
Manufacturer margin + overhead 12% Co-man or plant overhead allocation

B) “Natural” Peanut Butter (no stabilizers; higher separation risk)

Supply Chain Node Cost Ratio (% of Final Cost) Notes
Raw peanuts 40% Higher peanut content; tighter flavor consistency expectations
Primary processing 13% Roast profile consistency is critical
Secondary manufacturing 12% Fewer additives, but tighter process control to manage separation
Packaging & QA 18% Packaging still heavy; QA may include more sensory/texture checks
Logistics & distribution 7% Heat exposure risk increases complaints/returns
Manufacturer margin + overhead 10% Often offset by lower additive cost but higher quality risk

C) Industrial Bulk Peanut Paste (pails/drums; ingredient for other foods)

Supply Chain Node Cost Ratio (% of Final Cost) Notes
Raw peanuts 50% Input dominates; buyers often index or benchmark tightly
Primary processing 15% Sorting/roasting/QA heavy
Secondary manufacturing 18% Grinding + viscosity/particle size control
Packaging & QA 7% Bulk packs cheaper per lb
Logistics & distribution 5% Typically pallet bulk
Manufacturer margin + overhead 5% More commoditized; margin pressure higher

3) The Structural Fact You Can’t Negotiate Away: Compliance Standards Diverge by Market

If you source globally (or sell into multiple regions), the same lot of peanuts can be acceptable in one market and rejected in another.

  • The EU sets strict maximum levels for aflatoxins in groundnuts (peanuts) intended for direct human consumption (commonly referenced as 2 μg/kg for aflatoxin B1 and 4 μg/kg for total aflatoxins in the relevant category tables).
  • U.S. FDA commonly referenced action level for peanuts and peanut products is 20 ppb.

Procurement implication: “Aflatoxin compliant” is not a binary claim. You need:

  • Market-specific limits (EU vs U.S. vs others)
  • Sampling plans and COA governance
  • Clear disposition rules (rework, diversion to crushing, rejection)

Avoid stating “U.S. guidance allows a higher allowance for raw peanuts under certain programs” unless you can cite the exact program and limit you are using internally. In practice, procurement should treat 20 ppb as the widely used action level reference for food and build governance around destination market requirements and your brand/customer risk appetite.

4) The Critical Insight: Why Peanut Prices and Your Delivered Spread Cost Often Disconnect

Procurement teams expect a simple relationship: kernel price down → peanut butter cost down. In practice, the relationship breaks for four repeatable reasons:

  1. Compliance yield loss is nonlinear
  2. Aflatoxin risk doesn’t just add a testing fee; it increases rejects and rework, raising effective cost per compliant pound.
  3. Capacity and scheduling create shadow premiums
  4. When roasting/grinding/filling capacity is tight, suppliers charge for line time and service-level risk—even if kernels are cheap.
  5. Packaging can dominate the short-term constraint
  6. A jar/lid disruption can force spot buys, substitutions, or expedited freight.
  7. Contracting and inventory lags mask commodity moves
  8. Many manufacturers carry inventory and price on quarterly/annual cycles; your cost reduction timing depends on contract structure, not just market price.

Management takeaway: If you only track peanut kernel prices, you’ll miss the real drivers of variance: compliance premium, capacity premium, packaging premium, and contract lag.

5) Where Procurement Teams Typically Get This Wrong (and Pay for It)

  1. Treating “peanuts” as the only critical input
  2. Result: you dual-source kernels but remain single-threaded on jars, lids, or a co-man line.
  3. Using generic supplier scorecards that ignore food safety realities
  4. Result: you optimize for price/OTIF but underweight aflatoxin controls, allergen segregation, and audit history.
  5. Late qualification of alternates
  6. Result: you qualify under crisis timelines, accept spec drift, or pay emergency premiums.
  7. Spec changes without governance
  8. Result: oil separation complaints, label noncompliance, or customer rejections.

A real-world reminder: the May 2022 Jif peanut butter Salmonella outbreak triggered a major recall and broad downstream disruption, illustrating how a single facility-level food safety issue becomes a supply continuity and reputational event.

6) What an Intelligence-Driven Approach Changes (Decisions, Not Dashboards)

This is how procurement intelligence changes outcomes in peanut butter spreads—by improving decision quality under real constraints.

6.1 Supplier discovery & benchmarking (to design dual-source correctly)

Decisions supported

  • Where to dual-source: kernels vs roasted pieces vs paste vs finished goods
  • Which suppliers are true alternates (capability + compliance), not just “same HS code”

What to benchmark (category-specific)

  • Aflatoxin control signals: sampling rigor, disposition pathways, audit cadence
  • Allergen segregation and sanitation downtime practices
  • Roasting/grinding/filling capacity signals and changeover flexibility
  • Packaging format compatibility (jar types, closures, label application)

Measurable outcomes

  • Reduced expedited freight and fewer line stoppages
  • Higher OTIF during disruption windows

6.2 Price intelligence & driver decomposition (to negotiate without increasing failure risk)

Decisions supported

  • Fixed vs indexed vs laddered contracts (and what index actually tracks your exposure)
  • When to lock packaging vs ingredient pricing

Practical approach

  • Split should-cost into: kernels + compliance yield loss + conversion + packaging + freight + margin
  • Track variance drivers explicitly so finance and commercial teams understand “why”

Measurable outcomes

  • Lower variance vs budget
  • Better timing of savings realization (less “paper savings”)

6.3 Alternative supplier identification (to pre-qualify continuity options)

Decisions supported

  • Build a staged pipeline: longlist → shortlist → pre-qual
  • Decide which alternates need full sensory/consumer validation vs “emergency-only” approval

Filters that matter in this category

  • Aflatoxin limits by destination market (EU vs U.S.)
  • Capability: roasting profile control, grind specs, chunk inclusion consistency
  • Packaging readiness: jar supply options; ability to shift glass ↔ plastic (where allowed)

Measurable outcomes

  • Shorter recovery time (weeks → days) when a supplier or facility is disrupted

6.4 Supply chain risk monitoring (to trigger action early)

Decisions supported

  • When to start alternate qualification (not when you’re already short)
  • When to fund buffers (inventory, packaging safety stock, reserved capacity)

Category-relevant triggers

  • Weather stress in key origins (drought/heat → aflatoxin risk)
  • Stock overhang + storage age (quality drift risk)
  • Facility-level food safety events or audit downgrades

Measurable outcomes

  • Fewer emergency buys and fewer customer penalties

6.5 Procurement performance analysis (to make governance auditable)

Decisions supported

  • Enforce approved vendor lists (AVL) and prevent off-contract buys
  • Volume reallocation based on OTIF + incidents + cost-to-serve

KPIs that work for peanut butter spreads

  • OTIF (by SKU and pack format)
  • Quality incidents per million units (complaints, holds, rejections)
  • Aflatoxin nonconformance rate (lots rejected/diverted)
  • Cost variance split: kernels vs packaging vs conversion vs freight

7) Strategic Use Cases Procurement Leaders Actually Fund

  1. Dual-source design that respects real constraints
  2. Dual-source finished goods for service continuity; dual-source kernels/paste for cost leverage—don’t pretend one solves both.
  3. Aflatoxin governance playbook (by market)
  4. Set acceptance thresholds, sampling rules, and disposition pathways (divert to crushing vs reject).
  5. Packaging risk firewall
  6. Pre-approve alternate jar/closure specs and label pathways; set safety stock policy for lids/seals.
  7. Co-manufacturer capacity resilience
  8. Reserve line windows for peak seasons; define surge terms and changeover SLAs.
  9. Recall-ready traceability discipline
  10. Tight lot traceability and rapid “where used” mapping reduce time-to-action when incidents occur.

8) Why This Matters Beyond Peanut Butter (Adjacent Categories You Likely Also Buy)

Peanut butter spreads are a clean example of a broader procurement truth: the biggest risks sit at the intersections—compliance, capacity, and packaging—not just commodity price.

Examples procurement leaders commonly recognize:

  • Chocolate spreads / cocoa-containing fillings
  • Cocoa price volatility is real, but food safety (Salmonella in low-moisture foods) and fat system specs often drive supplier qualification timelines.
  • Tree nut spreads (almond, hazelnut)
  • Similar allergen controls, but often greater origin concentration and higher grade spreads between compliant and noncompliant lots.
  • Edible oils (palm/canola/soy) used in stabilized spreads
  • Price moves are visible, but procurement outcomes depend on spec equivalency, sustainability policy, and substitution governance.
  • Glass and plastic packaging across shelf-stable foods
  • Packaging lead times and substitution constraints (glass ↔ plastic) can be the gating factor in many ambient categories.

9) Why This Is a Powerful “Proof Category” for Intelligence-Led Sourcing

Peanut butter spread is a procurement training ground because it forces four disciplines to operate together:

  • Cost discipline: kernel volatility + packaging cost-to-serve
  • Risk discipline: aflatoxin and facility-level food safety events
  • Resilience discipline: alternates that are actually spec- and compliance-compatible
  • Governance discipline: auditable decisions (why this supplier, why this spec, why this contract)

If your team can run peanut butter spreads with:

  • documented acceptance thresholds,
  • pre-qualified alternates,
  • packaging continuity plans,
  • and variance explained by driver,

…you can apply the same operating model to a wide range of shelf-stable food categories with fewer surprises and fewer escalations.

Tridge Eye Data Intelligence Solution

Make Faster, Data-Driven Sourcing Decisions

The insights in this report are just the starting point. Tridge Eye is the data intelligence solution that gives procurement and sourcing leaders real-time market signals, price benchmarks, and supply risk alerts — so you can act before the market moves.

Explore Tridge Eye →

Subscribe
By subscribing you agree to with our Privacy Policy and provide consent to receive updates from our company.
Thank you! Your submission has been received!
Oops! Something went wrong while submitting the form.
Subscribe to receive the latest blog posts, updates, promotions, and announcements from Tridge.