INDUSTRY TRENDS

Palm Oil Sourcing Intelligence That Prevents Audit Surprises (and Keeps Supply Moving)

Author
Team Tridge
DATE
March 13, 2026
9 min read
Palm Oil Cover
Tridge Eye Data Intelligence Solution

This report is powered by Tridge Eye Data Intelligence.

Every data point, price signal, and supply risk insight in this analysis comes from the same platform that procurement and sourcing leaders worldwide rely on daily. As you read, consider what this level of market intelligence could do for your sourcing decisions.

Explore Tridge Eye →

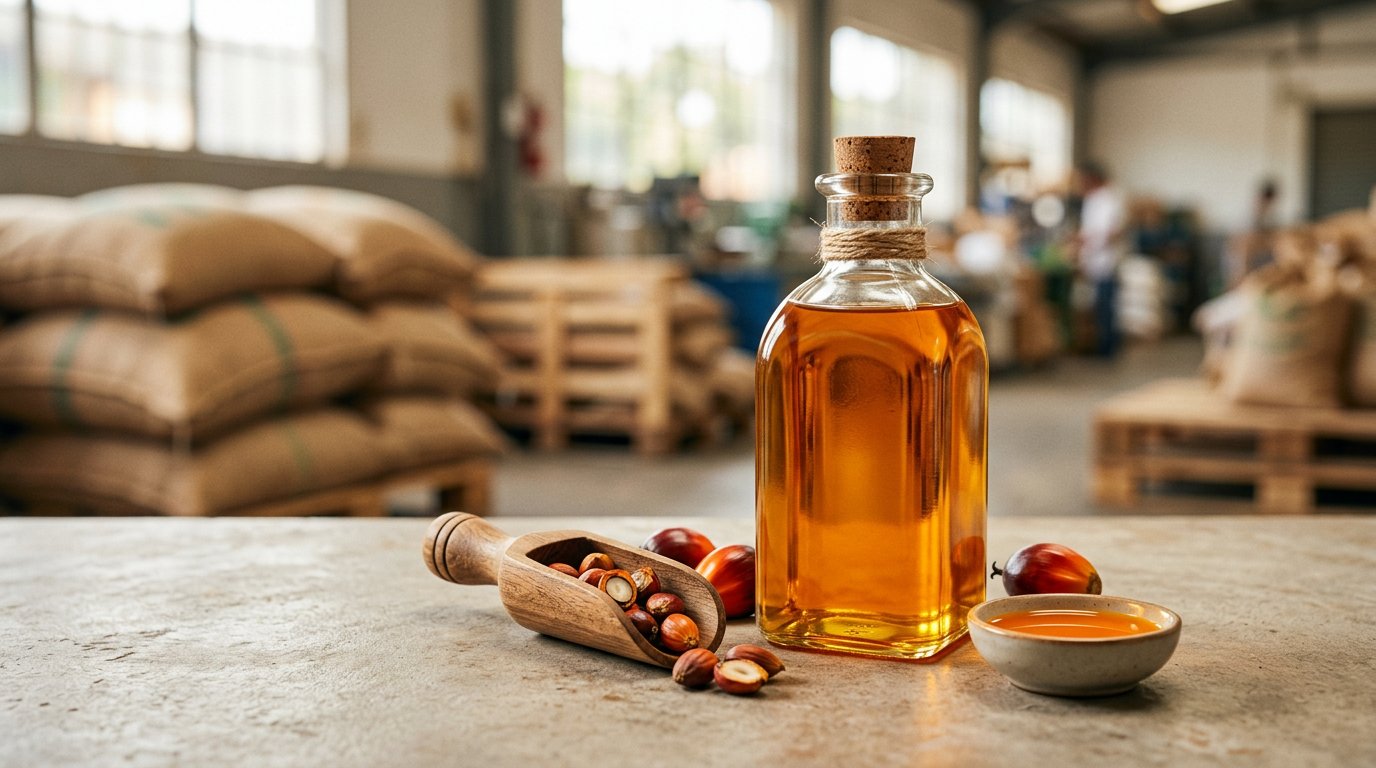
Palm oil procurement looks simple on a PO, but audit surprises usually come from what sits behind the vendor name: changing mill lists, corporate group exposure, and chain-of-custody models that don’t mean the same thing operationally. This guide translates palm-specific realities into a practical, decision-first workflow for Sustainability & Compliance Management teams who need defensible evidence without unintentionally breaking supply continuity.

Executive Summary

  • Palm is a network, not a vendor list: Most sustainability exposure is upstream of your contract (mill + corporate group), while your leverage sits downstream (trader/refinery contracts).
  • Traceability is a percentage, not a checkbox: Treat TTM vs TTP as separate metrics and explicitly quantify the “unknown” portion (by volume and geography).
  • Chain-of-custody claims are not interchangeable: RSPO recognizes Identity Preserved, Segregated, Mass Balance, and Book & Claim—with materially different implications for physical separation vs administrative claims. [1]
  • Policy shocks can move premiums even when benchmarks look stable: Indonesia’s biodiesel blending trajectory (B35 → B40 from Jan 1, 2025) can tighten export availability and reshape differentials. [2]
  • EUDR timing is now concrete: Large operators/traders apply from Dec 30, 2025; micro/small from June 30, 2026—so 2026 contracting cycles should assume higher evidence expectations for EU-bound flows. [3]

Key Insights

(Analyzed at: Mar, 2026)

Palm Oil Infographic
  • Strategy: Hold
  • Reliability: Medium
  • Potential Saving: 3% ~ 8%
  • Insight: Treat 2026 as an “evidence-hardening” year rather than a pure price-timing year: lock in supply continuity by pre-qualifying at least one alternate refinery/trader per critical palm streamand contractually requiring quarterly mill list refresh + group mapping + explicit TTM/TTP reporting. The savings typically come less from headline CPO price moves and more from avoiding (a) emergency spot buys and (b) expedited audit remediation work when a mill list changes or a grievance escalates.

1) What You’re Actually Buying When You Buy Palm Oil (Supply Chain Ground Truth)

Palm oil looks like a single commodity on a PO, but operationally it’s a multi-tier network where the sustainability and compliance risk is usually two steps upstream of your contract.

The physical flow (simplified, but accurate)

  1. Plantations & smallholders harvest Fresh Fruit Bunches (FFB).
  2. FFB is time-critical: it must be milled quickly or quality degrades (higher free fatty acids). (Industry guidance commonly references processing within ~24 hours to limit FFA formation.) [4]
  3. Mills process FFB into Crude Palm Oil (CPO) + kernels (for the palm kernel oil chain).
  4. This is where many buyers anchor traceability: “Traceable to Mill (TTM).”
  5. Traders / aggregators blend volumes from multiple mills and groups.
  6. This is a common traceability break: lists change, intermediaries change, and “unknown” portions creep in.
  7. Refineries / fractionators convert CPO into RBD palm oil, olein (liquid), stearin (solid), plus PFAD.
  8. Your delivered spec is often a refinery output, not “a farm product.”
  9. Manufacturers turn refined fractions into specialty fats, food ingredients, or oleochemical feedstocks.
  10. Importers / tank farms / packers handle heated storage, bulk shipment, drums, or retail packs.

Where risk typically hides (for non-palm specialists)

  • Group-level exposure: an issue at one subsidiary plantation can trigger customer action on the whole corporate group.
  • Blending: compliant and non-compliant risk can mix unless segregation controls are proven.
  • Definitions mismatch: “traceable,” “deforestation-free,” and “certified” are not interchangeable.
  • Data reality: “Traceable to Plantation (TTP)” is materially harder than TTM and often incomplete.

Reality check on chain-of-custody claims: RSPO recognizes four supply chain models—Identity Preserved, Segregated, Mass Balance, and Book & Claim—with very different implications for physical separation vs. administrative claims. [1]

A left-to-right supply chain flow diagram from plantations and smallholders (FFB) to mills, traders/aggregators, refineries/fractionators, manufacturers, and importers/tank farms/packers, with highlighted callouts for 'Traceability anchor: TTM' at mills and 'Traceability break: blending/unknowns' at traders/aggregators, plus a bracket indicating corporate group exposure and a small legend for TTM vs TTP and an 'Unknown %' placeholder box.

2) Where the Money Accumulates (Cost & Margin Structure by Node)

Palm oil economics are dominated by (a) FFB cost, (b) mill extraction efficiency, and (c) policy-driven demand pulls (biodiesel mandates) and export levies/duties.

2.1 Upstream: Plantations & Smallholders (FFB)

Key insight: FFB is the dominant cost input for CPO, and it is local-market priced (highly sensitive to domestic policies, weather/yield, and mill competition).

  • What drives cost
  • Labor intensity (harvesting cycles)
  • Fertilizer and upkeep (yield maintenance)
  • Yield variability (rainfall patterns, aging trees)
  • Short-haul logistics to mills (roads, collection points)
  • Where “compliance cost” shows up
  • Smallholder inclusion programs and verification (often underfunded)
  • Land legality documentation and plot mapping (often critical for EUDR-aligned due diligence)

2.2 Primary Processing: Mills (FFB → CPO)

Key insight: Mills are the operational choke point because FFB must be processed quickly. A mill can be “clean on paper” but still be high-risk if it sources from uncontrolled third-party suppliers.

  • What drives cost
  • Extraction yield and losses
  • Downtime and maintenance
  • Effluent treatment and environmental controls
  • Why mills matter for traceability
  • Many buyers can reach TTM faster than TTP, but mill lists can change quarter to quarter.

2.3 Trading & Aggregation (Blending risk)

Key insight: This is where procurement teams often lose auditability: commercial counterparties change faster than traceability evidence.

  • What drives margin
  • Arbitrage across origins, ports, and specs
  • Risk premium/discount depending on compliance posture and customer eligibility
  • Common failure mode
  • “We’re buying from Trader X” becomes a proxy for “we’re safe,” without validating mill coverage and group exposure.

2.4 Refining & Fractionation (CPO → RBD / Olein / Stearin / PFAD)

Key insight: Refining is where palm becomes a portfolio of products with different end-market pulls (food vs oleochemicals vs fuel co-products). This is also where segregation controls (if any) must be proven.

  • What drives cost
  • Energy and processing aids
  • Yield losses, deodorization distillates (PFAD)
  • QA systems (contaminant controls, specs)
  • Compliance implication
  • If you need “segregated” or “identity preserved” claims, refinery controls and documentation become decisive.

2.5 Packaging, QA, and Release-to-Ship

Key insight: This is where downstream buyers underestimate cost: QA/testing, documentation packs, and certification transaction costs can be small per ton but large in cycle time.

2.6 Logistics & Distribution (heated handling)

Key insight: Palm fractions can require heated tanks and careful handling; disruptions here create expensive spot buys and force supplier exceptions.

A single 100% stacked bar chart labeled 'Delivered Cost (Illustrative) — RBD Palm Olein' with segments: Upstream FFB/farmgate 45%, Milling 12%, Trading/Aggregation 6%, Refining/Fractionation 15%, Packaging & QA 5%, Logistics & Distribution 10%, Commercial Margin 7%, and a footnote noting the ratios are illustrative and vary by product form, Incoterms, and certification/segregation requirements.

Product-level cost breakdown (illustrative, modeled)

A) RBD Palm Olein (bulk, food-grade)

Supply Chain Node Cost Ratio (% of Delivered Cost) Notes
Upstream FFB / farmgate economics 45% Dominant input cost; yield and local pricing matter most.
Milling (FFB → CPO) 12% Extraction efficiency + uptime; local logistics embedded.
Trading/aggregation 6% Blending + risk premium/discount.
Refining/fractionation 15% Energy + yield losses; determines olein vs stearin split.
Packaging & QA 5% Testing, documentation, tank release controls.
Logistics & distribution 10% Heated storage/handling, freight, demurrage risk.
Commercial margin (importer/distributor) 7% Varies by market structure.

B) Specialty fats (bakery/confectionery fat blends)

Supply Chain Node Cost Ratio (% of Delivered Cost) Notes
Upstream + milling (embedded in feedstock) 35% Feedstock cost still dominates but diluted by value-add.
Trading/aggregation 5% Often contracted via refiners/manufacturers.
Refining/fractionation 12% Feedstock standardization and fraction control.
Secondary processing (blending/interesterification) 25% Value-add step; process control and formulation.
Packaging & QA 8% Customer specs, allergen/contaminant controls, release testing.
Logistics & distribution 8% More SKUs, more complexity.
Commercial margin 7% Higher service component.

C) Retail packed palm cooking oil (branded, small packs)

Supply Chain Node Cost Ratio (% of Delivered Cost) Notes
Upstream + milling (embedded in feedstock) 30% Commodity input, but not the full story.
Refining/fractionation 12% Standardization and stability.
Packaging materials & packing ops 25% Bottles/pouches, labels, shrink, line labor.
QA & compliance documentation 6% Claims substantiation, inspections, batch records.
Logistics & distribution 12% Warehousing + last-mile.
Retail/wholesale margin 15% Channel-driven.

3) The Structural Fact That Drives Most Compliance Failures: Palm Is a “Group + Mill Network,” Not a Supplier List

In palm oil, your “supplier” is often:

  • a trader with dozens of upstream counterparties,
  • sourcing from multiple mills,
  • owned by or linked to a corporate group with changing subsidiaries.

That structure creates two persistent problems:

  1. Risk is upstream, accountability is downstream (you contract with the refinery/trader, but the land-use risk sits at plantation/smallholder level).
  2. Traceability completeness is rarely 100% unless proven and maintained.

Many large buyers publicly report TTM/TTP progress and acknowledge that TTP is resource-intensive and risk-calibrated. [5]

4) The Critical Insight: Why “CPO Price” and Your Delivered Risk/Cost Can Disconnect

Procurement teams often expect palm pricing to behave like a clean commodity curve. In practice, your delivered cost and availability can disconnect from benchmark moves because of policy and compliance gating.

Two mechanisms that cause the disconnect

  1. Domestic biodiesel mandates pull feedstock away from export markets
  2. Indonesia’s blending policy has increased domestic pull (B35 in 2023; B40 implemented from Jan 1, 2025), which can tighten export availability and change differentials/premiums. [2]
  3. Export levies/duties change netbacks and redistribute margin
  4. Export levies/duties can shift incentives across upstream vs downstream; for buyers, the practical impact is often seen as changing differentials and availability rather than a clean pass-through from benchmark prices.

What this means operationally

  • You can see stable benchmarks but rising premiums for “eligible” (traceable/segregated/low-risk) supply.
  • Or you can see falling CPO while your audit workload and cycle time rises (more evidence, more exceptions).

5) Where Procurement Teams Typically Get This Wrong (and Why It Shows Up in Audits)

For sustainability/compliance leaders buying outside their core category, these are the repeatable failure patterns:

  1. Treating certifications as equivalence
  2. Assuming any certification claim implies the same physical control model.
  3. Missing that Mass Balance and Book & Claim are structurally different from Segregated/IP. [1]
  4. Approving counterparties without mapping group + mill exposure
  5. “Approved supplier” becomes a static label while mill lists and sourcing routes change.
  6. Not quantifying the ‘unknown’ portion
  7. Reporting “traceable” without stating what % is unknown (by volume, by geography, by mill).
  8. Monitoring controversies, but not operationalizing escalation
  9. Teams see an NGO allegation or grievance, but lack a predefined decision tree (freeze new POs vs conditional sourcing vs suspension).
  10. No pre-qualified alternates
  11. The first time you look for alternates is after a public escalation—when premiums are highest and lead times are worst.

6) How an Intelligence-Driven Service Changes the Outcome (Decision-First, Not Feature-First)

Decision being made

Suspend / restrict / remediate a supplier (or approve under conditions) without triggering supply disruption.

Palm oil-specific context

  • Risk often sits at mill or group level.
  • Evidence needs to be auditable (not just a policy PDF).
  • Traceability is partial unless proven and must be tracked as a percentage.

Minimum capabilities needed (and why)

  1. Traceability & chain-of-custody intelligence (document-based)
  2. Build a declared map: refinery → trader → mill list → group structure.
  3. Output: exception list (unknown mills, missing ownership, outdated disclosures).
  4. Risk monitoring & alerts
  5. Maintain a watchlist for grievances/controversies/sanctions/labor allegations.
  6. Output: issue timelines and severity tiers.
  7. Regulatory & compliance evidence support (workflow-oriented)
  8. Standardize evidence packs, approvals, and exceptions.
  9. Output: audit-ready folders + approval logs.

Practical workflow (who does what)

  1. Sustainability/Compliance sets minimum eligibility thresholds:
  2. e.g., TTM required for 100% of volume; TTP required for X% with a dated improvement plan.
  3. Procurement runs a sourcing event using a shortlist that already includes:
  4. disclosure maturity, group mapping, and known controversy history.
  5. Joint governance applies a severity-based rule:
  6. Tier 1: request evidence + time-bound CAPA
  7. Tier 2: freeze new POs pending verification
  8. Tier 3: suspend + activate pre-qualified alternate
  9. Evidence pack is produced automatically from the workflow (not rebuilt during audit).

Trade-offs and controls

  • Speed vs evidence: allow “conditional approval” only with dated closure criteria.
  • Cost vs risk: model the premium of compliant supply against the cost of disruption (spot buys, customer delisting risk).
  • Continuity vs standards: diversify, but stage suppliers as Approved / Conditional / Not eligible.

Outcome metrics (how you know it worked)

  • % spend traceable to mill and traceable to plantation (reported separately)
  • % volume with unknown mills (target: trending down)
  • Time-to-close corrective actions (median days)
  • # of emergency spot buys triggered by suspensions
  • Audit cycle time (days to respond to customer/regulator questionnaires)

7) Strategic Use Cases You Can Operationalize in 90 Days

Use case A: Audit-ready due diligence without slowing procurement

  • Standard onboarding checklist: mill list currency, group mapping, RSPO model clarity, grievance process evidence.
  • Output: repeatable evidence packs and approvals.

Use case B: Early warning + structured escalation for NDPE/grievance risk

  • Watchlists by supplier group and high-risk landscapes.
  • Pre-agreed severity tiers that trigger procurement actions.

Use case C: Diversify supply without diluting standards

  • Build a contingency bench of alternates by region and product form (olein/stearin/specialty fats).
  • Benchmark disclosure maturity so diversification doesn’t import hidden risk.

Use case D: EUDR-style readiness (EU-bound flows)

  • Track which volumes are EU-bound and require stronger geolocation and due diligence controls.
  • Note: the EUDR revised implementation timeline sets application from Dec 30, 2025 for large operators/traders and June 30, 2026 for micro/small enterprises—so evidence systems should be built before enforcement pressure peaks. [3]

8) Why This Matters Beyond Palm (Examples Your Team Likely Also Buys)

Palm is a useful “training ground” because it forces discipline around multi-tier traceability, policy shocks, and claim substantiation—patterns that repeat across other categories:

  • Cocoa (EUDR-covered): smallholder mapping, plot geolocation, and legality evidence create similar audit bottlenecks.
  • Coffee (EUDR-covered): trader aggregation and mixed-lot traceability mirror the “blending problem.”
  • Soy / soybean oil (biofuel-linked): policy-driven renewable fuel demand can reshape local basis and premiums, similar to how biodiesel mandates influence palm differentials.
  • Rubber (EUDR-covered): smallholder-heavy supply and land legality documentation challenges resemble palm’s upstream reality.

The cross-category lesson: procurement risk is increasingly a data and governance problem, not just a supplier negotiation problem.

9) Why This Example Is Persuasive (What It Proves to an Experienced Compliance Leader)

Palm oil is one of the clearest demonstrations that:

  • Supplier approval must be network-aware (group + mill + sourcing route), not vendor-name-based.
  • Claims must be tied to chain-of-custody models (IP/SG/MB/B&C) rather than treated as interchangeable. [1]
  • Policy shocks are predictable categories of risk (export levies, biodiesel mandates) and should be built into sourcing strategy, not handled as exceptions. [2]
  • Audit readiness is a workflow outcome (structured evidence + approvals), not a scramble before a deadline.

Assumptions / Confidence / Next Best Action

  • Assumptions: You source palm-derived inputs via traders/refiners (not direct estates), with mixed physical supply models and at least partial traceability today.
  • Confidence:Medium—cost ratios are modeled and will vary by product form, Incoterms, and certification/segregation requirements.
  • Next best action: Have Procurement + Sustainability jointly select one high-spend palm stream (e.g., RBD olein) and run a 30-day traceability completeness assessment (TTM/TTP %, unknown mills list, group mapping gaps) to define thresholds and exceptions for the next contracting cycle.
Tridge Eye Data Intelligence Solution

Make Faster, Data-Driven Sourcing Decisions

The insights in this report are just the starting point. Tridge Eye is the data intelligence solution that gives procurement and sourcing leaders real-time market signals, price benchmarks, and supply risk alerts — so you can act before the market moves.

Explore Tridge Eye →

References

  1. rspo.org
  2. indonesia-investments.com
  3. consilium.europa.eu
  4. palmoilis.mpob.gov.my
  5. cargill.com
Subscribe
By subscribing you agree to with our Privacy Policy and provide consent to receive updates from our company.
Thank you! Your submission has been received!
Oops! Something went wrong while submitting the form.
Subscribe to receive the latest blog posts, updates, promotions, and announcements from Tridge.