
This report is powered by Tridge market intelligence.
Every data point, price signal, and supply chain insight in this analysis is drawn from the same engine that procurement teams worldwide rely on daily. As you read, consider what this level of visibility could do for your category.
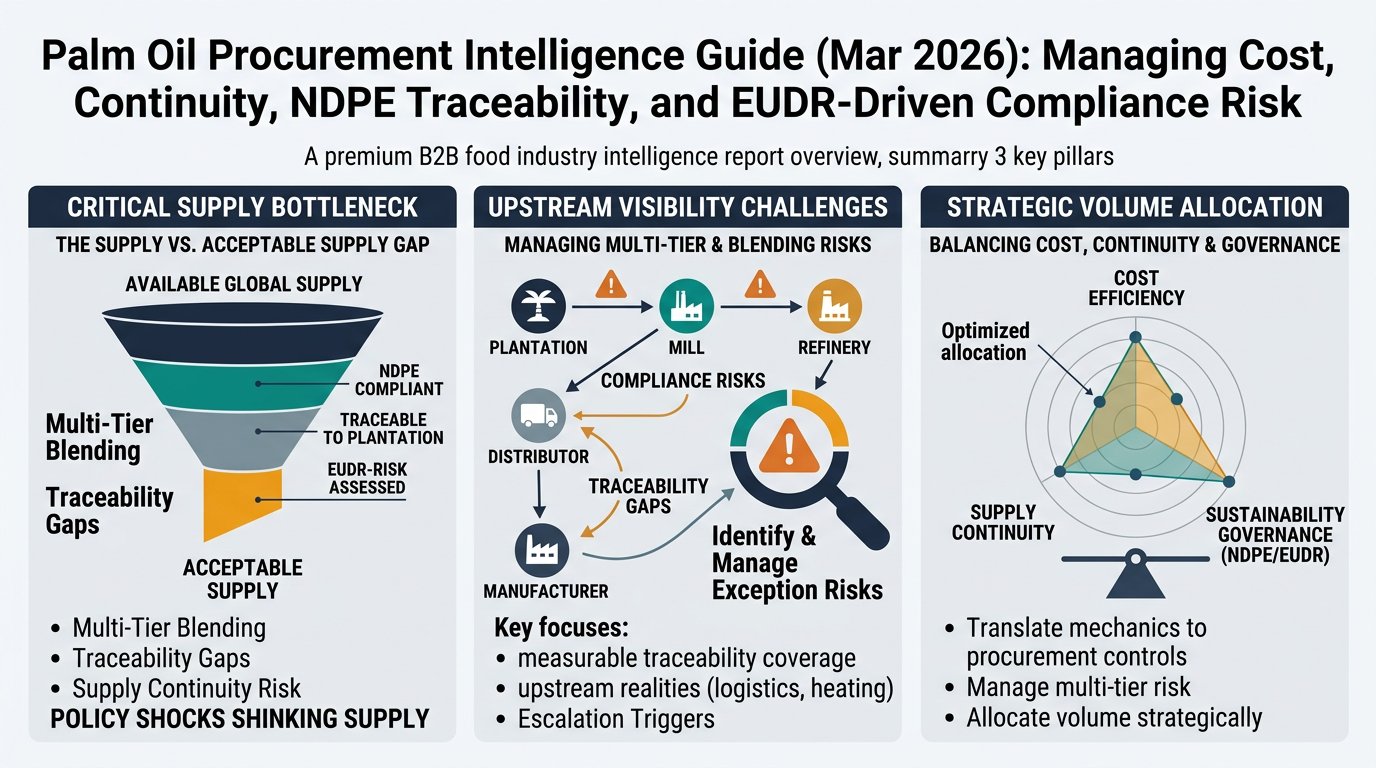
Palm oil procurement rarely fails because a buyer can’t negotiate—it fails because upstream realities (multi-tier blending, heated logistics, policy shocks, and traceability gaps) make “acceptable supply” smaller than “available supply.” This guide translates palm’s supply chain mechanics into procurement controls you can actually run: measurable traceability coverage, exception management, escalation triggers, and volume allocation that balances cost with continuity and sustainability governance.
Analyzed at: Mar, 2026
Insight: Treat 2026 as a governance-and-optionality year, not a “wait-and-see” year. With EUDR application dates now pushed to 30 Dec 2026 (large/medium) and 30 Jun 2027 (micro/small), the near-term advantage is not speculative price timing—it’s avoiding future “compliance premium” shocks by locking in (a) mill-list cadence + exception thresholds in contracts, and (b) a pre-qualified alternate supplier bench for segregated or higher-traceability flows. Companies that use the extra runway to reduce “unknown mill share” and formalize escalation volume levers typically avoid the most expensive outcome: emergency switches into a tight pool of compliant supply [2].
Palm oil procurement looks simple at the invoice level (RBD palm oil, olein, stearin, PFAD), but the risk and cost drivers sit upstream—often outside the buyer’s direct contractual relationship.

Key insight: FFB is time-sensitive and labor-driven. Harvesting cadence and transport to mills drive oil extraction rate (OER) and free fatty acid (FFA) outcomes—small changes upstream can widen downstream basis and quality claims.
Key insight: Mills are the traceability choke point. If you can’t map to mill, you usually can’t credibly manage deforestation and grievance risk at scale.
Key insight: This is where specification and contaminant risk becomes commercial. Refining/fractionation decisions influence:
Key insight: Packaging choice is not just cost—it’s risk control.
Key insight: Palm is a “heated logistics commodity.” Basis volatility often comes from port congestion, tank availability, heating constraints, and freight—not only from CPO futures direction.
Key insight: Your final delivered cost often embeds risk premiums (segregated supply, shorter lead times, alternative origins, or governance “cleaner” routes).
Modeled percentages to show where cost concentrates by product form. Actual ratios vary by origin, contract terms (spot vs indexed), packaging, certification/segregation, and freight. Use these tables to structure negotiations (where leverage sits), not as a “should-cost.”
| Supply Chain Node | Cost Ratio (% of final) | Notes |
|---|---|---|
| Upstream (FFB economics embedded in CPO) | 55% | Dominant driver; yield/weather/policy transmit here first |
| Milling (CPO conversion) | 8% | OER, energy, compliance |
| Refining & fractionation | 12% | Energy + chemicals + yield losses |
| Packaging & QA | 3% | Bulk sampling/testing |
| Logistics & trade finance | 12% | Heated storage, freight, FX, demurrage |
| Trader/Distributor margin | 10% | Service level + credit + optional segregation |
| Supply Chain Node | Cost Ratio (% of final) | Notes |
|---|---|---|
| Upstream (FFB/CPO) | 52% | Shared upstream exposure |
| Milling | 8% | Similar to olein |
| Refining & fractionation | 15% | Fractionation yield/value split matters more |
| Packaging & QA | 3% | Bulk |
| Logistics & trade finance | 12% | Heated handling |
| Trader/Distributor margin | 10% | Often sold on formula/index |
| Supply Chain Node | Cost Ratio (% of final) | Notes |
|---|---|---|
| Upstream (CPO) | 45% | Still linked, but can behave differently vs edible fractions |
| Milling | 6% | Embedded |
| Refining (distillation) | 10% | PFAD is a refining by-product |
| Packaging & QA | 2% | Bulk |
| Logistics & trade finance | 15% | Can be basis-heavy |
| Trader/Distributor margin | 22% | Market is thinner; policy/biofuel demand can widen spreads |

In palm, risk is multi-tier by design:
So your core governance challenge becomes:
Procurement teams often assume “higher price = tighter supply” and “lower price = easier buying.” In palm, availability under your sustainability/compliance threshold can tighten even when headline prices soften.
Three mechanisms drive the disconnect:
Net effect: You can see stable or falling benchmarks while your “acceptable supply pool” shrinks, premiums widen, and lead times extend.
Buyer decision focus: Renew/award volumes while tightening sustainability and continuity controls.
An intelligence-driven service changes outcomes by making risk governable in procurement language:
Instead of ad hoc reactions:
Boundary clarity (important): Intelligence provides risk indicators and governance evidence, not audit-grade proof or legal determinations.
Standardize definitions:
Outcome metric: fewer “data-chasing” cycles; faster escalation decisions
Pre-qualify alternates by:
Outcome metric: time-to-switch reduced from months to weeks
Palm is the clearest example of a broader procurement pattern: the invoice is downstream; the risk is upstream and multi-tier.
Comparable categories where intelligence-led sourcing changes outcomes:
The transferable lesson: treat sustainability and continuity as measurable operating controls, not annual questionnaires.
Because it forces clarity on a hard truth:

Take Your Sourcing Intelligence to the Next Level
The insights in this report are just the starting point. Tridge Eye gives you real-time market signals, origin risk alerts, and price benchmarks — so you can act before the market moves.


