INDUSTRY TRENDS

Organic Pear Purée, Deconstructed: Where Quality Risk and Cost Really Lock In (Orchard → Processor → Aseptic Drum)

Author
Team Tridge
DATE
September 4, 2026
8 min read
organic-pear-puree Cover
Unlock Full Data
Organic Pear Puree Market Intelligence
Prices · Trends · Origins · Forecasts

Organic pear purée looks like a simple ingredient, but procurement outcomes (rejections, holds, audit findings, and continuity failures) are usually determined by a few physical bottlenecks: harvest timing, processor yield loss, and the chosen format system (aseptic vs. frozen). This guide maps those “lock-in points” in plain language so Quality, Safety, and Compliance can specify, approve, and monitor suppliers with fewer surprises.

Executive Summary

  • Cost locks in early: Orchard yield + harvest labor and primary-processing trim/yield loss drive the baseline; downstream steps mostly preserve or reject what’s already been made.
  • Format is a governance choice: Aseptic reduces cold-chain dependence but increases exposure to sterile-fill discipline and packaging integrity; frozen does the opposite.
  • Organic integrity is operational, not clerical: Segregation, cleaning validation, traceability, and mass-balance discipline are where organic risk typically appears in audits.
  • Peak-week risk is real: The highest drift/incident likelihood clusters around peak intake weeks when lines run hot and downtime is costly.

1) The Physical Map: Where Cost “Locks In” From Orchard to Drum

Organic pear purée is a crop-to-ingredient chain where most cost is structurally fixed by (1) orchard yield and harvest labor, (2) trim/yield loss during washing/peeling/coring/sieving, and (3) whether you rely on aseptic filling (ambient logistics, higher packaging/process control cost) or frozen (cold-chain cost and capacity dependency). The chain is short on paper but has two hard bottlenecks: a tight harvest-to-processing window and limited organic-capable aseptic line time.

Insight: The supply chain is physically constructed around a short, seasonal fruit intake window, then year-round inventory carry in aseptic or frozen form.

Data (validated): Pear tissue is susceptible to enzymatic browning when disrupted and exposed to oxygen (polyphenol oxidase/peroxidase activity), which is why processors push for fast intake-to-processing and tight oxygen/time control once fruit is cut or ground. [1]

Procurement Impact: Your “true supplier” is often the processor’s harvest intake + aseptic/frozen capacity system—not just the trading entity—so the fixed cost-drivers sit upstream of your PO.

  • Quick Win: Ask every supplier to map your lot back to (a) orchard/region, (b) processing week, and (c) fill format (aseptic vs frozen). Those three fields explain most spec drift and many nonconformances.
A left-to-right supply chain diagram with 3 major nodes and sub-steps: (1) Orchard/Harvest (yield, labor, maturity/harvest timing), (2) Intake + Primary Processing (wash/sort, peel/core, pulp/finish; yield loss/trim; foreign material controls; organic segregation), (3) Format Choice split into two branches: Aseptic (thermal step, sterile hold, aseptic fill, packaging integrity) vs Frozen (thermal step, freezing, cold storage, reefer logistics). Add 3–5 callout badges labeled “LOCK‑IN” at the points where outcomes become hard to change: harvest timing, primary-processing yield loss, and format system choice. Use simple icons (tree/fruit, conveyor/knife, tank, drum, snowflake, truck) and a small legend for ‘Cost’, ‘Quality Risk’, and ‘Continuity Risk’ using consistent colors.

2) Cost and Margin Structure by Node (What Each Physical Step Adds)

Insight: Costs accumulate less from “value add” and more from irreversible losses (trim, rejects, evaporation) plus compliance overhead (organic segregation + documentation) and format choice (aseptic packaging vs cold chain).

Data (validated): Aseptic fruit purées are expected to be produced under human food CGMP / preventive controls frameworks, and when organic is specified, they must be produced/handled/labeled under USDA NOP by a certified operation—so documentation and release gates are real cost/lead-time contributors, not “nice-to-have.” [2]

Procurement Impact: A spec change that increases defect sensitivity (color, grit, particles, foreign material tolerances) can raise effective cost even if the quoted price is unchanged, because it increases yield loss and rework at the processor.
1. Upstream / Raw Material (Organic Pear Farming + Harvest)

  • Insight: Orchard economics are dominated by labor and yield risk; organic adds constraint (fewer corrective tools) and documentation load.
  • Data (validated): In Europe and other major producing regions, pear supply variability is repeatedly driven by weather shocks (frost/hail/heat) plus structural orchard pressures (aging orchards, water constraints, crop-protection restrictions), which increases volatility for both fresh and processing channels. [3]
  • Procurement Impact: The “floor” for purée cost is set here: when yield drops, processors must pay up for processing-grade fruit or accept lower throughput, and both outcomes propagate downstream.

2. Intake + Primary Processing (Wash/Sort/Peel/Core/Pulp/Finish)

  • Insight: This node is where cost locks in via yield loss and foreign material control; it is also where organic integrity can fail if segregation is weak.
  • Data (validated): Organic processing audits commonly focus on physical separation/segregation through receiving, processing, packing, and dispatch—and on mass-balance reconciliation to show organic inputs plausibly match organic outputs. [4]
  • Procurement Impact: Tight limits on defects (dark specks, peel inclusion, grit) increase trim and slow line speed—raising the real cost per kg of compliant purée.

3. Secondary Processing (Standardization + Thermal Kill Step)

  • Insight: Standardizing to Brix/pH/viscosity is a blending and process-control exercise; variability by variety and season is managed here, not “fixed later.”
  • Data (validated): Pear purée quality deterioration risk is strongly tied to browning chemistry and residual enzyme activity; processors manage this through time/temperature control, oxygen management, and (where formulation allows) acidification strategies to reduce enzyme activity and stabilize color. [5]
  • Procurement Impact: If your specification range is narrow (e.g., tight Brix window, tight color), the processor needs more blending options and more hold tanks—effectively reducing usable inventory and increasing cost.

4. Aseptic Filling OR Freezing (Format Choice as a Cost System)

  • Insight: Aseptic and frozen are two different physical cost structures: aseptic shifts cost into packaging materials and sterility assurance; frozen shifts cost into energy, reefer logistics, and cold storage.
  • Data (validated): Aseptic fruit purée specifications and procurement programs commonly require defined analytical controls (e.g., °Brix and pH) and lot-based sampling/testing approaches; this reinforces that aseptic is a controlled system, not simply “ambient fruit.” [2]
  • Procurement Impact: Format choice is not cosmetic: it determines your exposure to (a) packaging integrity failures and heat abuse (aseptic) versus (b) temperature excursions and reefer availability (frozen).

5. Packaging, QA Release, and Documentation (COA + Organic Paper Trail)

  • Insight: For organic fruit ingredients, QA release is a physical gate (holds, sampling, document verification) that can dominate lead time even when product is already made.
  • Data (validated): For organic-labeled processed products in the U.S., handling/labeling is governed under 7 CFR Part 205 (NOP), and buyers commonly require proof of certification plus scope alignment (product/handling coverage) as part of release. [6]
  • Procurement Impact: The more your end-use resembles “high assurance” (e.g., infant/child nutrition), the more this node behaves like a capacity constraint—inventory exists, but it is not shippable until released.

6. Logistics & Distribution (Ambient Containers vs Reefer + Handling Risk)

  • Insight: Logistics cost is less about miles and more about handling risk: drums/totes are damage-prone, and temperature extremes can degrade color/flavor even when microbiologically stable.
  • Data (validated, 2026 conditions): Reefer markets in 2026 have faced effective-capacity constraints from congestion/rerouting/equipment imbalance and year-over-year rate pressure—so frozen landed cost and service reliability can swing even when the supplier’s ex-works price is stable. [7]
  • Procurement Impact: Landed cost volatility often comes from accessorials (storage, demurrage, rework from damage), not base freight—especially when inventory is held to bridge seasonality.
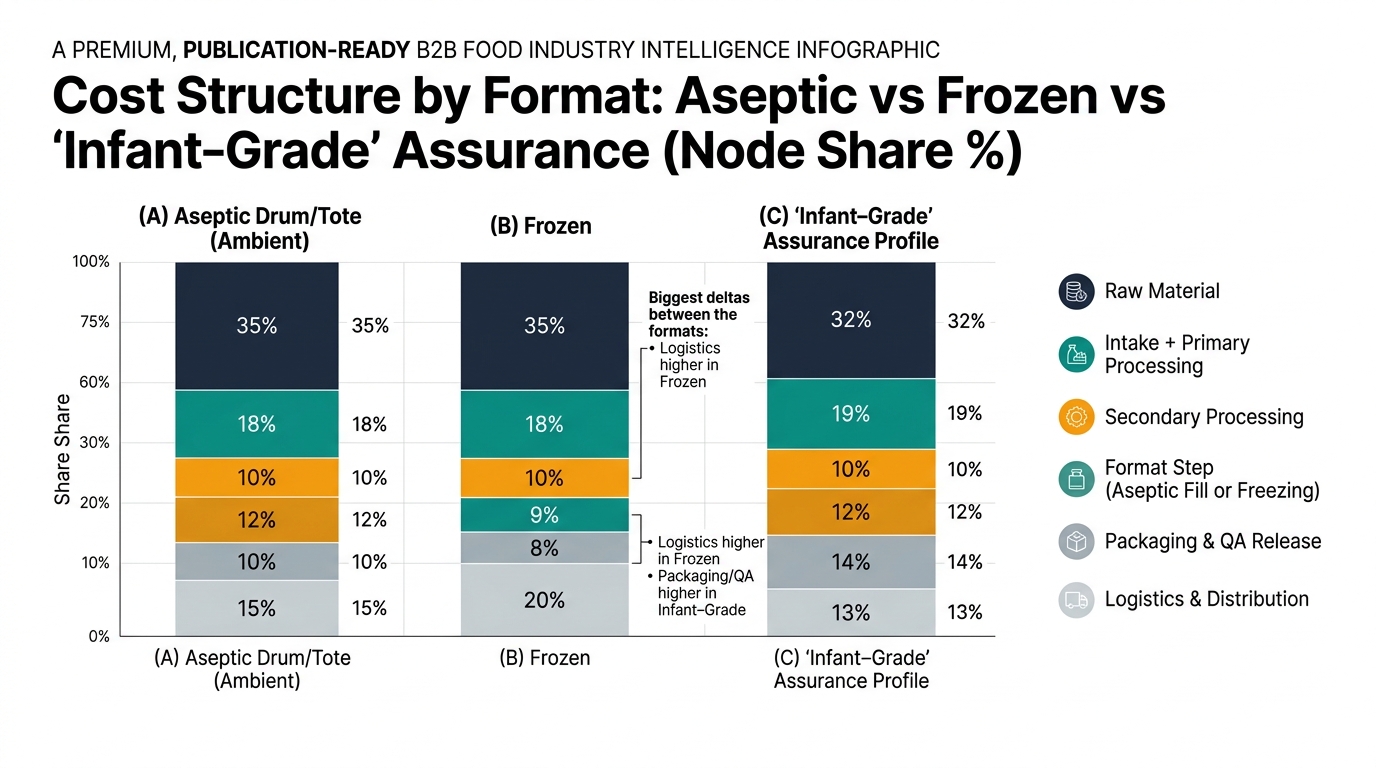
A stacked bar chart with three vertical bars labeled: (A) Aseptic Drum/Tote (Ambient), (B) Frozen, (C) ‘Infant‑Grade’ Assurance Profile. Each bar is segmented by the same supply chain nodes: Raw Material, Intake + Primary Processing, Secondary Processing, Format Step (Aseptic Fill or Freezing), Packaging & QA Release, Logistics & Distribution. Uses the exact percentages shown in the tables (A: 35/18/10/12/10/15; B: 35/18/10/9/8/20; C: 32/19/10/12/14/13) with a small annotation pointing to the biggest deltas (Logistics higher in Frozen; Packaging/QA higher in Infant‑Grade) and a clean legend.

Product-Level Cost Breakdown

A) Organic Pear Purée — Aseptic Drum/Tote (Ambient)

Supply Chain Node Cost Ratio (% of Final Cost) Notes
Raw Material Cost (organic pears) 35% Yield and harvest labor set the baseline.
Intake + Primary Processing 18% Trim/yield loss, water/wastewater, foreign material control.
Secondary Processing 10% Blending/standardization, thermal processing energy, QC.
Aseptic Filling (format step) 12% Sterility assurance, line downtime risk, validation overhead.
Packaging & QA Release 10% Aseptic bags/liners, drums/totes, COA/testing, traceability docs.
Logistics & Distribution 15% Container freight + handling damage risk; heat exposure management.

B) Organic Pear Purée — Frozen (Blocks/Cartons or Frozen Drums)

Supply Chain Node Cost Ratio (% of Final Cost) Notes
Raw Material Cost (organic pears) 35% Similar upstream exposure as aseptic.
Intake + Primary Processing 18% Same yield-loss mechanics.
Secondary Processing 10% Standardization + kill step; may differ by customer spec.
Freezing (format step) 9% Energy + freezing capacity; throughput constraints in peak season.
Packaging & QA Release 8% Packaging is often cheaper than aseptic; QA still gates shipment.
Logistics & Distribution 20% Reefer ocean/inland + cold storage + excursion risk.

C) Organic Pear Purée — “Infant-Grade” Assurance Profile (Usually Aseptic)

Supply Chain Node Cost Ratio (% of Final Cost) Notes
Raw Material Cost (organic pears) 32% May require tighter orchard/region controls, limiting sourcing flexibility.
Intake + Primary Processing 19% Higher defect sensitivity increases trim and slows line speed.
Secondary Processing 10% Tighter control of oxidation/color and particle profile.
Aseptic Filling (format step) 12% Same aseptic mechanics; higher verification burden.
Packaging & QA Release 14% Expanded testing panels, longer holds, stricter documentation.
Logistics & Distribution 13% Similar lanes; added emphasis on handling integrity and traceability.
Sourcing Window Radar
Organic Pear Puree — Global Harvest Calendar
ARGENTINA SEASON ACTIVE
🇦🇷 Argentina
JAN — NOV
🇨🇱 Chile
AUG — NOV
🇲🇽 Mexico
FEB — DEC
🇱🇻 Latvia
FEB — DEC
🇺🇸 United St.
OCT — OCT
JanFebMarAprMayJunJulAugSepOctNovDec

3) Structural Facts You Can’t “Engineer Away” (And What They Do to Specs)

Insight: Organic pear purée has a few non-negotiable structural constraints that shape availability and quality variance regardless of supplier intent.

Data (validated): The constraints are seasonal intake windows, processing/aseptic capacity concentration, and chemistry-driven oxidation/texture variability by variety and maturity—pear browning is enzyme-driven and sensitive to oxygen exposure and processing conditions. [1]

Procurement Impact: Many disputes framed as “supplier performance” are actually physics + capacity constraints; the practical lever is aligning format, spec ranges, and verification to the chain’s physical limits.

Reality 1: Harvest-window compression creates a capacity race

  • Insight: Pears arrive in a short window; processors must run high utilization, and any downtime (equipment, labor, sanitation, aseptic validation) has outsized impact.
  • Data (validated): Weather-driven crop damage (frost/hail/heat) can compress usable intake even further and amplify peak-week pressure; this is a recurring pattern in European pear seasons. [3]
  • Procurement Impact: The highest risk period for spec drift and packaging/handling incidents is often peak processing weeks, when the system is least forgiving.

Reality 2: Aseptic is a bottleneck capability, not a default setting

  • Insight: Aseptic lines are capital-intensive and validation-heavy; organic adds segregation and cleaning complexity.
  • Data (validated): Aseptic procurement specs emphasize controlled processing requirements and analytical conformance (e.g., °Brix/pH ranges by type), reinforcing that changeovers and validation discipline are part of the capability. [2]
  • Procurement Impact: When aseptic time is scarce, the chain structurally prioritizes long runs and predictable specs; frequent spec variants increase complexity and loss.

Reality 3: Oxidation and texture are chemistry problems, not paperwork problems

  • Insight: Color shift and viscosity/particle variability track oxygen exposure, enzyme activity, variety, and maturity—especially in pears.
  • Data (validated): Pear browning is catalyzed by PPO/POD once tissue is disrupted; controlling oxygen exposure and using process levers (time/temperature, acidification where allowed) are central mitigation pathways. [8]
  • Procurement Impact: If your downstream product is color-sensitive (pouches, light-colored blends), you need realistic color windows and a shared understanding of how transport heat exposure can move the needle.

Key Insights (What to Remember When You Look at a Spec Sheet)

  • Key Takeaways: The biggest fixed cost drivers are orchard yield + harvest labor, primary-processing yield loss, and format choice (aseptic packaging/validation vs frozen cold chain).
  • Key Takeaways: “Quality” is physically manufactured at intake, finishing, and standardization; after filling, you can only detect issues—not fix them.
  • Key Takeaways: Aseptic reduces cold-chain dependence but increases reliance on packaging integrity and sterile-fill discipline; frozen reverses that trade.
  • Key Takeaways: Tight specs often express as higher trim, slower line speed, and longer QA holds—raising effective cost even when the quote looks stable.

The Bottom Line for Your Next Contract

(Analyzed at: Sep, 2026)

Write your next organic pear purée contract so it forces early visibility into the two things that drive most surprises: processing week (peak-week risk) and format system (aseptic vs frozen). Require those fields—plus organic certificate scope confirmation for the specific site and product—on every COA and shipping document, and pre-agree that lots from peak processing weeks trigger a tighter release protocol (e.g., hold-and-test for color drift/pack integrity). This works because pear quality is most sensitive to oxygen/time and high-utilization processing conditions, while 2026 reefer volatility makes “we’ll switch to frozen if needed” a costly assumption. Teams that operationalize this typically avoid the hidden 5–15% annualized hit from re-tests, rework, and expedites that shows up when root cause stays invisible until receiving. [5]

Organic Pear PureeSupply Chain Intelligence
134 countries tracked
10
Exporters
10
Importers
$120M
Top Export Value
Top Exporters (2024)
🇪🇸
Spain
$120M
🇮🇹
Italy
$110M
🇵🇱
Poland
$53M
🇹🇭
Thailand
$41M
🇪🇬
Egypt
$24M
+129 more
Top Buyers
🇩🇪 Germany $44M🇬🇧 United Kingdom $33M🇳🇱 Netherlands $29M🇵🇹 Portugal $25M🇩🇴 Dominican Rep. $23M

References

  1. pmc.ncbi.nlm.nih.gov
  2. ams.usda.gov (PDF)
  3. apps.fas.usda.gov (PDF)
  4. assets.ofgorganic.org (PDF)
  5. academic.oup.com
  6. law.cornell.edu
  7. dhl.com
  8. pmc.ncbi.nlm.nih.gov

Related Contents

Subscribe
→
By subscribing you agree to with our Privacy Policy and provide consent to receive updates from our company.
Thank you! Your submission has been received!
Oops! Something went wrong while submitting the form.
Subscribe to receive the latest blog posts, updates, promotions, and announcements from Tridge.