INDUSTRY TRENDS

Organic Cashew Supply Chain Map for Procurement: Flow, Specs, and What Really Drives Landed Cost

Author
Team Tridge
DATE
April 28, 2026
8 min read
organic-cashew-nut Cover
Unlock Full Data
Organic Cashew Nut Market Intelligence
Prices · Trends · Origins · Forecasts

This guide is a procurement-first map of how organic cashews physically move from farm to your dock, where cost and risk “lock in,” and which specs matter most when you’re trying to stabilize landed cost without compromising organic integrity. It’s written for sourcing leaders who know procurement well but don’t live in the cashew category day to day.

Executive Summary

  • Yield is the core economic lever: Raw cashew nuts (RCN) typically convert to kernels at roughly ~20–25% by weight, so small yield or breakage shifts move unit cost fast. [1]
  • Moisture and packaging are functional controls: Trade standards commonly cap kernel moisture at ≤5%, and export packs are typically vacuum and/or nitrogen-flushed barrier bags inside cartons to protect against humidity/oxidation. [2]
  • Processing is structurally concentrated: Vietnam and India remain the dominant processing hubs; disruptions there can outweigh farm-level diversification. [3]
  • Organic risk is often “paper risk”: For U.S. imports, each shipment must be associated with an NOP Import Certificate (implemented March 19, 2024), so documentation discipline is a supply assurance control, not admin overhead. [4]

1) How the Organic Cashew Chain Is Physically Built (and Where Costs “Lock In”)

Organic cashew kernels are a two-step global chain: seasonal raw cashew nuts in shell (RCN) are harvested and dried near farms, then most value is created in processing hubs that convert RCN into graded kernels under tight moisture and segregation controls. The fixed cost-drivers are concentrated in (1) farm-level drying and aggregation (quality + organic integrity), (2) primary processing yield and breakage (whole-kernel recovery), and (3) packaging/handling that protects kernels from oxygen and humidity through long ocean transits.

A left-to-right (or top-to-bottom) process flow showing the physical movement and transformation of organic cashews: Orchard harvest → nut separation from apple → drying to safe moisture → bagged RCN aggregation → conditioning (steam/thermal) → shelling → kernel drying → peeling (testa removal) → grading (wholes/splits/pieces; white vs scorched) → bulk vacuum/N2 high-barrier packing → container export → import QA + documentation check (incl. NOP Import Certificate) → optional roasting/flavoring/milling → retail/industrial pack. Add callouts for the three 'cost/risk lock-in' points: (1) farm drying/segregation, (2) primary processing yield & breakage/grade outcome, (3) barrier packaging + transit humidity control. Use neutral icons (farm, bags, factory, lab, container, warehouse) and avoid any intelligence dashboard visuals.
  • Insight: The chain’s economics are dominated by conversion efficiency (RCN → kernels) and grade outcome (wholes vs pieces), not by “moving boxes” downstream.
  • Data (validated): Typical kernel outturn from RCN is roughly ~20–25% by weight (often discussed commercially via KOR/outturn tests), so small yield shifts materially change unit cost. [1]
  • Procurement Impact: Most landed-cost variance originates upstream of roasting/packing—at drying, conditioning, shelling, peeling, and grading—where defects and breakage permanently reduce the value of the lot.

Physical flow (ground truth)

Orchard harvest → nut separation from apple → drying to safe moisture → bagged RCN aggregation → conditioning (steam/thermal) → shelling → kernel drying → peeling (testa removal) → grading (whole/splits/pieces; white vs scorched) → bulk vacuum/N2 pack → container export → import QA + documentation check → optional roasting/flavoring/milling → retail/industrial pack.

2) Where Money Accumulates: Cost & Margin Structure by Supply-Chain Node

Insight: Organic cashew cost builds in layers: upstream compliance + handling protects organic integrity, but the largest “irreversible” cost is created when processors convert RCN into a grade mix.

Data (validated concept): The processor’s realized value is a weighted average of grades produced (e.g., W320 vs pieces), meaning breakage rate and defect removal drive both cost and margin.

Procurement Impact: Even without discussing buying strategy, you can map which node is responsible for which cost driver—yield loss, labor intensity, energy, packaging barrier performance, and logistics risk.
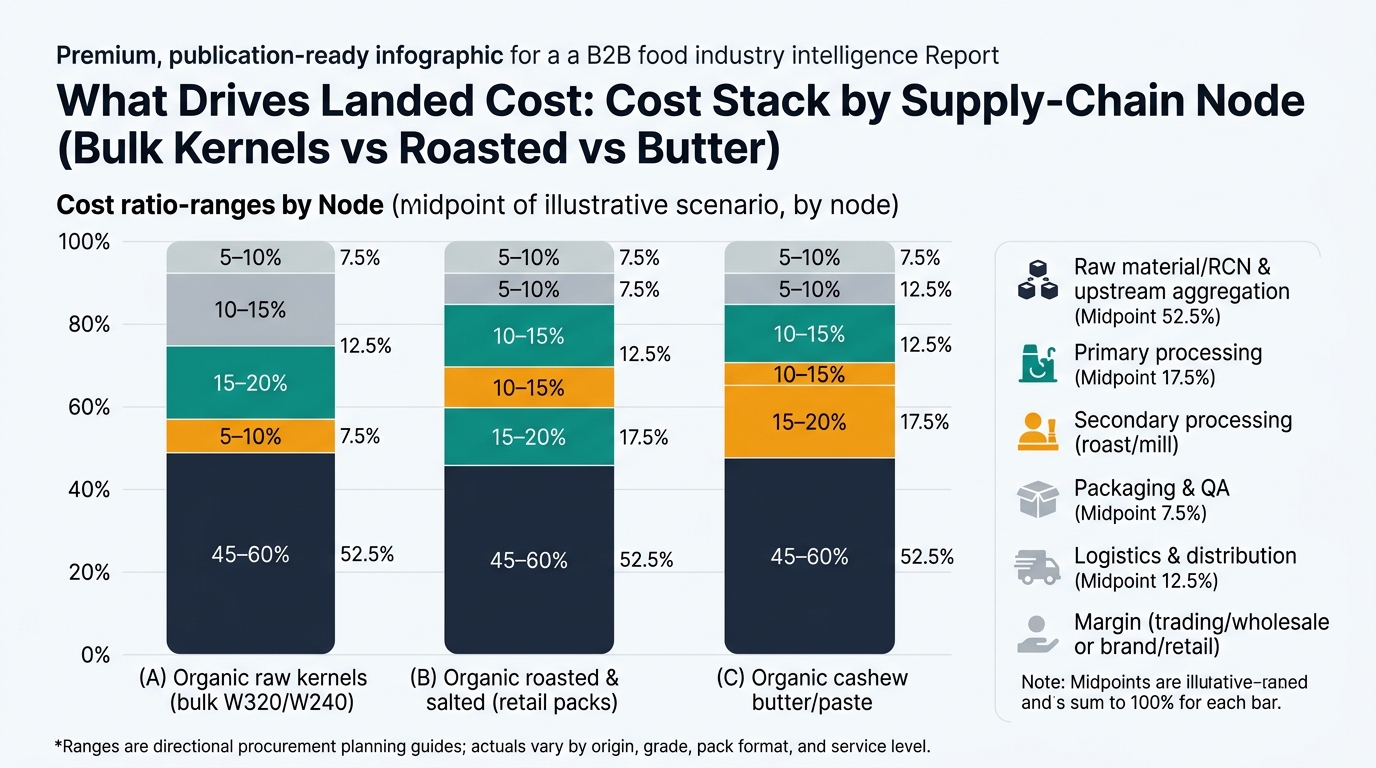
Three 100% stacked bars comparing cost ratio ranges by node for: (A) Organic raw kernels (bulk W320/W240), (B) Organic roasted & salted (retail packs), (C) Organic cashew butter/paste. Segments (consistent colors across all bars): Raw material/RCN & upstream aggregation; Primary processing; Secondary processing (roast/mill); Packaging & QA; Logistics & distribution; Margin (trading/wholesale or brand/retail). Use midpoints of the provided ranges for the visual and annotate each segment with the range (e.g., “45–60%”). Include a footnote: “Ranges are directional procurement planning guides; actuals vary by origin, grade, pack format, and service level.” No product UI mockups.

1. Upstream / Raw Material (Farming + Drying + First Aggregation)

  • Insight: Farm-level drying and segregation are the first “quality gate”; poor drying increases mold/off-odors and elevates later sorting loss.
  • Data (directionally correct): Unseasonal rains during drying windows increase moisture-related defects; organic programs add recurring costs for training, inspections, and recordkeeping (often via smallholder internal control systems).
  • Procurement Impact: The upstream node sets the defect ceiling for the entire lot; downstream QA can only reject, downgrade, or blend—never restore a compromised organic/quality profile.
  • Fixed cost drivers: Harvest labor, drying mats/racks, bags, village-level storage, organic compliance overhead, and local transport to aggregation points.
  • Physical loss points: Over-drying reduces weight; under-drying raises mold risk and elevates later sorting loss.

2. Origin Aggregation & Export Prep (RCN Bulking, Warehousing, Documentation)

  • Insight: Aggregation is where traceability either stays intact or becomes fragile; mass-balance discipline matters because RCN is often pooled.
  • Data (validated for U.S. imports): Organic lots require documented chain-of-custody and segregation; documentation gaps can force delays, rework, or loss of organic status at the border/receiving. For the U.S., each organic import shipment must be associated with an NOP Import Certificate (in effect since March 19, 2024). [4]
  • Procurement Impact: This node drives “paper risk” and delay risk at receiving—missing lot IDs, inconsistent weights, or incomplete organic paperwork can hold inventory.
  • Fixed cost drivers: Warehouse rent, pest control compatible with organic programs, re-bagging, sampling, documentation labor, pre-shipment inspection.
  • Margin behavior: Aggregators typically earn thin per-kg spreads but can capture more margin when they control scarce certified volumes.

3. Primary Processing Hub (Conditioning → Shelling → Drying → Peeling → Grading)

  • Insight: This is the economic engine of cashews: value is created (or destroyed) through yield, breakage, and grade distribution.
  • Data (validated mechanics): Kernel yield is structurally constrained by the shell and moisture loss; the processor’s controllable variables are breakage rate, peel efficiency, defect sorting, and rework. Labor intensity is high (shelling/peeling/grading), and energy is required for conditioning and drying.
  • Procurement Impact: The processor’s cost base is dominated by (a) RCN input cost, (b) labor and throughput constraints, and (c) quality losses that downgrade wholes into pieces—directly shifting the realized average selling price.
  • Fixed cost drivers: Steam/thermal conditioning energy, skilled labor, equipment depreciation, QA, organic segregation line-change and cleaning, working capital to hold RCN/kernels.
  • Physical loss points: Breakage (whole → pieces), scorch/heat damage, moisture mismanagement (oxidation/rancidity risk later), foreign material control.

4. Secondary Processing Near End-Market (Roasting/Flavoring/Milling)

  • Insight: Secondary processing adds consumer-ready attributes but cannot “upgrade” a weak raw kernel; it mainly adds conversion and packaging cost.
  • Data: Roasting drives weight loss (moisture), requires tight time/temperature control, and increases oxidation risk if post-roast cooling and oxygen exposure are poorly managed. Milling into butter/paste increases surface area, accelerating oxidation without strong oxygen barriers.
  • Procurement Impact: This node is where spec tolerances become operational (roast color, flavor adhesion, particle size) and where allergen controls and sanitation increase fixed overhead.
  • Fixed cost drivers: Roasters, seasoning systems, oil management, mills, sanitation labor, allergen validation, yield loss during roasting and line change.
  • Quality failure modes: Over-roast bitterness, uneven roast, seasoning fallout, rancidity acceleration in milled formats.

5. Packaging & QA Release (Bulk Cartons → Retail Packs)

  • Insight: Cashews are “ambient stable” only if oxygen and humidity are controlled; packaging is a functional cost, not cosmetic.
  • Data (validated standards/practice): Trade standards commonly require kernel moisture not greater than 5%, and industry guidance commonly targets ~3.5–4% for packing; bulk kernels are commonly vacuum-packed and/or nitrogen-flushed in high-barrier bags inside cartons. [2]
  • Procurement Impact: Packaging choice and QA release discipline determine how much of your inventory remains saleable through transit + storage; failures show up as claims, rework, or accelerated discounting.
  • Fixed cost drivers: Barrier films/liners, nitrogen/vacuum equipment, carton/pallet materials, lab testing, sampling labor, label/lot coding.
  • Hidden cost driver: Holds and partial releases when documentation or test results lag inbound schedules.

6. Export Logistics → Import Handling (Ocean Freight, Port, Inland, Warehousing)

  • Insight: Logistics cost is not just freight rate; time-in-transit amplifies quality risk if packaging or container practices are weak.
  • Data: Humidity ingress, odor contamination, and delays are common physical risks in containerized ambient shipments; longer dwell times raise the probability of quality drift and missed production windows.
  • Procurement Impact: The logistics node converts time uncertainty into working-capital cost and service-level risk; even when the product arrives, condition issues can push it into lower-value uses.
  • Fixed cost drivers: Ocean freight, port/terminal handling, customs brokerage, insurance, demurrage/detention, inland drayage, warehousing.
  • Physical protection practices: Desiccants, container inspection, odor control, pallet wrap integrity.

Product-Level Cost Breakdown

A) Organic Raw Cashew Kernels (Bulk, e.g., W320/W240)

Supply Chain Node Cost Ratio (% of Final Cost) Notes
Raw Material (RCN + farm/aggregation) 45–60% Dominated by RCN input economics and certified volume availability.
Primary Processing 18–28% Labor + energy + yield loss + grade outcome (wholes vs pieces).
Packaging & QA 4–8% Barrier bags, vacuum/N2, lab tests, organic document checks.
Logistics & Distribution 6–12% Freight + port/handling + inland + insurance; delays add working-capital drag.
Trading/Wholesale Margin 6–12% Varies by service level, financing, and consolidation role.

B) Organic Roasted & Salted Cashews (Retail Packs)

Supply Chain Node Cost Ratio (% of Final Cost) Notes
Raw Kernels Input 30–45% Kernel grade and defect profile determine usable yield in roasting.
Secondary Processing 10–18% Roasting energy, seasoning, labor, allergen/sanitation overhead.
Packaging & QA 12–20% Retail film/jars, gas flush, coding, higher QA and shelf-life validation.
Logistics & Distribution 8–14% Finished goods distribution is frequent and less dense than bulk.
Brand/Retail Margin 15–30% Retail category economics and promo intensity drive the spread.

C) Organic Cashew Butter/Paste (Industrial or Retail)

Supply Chain Node Cost Ratio (% of Final Cost) Notes
Raw Kernels Input 28–42% Pieces can be economical, but oxidation control becomes more critical.
Secondary Processing (milling) 12–22% Milling, heat management, particle size control, sanitation.
Packaging & QA 14–24% Oxygen barrier and headspace control are key; jars/tubs add cost.
Logistics & Distribution 7–13% Heavier packs; temperature excursions can affect texture/oil separation.
Brand/Channel Margin 12–25% Depends on private label vs branded and channel mix.
Sourcing Window Radar
Organic Cashew Nut — Global Harvest Calendar
VIETNAM SEASON ACTIVE
🇻🇳 Vietnam
APR — OCT
🇮🇳 India
APR — OCT
🇺🇸 United St.
APR — OCT
🇧🇷 Brazil
OCT — OCT
🇸🇬 Singapore
APR — SEP
JanFebMarAprMayJunJulAugSepOctNovDec

3) Structural Realities Procurement Teams Can’t “Engineer Away”

Reality 1: Processing capacity and know-how are geographically concentrated

  • Insight (validated): The largest conversion step (shelling/peeling/grading) is concentrated in a small number of processing hubs, creating structural dependency.
  • Data: Vietnam and India remain central to global kernel processing and export flows; Vietnam is frequently cited as processing >60% of global kernels. [3]
  • Procurement Impact: Any disruption at processing hubs (labor, power, compliance shutdowns) has outsized impact because there are fewer truly interchangeable facilities than there are farms.

Reality 2: Harvest seasonality creates inventory “bulges” and quality risk windows

  • Insight: Cashew supply is seasonal at the farm, but demand is year-round; inventory must bridge the gap.
  • Data: RCN is harvested in defined windows by origin; holding kernels for longer periods increases oxidation exposure and raises the value of barrier packaging and warehouse discipline.
  • Procurement Impact: The physical need to carry inventory makes working capital and shelf-life management structural—not optional—especially for organic lots that cannot be easily substituted.

Reality 3: Organic integrity is a documentation-and-segregation system, not a single certificate

  • Insight (validated): Organic status can be lost through commingling or paperwork breaks even when the product is chemically “clean.”
  • Data: For U.S. imports, organic shipments require an NOP Import Certificate (since March 19, 2024), which makes handoff documentation a primary control point. [4]
  • Procurement Impact: The highest-probability failure mode is administrative delay or non-conformance at handoffs (aggregator → processor → exporter → importer), which can strand inventory or force relabeling.

Key Insights to Carry Into Your Spec Sheet and Internal Alignment

  • Insight: Cashew value is created by conversion (RCN→kernels) and preserved by barrier control (oxygen/humidity) more than by downstream “finishing.”
  • Data (validated): A ~20–25% kernel outturn means yield and breakage dominate unit economics; grade mix (wholes vs pieces) is the processor’s core value lever. [1]
  • Procurement Impact: When you align QA, ops, and finance, focus on the few physical variables that drive most outcomes: drying discipline upstream, breakage control in primary processing, and packaging barrier performance through transit.

Quick Win: Treat moisture/oxygen control and lot traceability as cost drivers—because they determine reject/downgrade rates and how much inventory stays saleable.

4) The Bottom Line for Your Next Contract

(Analyzed at: Apr, 2026)

Right now the cashew market is broadly described as stable-to-range-bound, but with meaningful logistics upside risk (routing disruptions and freight premiums can quickly erase any origin-side softness). [5] In that context, the most defensible contract move is to tie price to grade yield and documentation performance, not just a flat $/lb: require (1) a moisture spec aligned to trade standards (≤5% and a target packing range), (2) defined pack-out (vacuum/N2 high-barrier) and container humidity controls, and (3) “no-hold” organic paperwork readiness (including the NOP Import Certificate for U.S. arrivals). [2] When those controls are weak, the cost shows up as avoidable downgrades, production reschedules, and inventory holds—often a low-single-digit percentage of landed cost that feels small until it repeats across multiple containers and peak-demand weeks.

Organic Cashew NutSupply Chain Intelligence
130 countries tracked
10
Exporters
10
Importers
$296M
Top Export Value
Top Exporters (2024)
🇳🇱
Netherlands
$296M
🇮🇳
India
$296M
🇩🇪
Germany
$109M
🇹🇷
Turkey
$44M
🇧🇷
Brazil
$44M
+125 more
Top Buyers
🇺🇸 United States $1.07B🇩🇪 Germany $327M🇳🇱 Netherlands $316M🇹🇷 Turkey $168M🇦🇺 Australia $101M

References

  1. styyer.com
  2. standards.iteh.ai (ISO 6477:1988 listing)
  3. svc.vn
  4. ams.usda.gov
  5. commodity-board.com
Subscribe
By subscribing you agree to with our Privacy Policy and provide consent to receive updates from our company.
Thank you! Your submission has been received!
Oops! Something went wrong while submitting the form.
Subscribe to receive the latest blog posts, updates, promotions, and announcements from Tridge.