INDUSTRY TRENDS

Orange Juice Concentrate (OJC) Sourcing Guide: Cost Stack, Correlated Risk, and the Levers Procurement Can Actually Pull

Author
Team Tridge
DATE
March 26, 2026
9 min read
orange-juice-concentrate Cover
Tridge Eye Data Intelligence Solution

This report is powered by Tridge Eye Data Intelligence.

Every data point, price signal, and supply risk insight in this analysis comes from the same platform that procurement and sourcing leaders worldwide rely on daily. As you read, consider what this level of market intelligence could do for your sourcing decisions.

Explore Tridge Eye →

Orange Juice Concentrate (OJC) sourcing looks like a “commodity buy” until you live through a tight crop year: supply can be available but not accessible (allocation), price can move faster than contracts, and quality constraints can shrink usable supply overnight. This guide translates OJC supply-chain realities into procurement levers—so you can control landed cost volatility, reduce outage risk, and make decisions that are defensible with Finance, QA, Operations, and Legal.

Executive Summary

  • Spec reality: FCOJ is typically traded around ~65° Brix (commonly ~65–66° Brix), and small shifts in brix/acid window, micro limits, and aroma/essence approach can materially change the usable supplier pool. [1]
  • Origin concentration (export market): Brazil is consistently described as the dominant player in global orange juice exports (often cited around ~75–85% of the export market depending on definition/year), which creates correlated, market-wide shocks rather than “one supplier issues.” [2]
  • U.S. structural dependence: USDA/ERS has highlighted that imports represent a very large share of U.S. orange juice availability (commonly discussed around ~80% in recent seasons), with Brazil supplying the majority of U.S. orange juice imports. [3]
  • Florida supply is historically low: USDA/NASS published Florida’s all-orange forecast at 11.6 million boxes (April 10, 2025 report), reinforcing that domestic “backstop supply” is limited. [4]
  • Procurement implication: Your biggest controllable levers are usually (1) contract coverage + triggers, (2) qualification pipeline + spec flexibility guardrails, (3) cold-chain/Incoterms control points, and (4) concentration limits by origin/processor group—not “more negotiation rounds.”

Key Insights

Analyzed at: Mar, 2026

  • Strategy: Hold
  • Reliability: Medium
  • Potential Saving: 5% ~ 12%
  • Insight: In a market structurally exposed to Brazil-centric export risk and ongoing U.S. import dependence, the best near-term value is usually not chasing spot “dips,” but tightening governance: lock a risk-adjusted coverage band (e.g., 60–80% indexed/hybrid), accelerate backup qualification, and pre-negotiate spec flexibility ranges with QA. This reduces the probability of paying allocation premiums, demurrage/cold-store penalties, and “emergency substitution” costs that often exceed the headline price delta.

1) What You’re Actually Buying: The Ground Truth of the OJC Supply Chain

Orange Juice Concentrate (OJC)—especially FCOJ (frozen concentrated orange juice, typically ~65–66° Brix)—isn’t “just another fruit ingredient.” It’s a spec-driven, energy-intensive, cold-chain commodity whose availability is shaped by orchard biology, disease pressure, and a small number of highly integrated processors. [1]

End-to-end flow (practical view)

  1. Orchards (processing oranges) → fruit harvested to minimum maturity/juice yield targets
  2. Primary processing (extraction) → juice extraction + separation of pulp/peel/oil/essence
  3. Secondary processing (concentration & standardization) → evaporation to target Brix; blending to hit brix/acid ratio and sensory; aroma/essence management
  4. Packaging & QA release → frozen drums/totes or aseptic formats; COA + traceability pack
  5. Ocean freight + destination cold storage (for frozen) → reefer dependency, port/cold-store constraints
  6. Reconstitution / blending at buyer → final beverage quality depends on concentrate consistency + blending know-how
A left-to-right flowchart showing the practical OJC chain from orchards through processing, concentration, packaging & QA release, ocean freight, destination cold storage/handling, and buyer reconstitution/blending, with callouts for processor allocation, spec constraints shrinking usable supply, cold-chain bottlenecks, and QA holds.

Two market realities procurement teams underestimate

  • Origin concentration is not a theory; it’s a structural feature. Brazil is the dominant exporter and is often cited as accounting for ~75–85% of global orange juice exports (depending on product form and measurement), meaning many buyers share the same upstream risk drivers. [2]
  • U.S. domestic supply reliability has weakened structurally. USDA/NASS reporting shows Florida orange volumes at historically low levels in the 2024/25 season (e.g., 11.6 million boxes forecast in the April 10, 2025 Crop Production report). [4]

2) Where the Money Accumulates: Cost & Margin by Node (and Why It Matters in Negotiation)

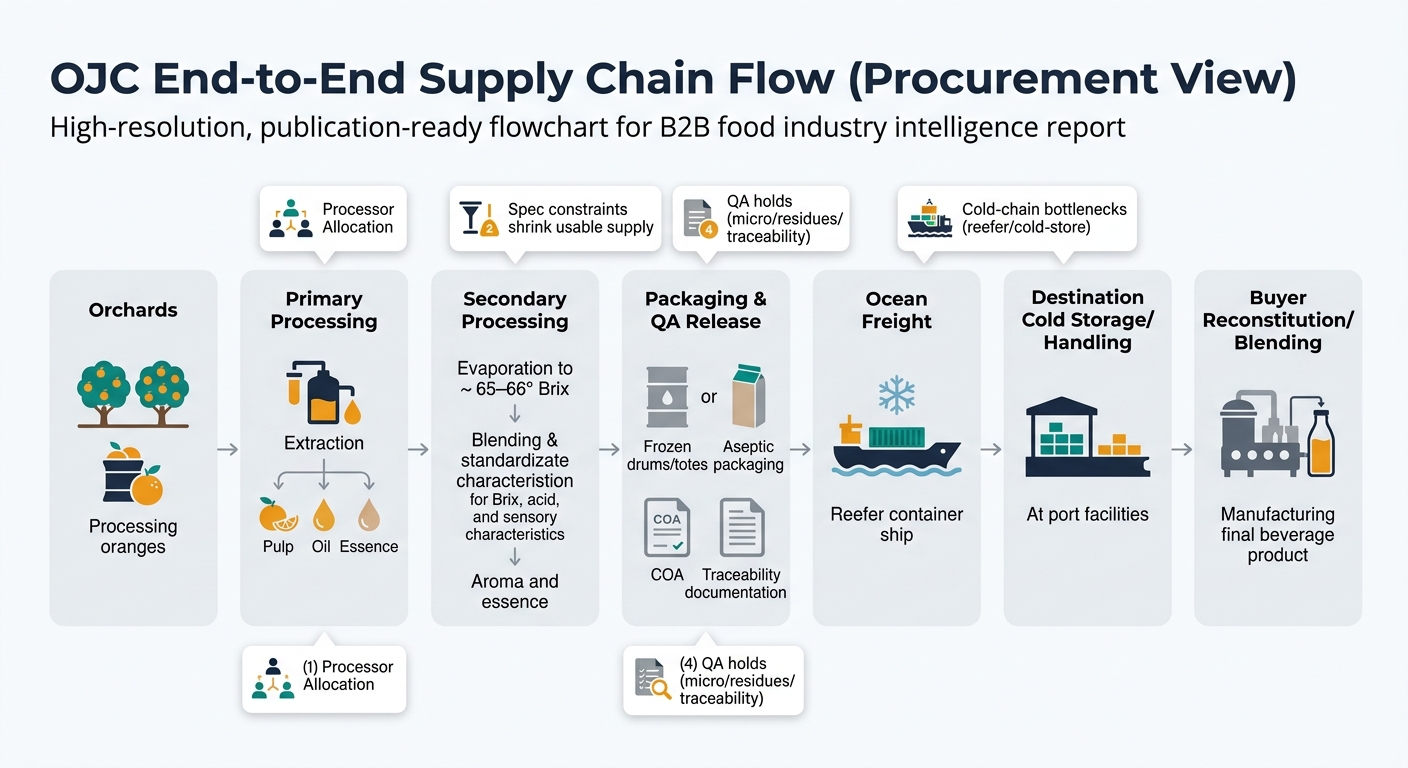
Key insight: In OJC, your “price” is a stack of fruit economics + processing throughput + energy + cold-chain logistics + quality/compliance overhead. When supply is tight, the bottleneck shifts from “fruit availability” to allocation at processors and cold-chain capacity, changing who has pricing power.

2.1 Upstream / Raw Material (Orchards & Harvest)

What’s really happening

  • Fruit cost is the largest single driver in most conditions.
  • Disease (notably HLB/citrus greening) increases orchard costs and reduces yield over multiple seasons.

Cost drivers you can actually influence (indirectly)

  • Origin mix (Brazil vs. Mexico vs. Mediterranean vs. South Africa/Argentina)
  • Program type (spot vs. seasonal program vs. multi-year supply relationship)
  • Quality program requirements (residue limits, certifications, identity preservation)

Procurement implication: When fruit is structurally constrained, the “should-cost” anchor cannot be built from last year’s contract—use crop/production signals and origin diversification rules instead.

2.2 Primary Processing (Extraction, Separation, Pasteurization)

What’s really happening

  • Extraction economics depend on juice yield per ton and plant uptime during peak crush.
  • Byproducts (oil/essence/peel) can offset some economics, but do not eliminate fruit-driven volatility.

Cost drivers

  • Plant labor, sanitation, water, maintenance
  • Yield variability (weather impacts fruit size/juice content)

Procurement implication: During tight markets, suppliers may prioritize customers with stable offtake and operationally simple specs.

2.3 Secondary Processing (Evaporation to Concentrate + Standardization)

What’s really happening

  • Concentration is energy-intensive (steam/electricity) and can become capacity constrained.
  • Standardization/blending is where suppliers protect consistency: brix (often corrected/managed alongside acidity), acidity (citric), and microbiological limits are managed via blending and process control.
  • Typical commercial references place FCOJ around ~65° Brix (commonly ~65–66° Brix). [1]

Cost drivers

  • Energy and throughput
  • Losses and rework risk (quality deviations)
  • Allocation premiums when capacity is tight

Procurement implication: If you demand narrow sensory or chemical tolerances without giving forecast stability, expect higher premiums and stricter allocation.

2.4 Packaging & QA Release (Frozen Drums/Totes vs. Aseptic)

What’s really happening

  • Frozen formats require controlled freezing, liners, cold storage; aseptic reduces cold-chain but increases aseptic packaging/handling complexity.
  • QA release is not “paperwork”—it’s where holds occur (micro, residues, traceability gaps).

Cost drivers

  • Packaging materials (drums/liners/totes), QA testing, certifications
  • Hold time risk (inventory carrying + service risk)

Procurement implication: Your total cost is sensitive to nonconformance risk (rejections, downgrades, reblends) more than many teams model.

2.5 Logistics & Distribution (Ocean Freight, Cold Storage, Domestic Transfer)

What’s really happening

  • Frozen OJC is reefer- and cold-store-dependent; disruptions show up as delays, temperature excursions, demurrage, and inventory imbalance.

Cost drivers

  • Ocean freight + insurance
  • Destination cold storage fees and handling
  • Working capital (seasonal builds + long lead times)

Procurement implication: Incoterms and who controls cold-chain nodes can swing outcomes as much as unit price.

2.6 Buyer-Side Reconstitution / End Use

What’s really happening

  • Concentrate variability hits you as: blending losses, flavor adjustments, higher essence/oil management, or finished-product QC failures.

Cost drivers

  • Yield-to-finished-product
  • Downtime or rework from off-spec sensory

Procurement implication: “Cheaper” concentrate can be more expensive after line losses + QA interventions.

Product-level cost breakdown (illustrative, procurement-oriented)

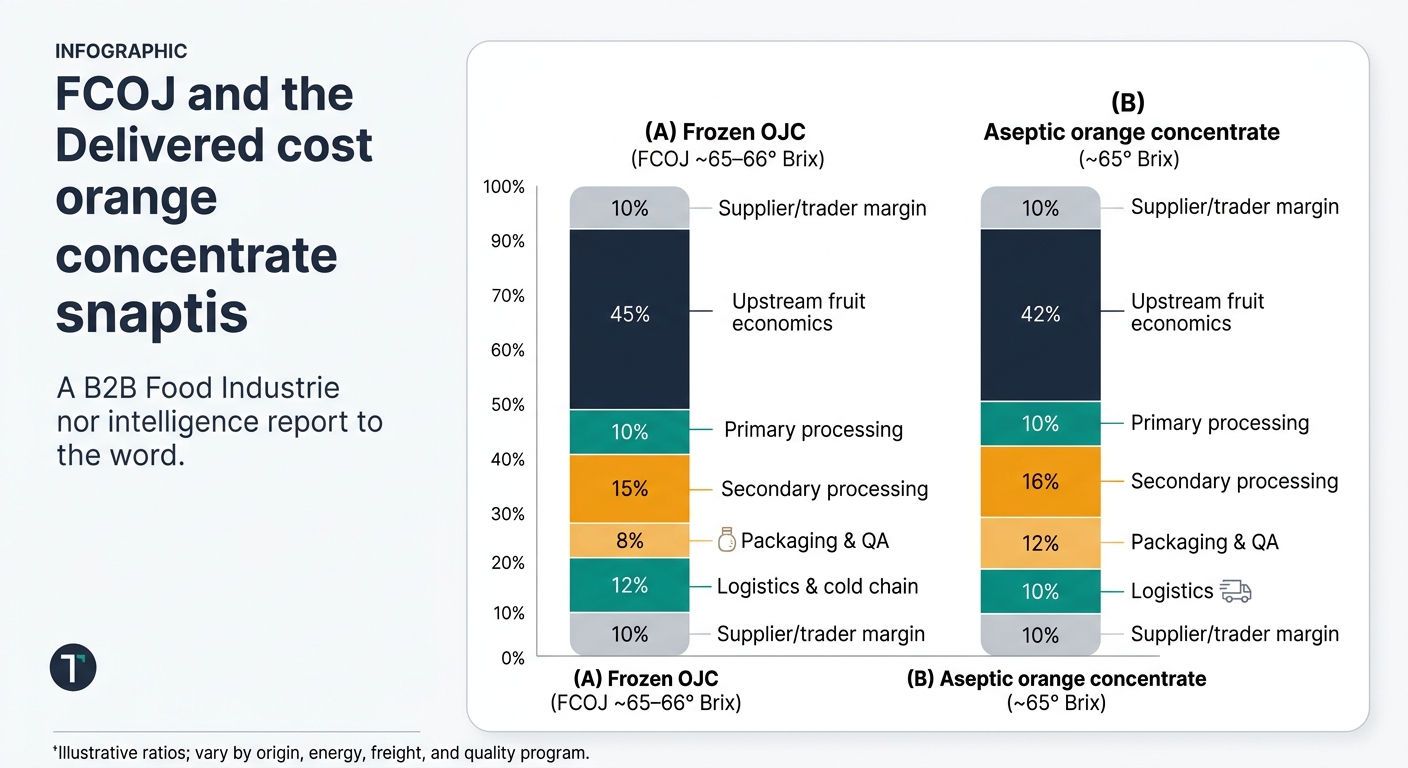
Modeled shares as % of final delivered cost to a U.S. beverage plant. These ratios vary by origin, contract tightness, energy/freight, and quality program.

Two 100% stacked bars comparing delivered cost ratios for Frozen OJC (FCOJ ~65–66° Brix) and Aseptic orange concentrate (~65° Brix), with segments labeled for Upstream fruit economics, Primary processing, Secondary processing, Packaging & QA, Logistics & cold chain (or Logistics for aseptic), and Supplier/trader margin using the illustrative percentages shown, plus a footnote noting ratios vary by origin, energy, freight, and quality program.

A) Frozen OJC (FCOJ ~65–66° Brix), industrial bulk

Supply Chain Node Cost Ratio (% of Final Cost) Notes
Upstream fruit economics 45% Dominant driver in most cycles; disease/weather amplify structural floor
Primary processing 10% Extraction yield + plant uptime
Secondary processing 15% Evaporation energy + standardization/blending
Packaging & QA 8% Drums/liners + COA release holds
Logistics & cold chain 12% Reefer + destination cold storage + handling
Supplier/trader margin 10% Widens in tight allocation markets

B) Aseptic orange concentrate (~65° Brix), ambient transport

Supply Chain Node Cost Ratio (% of Final Cost) Notes
Upstream fruit economics 42% Similar fruit exposure
Primary processing 10% Comparable extraction economics
Secondary processing 16% Similar energy + tighter micro control
Packaging & QA 12% Aseptic packaging premium + handling controls
Logistics (less cold chain) 10% Lower cold-store dependence but still ocean + inland
Supplier/trader margin 10% Depends on availability and program stability

C) Standardized/blended concentrate program (tight sensory + brix/acid window)

Supply Chain Node Cost Ratio (% of Final Cost) Notes
Upstream fruit economics 40% Blending flexibility can reduce fruit-grade penalties
Primary processing 10%
Secondary processing 18% More blending, rework risk, aroma/essence management
Packaging & QA 10% More frequent testing, tighter release criteria
Logistics & cold chain 12% Similar to frozen if FCOJ
Supplier/trader margin 10% Premium for consistency and service

3) The Structural Fact That Drives Everything: Correlated Risk + Concentrated Control

Key structural fact: The global OJC market is exposed to correlated shocks (weather + disease) and concentrated processing/export control.

What that means for a procurement manager:

  • When Brazil has a disruption, it’s not “one supplier’s issue.” It’s a market-wide repricing and often an allocation event.
  • Brazil’s dominance is repeatedly cited at roughly ~75–85% of world orange juice exports (definition/year dependent), so diversification is real risk reduction—not a checkbox. [2]
  • The U.S. (especially Florida) has faced a long decline tied to disease and storms; USDA/NASS reporting shows extremely low Florida orange volumes in 2024/25 (e.g., 11.6 million boxes forecast in April 2025). [4]

4) The Critical Insight: Why Your “Price” and Your “Supply Security” Decouple

In OJC, price and availability can move independently in ways that surprise non-specialists.

Why the decoupling happens

  1. Allocation economics: In tight years, suppliers protect strategic relationships. A buyer can pay “market” and still get cut.
  2. Spec tightness: A narrow sensory target or strict brix/acid window can reduce usable supply even when total production exists.
  3. Form-factor constraints: Frozen vs. aseptic is not interchangeable overnight—packaging lines, micro controls, and buyer-side handling differ.
  4. Cold-chain bottlenecks: Even when product exists, reefer/cold-store constraints can delay delivery and create effective shortages.

Procurement takeaway: A sourcing strategy that optimizes only unit price is fragile. You need a risk-adjusted landed-cost view that values service continuity.

5) Where Procurement Teams Commonly Misstep (Especially if They’re New to Citrus)

  1. Treating OJC like a normal commodity with many substitutable origins. In practice, origin concentration and correlated shocks reduce substitutability.
  2. Over-indexing on last contract price. In citrus, structural shifts (HLB, storm damage, acreage loss) can reset the floor.
  3. Underestimating qualification lead time. New suppliers require QA, samples, trials, documentation, and often customer-specific blending alignment.
  4. Writing contracts that ignore allocation reality. “Volume commitment” without enforceable service levels, clear remedies, and allocation language can fail when the market tightens.
  5. Not measuring concentration. Teams often don’t quantify: % volume by origin, by processor group, by port/cold-store node.

6) What Changes When You Run OJC With Procurement Intelligence (Not Just Supplier Quotes)

This is not about “more data.” It’s about changing the decision process so you can act earlier and document why.

Decision shift #1: From reactive buying to trigger-based coverage

  • Track origin-level disruption signals (weather, disease, storm impacts, port constraints) and translate them into buy-forward / inventory / diversification triggers.
  • Outcome: fewer emergency spot buys and reduced probability of allocation-driven outages.

Decision shift #2: From incumbent dependence to a managed qualification pipeline

  • Maintain a living map of producers, blenders, traders, and toll processors by origin and pack format.
  • Run a standing pipeline: paper qualification → samples → pilot runs → approved backup.
  • Outcome: shorter time-to-switch and lower premium paid during disruptions.

Decision shift #3: From “unit price” to risk-adjusted landed cost (TCO)

  • Normalize supplier offers by spec, pack, Incoterms, lead time, and service history signals.
  • Outcome: better negotiation fact base and fewer hidden costs (cold storage, demurrage, rework).

Decision shift #4: From tribal knowledge to audit-ready governance

  • Standardize supplier scorecards and decision logs: why chosen, what risks accepted, what mitigations funded.
  • Outcome: faster internal approvals and defensible decisions during volatility.

7) Strategic Use Cases Procurement Leaders Actually Run in OJC

  1. Portfolio design with concentration limits
  2. Set rules like: max % by origin, max % by processor group, minimum number of qualified suppliers.
  3. Tie to service level targets (fill rate, OTIF, temperature compliance).
  4. Contracting strategy: indexed vs fixed vs hybrid
  5. Use market monitoring to decide when to lock fixed, when to index, and where to keep optionality.
  6. Align with Finance on volatility tolerance and working-capital constraints.
  7. Spec flexibility playbook (with QA guardrails)
  8. Pre-negotiate acceptable ranges for brix/acid ratio, pulp level, aroma/essence approach.
  9. Use this to expand usable supply during tight markets without compromising brand.
  10. Cold-chain risk management
  11. Dual cold-store options, reefer contingency, and temperature excursion protocols.
  12. Incoterms and responsibilities aligned to who can actually control the risk.
  13. Supplier performance & allocation readiness
  14. Monitor early indicators of allocation risk and trigger executive-to-executive escalation before the cut happens.

8) Why This Matters Beyond OJC (Examples Your Team Likely Also Buys)

OJC is a clean example of a broader procurement truth: when supply is biologically constrained and geographically concentrated, intelligence beats negotiation tactics.

Comparable categories where the same playbook applies:

  • Cocoa / chocolate ingredients: correlated weather and origin concentration; quality specs and sustainability requirements constrain supply.
  • Coffee: climate volatility + logistics; differentials by grade and origin; long qualification cycles for flavor consistency.
  • Dairy powders (WMP/SMP): energy inputs, seasonality, and tight specs; contract coverage vs spot exposure decisions matter.
  • Tomato paste / puree: processing capacity and crop cycles; brix and color specs drive usable supply.

In each case, teams win by:

  • mapping supply concentration,
  • pre-qualifying alternates,
  • using trigger-based coverage,
  • and documenting governance.

9) Why This Example Is So Persuasive for Procurement Stakeholders

Orange juice concentrate forces clarity because it exposes the limits of “three quotes and a negotiation.”

What leaders see quickly in OJC

  • Cost control is about volatility management, not just cents per pound.
  • Continuity of supply is engineered through qualification pipelines, spec flexibility, and logistics control points.
  • Governance matters because allocation events create exceptions (premiums, expedited freight, spec deviations) that must be approved and auditable.

For procurement and sourcing management, OJC becomes a repeatable template: build a fact base, define triggers, diversify intelligently, and make decisions that are defensible under stress.

Tridge Eye Data Intelligence Solution

Make Faster, Data-Driven Sourcing Decisions

The insights in this report are just the starting point. Tridge Eye is the data intelligence solution that gives procurement and sourcing leaders real-time market signals, price benchmarks, and supply risk alerts — so you can act before the market moves.

Explore Tridge Eye →

References

  1. usitc.gov
  2. farmprogress.com
  3. ers.usda.gov
  4. nass.usda.gov
Subscribe
By subscribing you agree to with our Privacy Policy and provide consent to receive updates from our company.
Thank you! Your submission has been received!
Oops! Something went wrong while submitting the form.
Subscribe to receive the latest blog posts, updates, promotions, and announcements from Tridge.