INDUSTRY TRENDS

Orange Juice Concentrate (FCOJ/OJC) Sourcing Guide: Cost Drivers, Export Concentration, and Procurement Levers That Hold Up in Volatility

Author
Team Tridge
DATE
March 20, 2026
9 min read
orange-juice-concentrate Cover
Tridge Eye Data Intelligence Solution

This report is powered by Tridge Eye Data Intelligence.

Every data point, price signal, and supply risk insight in this analysis comes from the same platform that procurement and sourcing leaders worldwide rely on daily. As you read, consider what this level of market intelligence could do for your sourcing decisions.

Explore Tridge Eye →

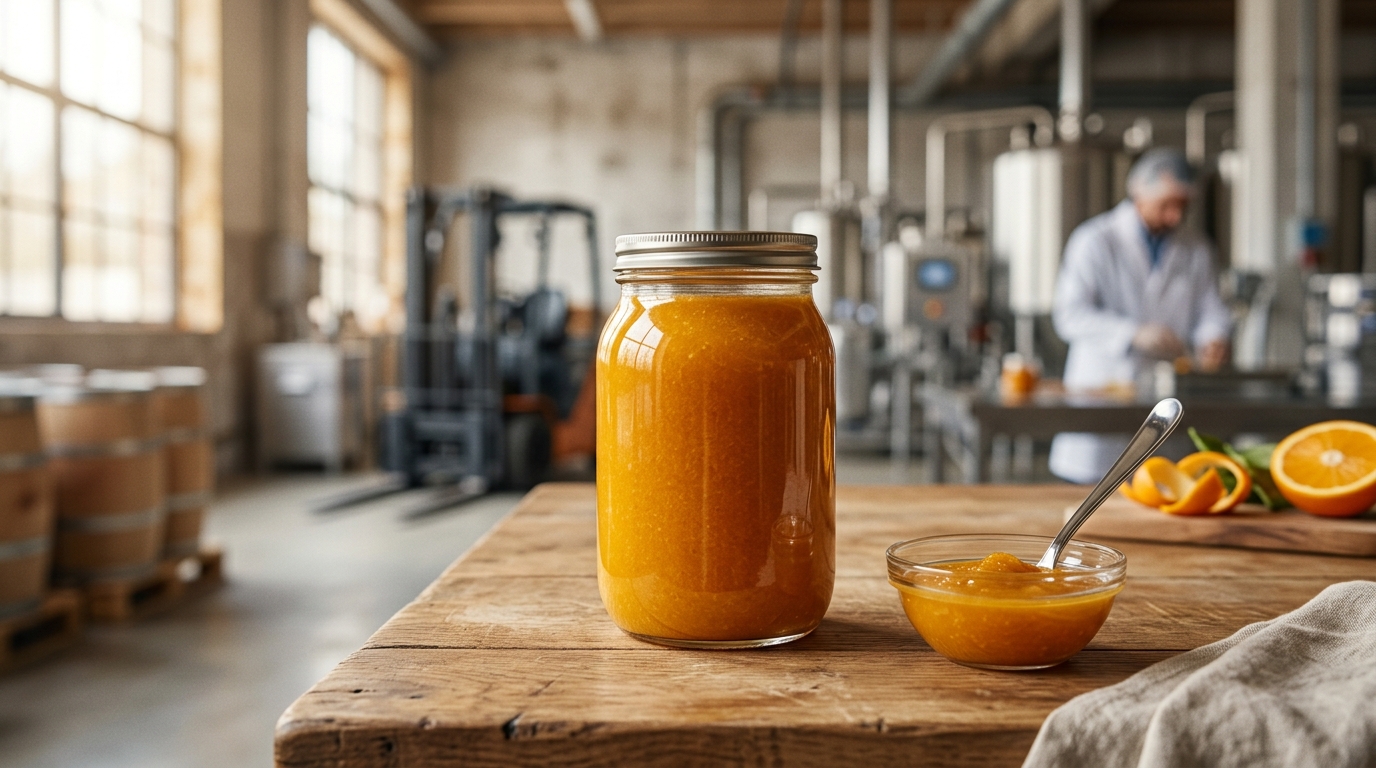
This guide is written for procurement and sourcing leaders who are strong category managers but don’t live in citrus every day. The goal is to translate how the orange-juice-concentrate market actually works (origins, processors, inventories, specs, cold chain) into decisions you can defend: what to buy, from whom, when, under what terms, and with what contingency.

Executive Summary

  • Export concentration is the headline risk: Brazil is widely cited as the dominant orange juice exporter, often ~75%+ of global exports depending on definition/year—meaning “global oranges” is not the same as “tradable juice.” [1]
  • Florida is not a swing supplier anymore: USDA/NASS reported Florida’s 2024/25 all-orange forecast at ~12.2 million boxes (historic lows vs. prior decades), reinforcing that U.S. supply cannot reliably buffer global shocks. [2]
  • Inventory is a market-moving variable: CitrusBR’s independently audited snapshot reported 146.3k metric tons of member-held global inventories (FCOJ-equivalent at 66° Brix) as of June 30, 2025, still described as among the lowest historical levels. [3]
  • Specs and format drive optionality: “Cheapest $/lb solids” can be a false economy if your spec (Brix/acid, pulp, sensory, certifications) and format (frozen vs aseptic) restrict switching.
  • Procurement governance beats price guessing: Separate signals into (1) market direction, (2) physical availability, (3) spec compliance; pre-agree triggers for coverage, alternates, and inventory.

Key Insights

(Analyzed at: Mar, 2026)

  • Strategy: Hold
  • Reliability: Medium
  • Potential Saving: 4% ~ 10%
  • Insight: With Brazil still the export “engine” (often cited around ~75%+ of global exports) and audited inventories only periodically visible, the best near-term value lever is not trying to time spot perfectly—it’s tightening coverage governance: (a) lock core volume with volume bands and clear Incoterms/temperature-risk transfer, (b) keep flex volume for staged buys, and (c) accelerate alternate qualification so you can switch lanes/origins without paying disruption premiums. This approach typically reduces avoidable price variance and emergency buys more reliably than directional calls when inventories and crop/yield signals can shift sentiment quickly. [1]

1) What You’re Actually Buying: The Ground Truth of the OJC Supply Chain

Orange-juice-concentrate (OJC/FCOJ) looks like a “simple” ingredient on a BOM. In reality, it is a scale-driven agro-industrial system where a few origins and a few processors set the tone for global availability, lead times, and pricing.

Supply chain flow (practical view for procurement):

  1. Growers / Groves (processing oranges) → fruit is allocated between fresh market and processing.
  2. Extraction (single-strength juice + co-products) → juice is extracted; peel oil/essences/pulp streams are captured.
  3. Concentration (FCOJ ~65–66° Brix) or Aseptic Concentrate → evaporation is energy-intensive; aroma recovery may occur.
  4. QA + Packaging → frozen drums/totes or aseptic bag-in-box; authenticity/residue/micro become gating items.
  5. Cold chain + Ocean freight + Import handling → reefer capacity, port reliability, and storage matter.
  6. Blending / Reconstitution at buyer or co-man → origins/crops are blended to hit sensory and analytical specs.
A left-to-right flowchart showing the end-to-end orange juice concentrate supply chain with procurement-relevant callouts from growers/groves through extraction, concentration (FCOJ or aseptic), QA and packaging gates (COA, micro, residue, authenticity), cold chain and ocean freight with Incoterms/temperature-risk transfer, and buyer blending/reconstitution; includes small icons for temperature control, lab testing, and inventory holding.

Two structural realities you should assume unless proven otherwise:

  • Export supply is highly concentrated in Brazil, and Brazil is frequently cited as responsible for roughly ~75%+ of global orange juice exports (figures vary by definition and year). [1]
  • Florida is no longer a “reliable swing supplier.” USDA/NASS forecasts for 2024/25 Florida all oranges were around 12.2 million boxes (historic lows), reinforcing that the U.S. cannot consistently offset global export shocks. [2]

What this means for a sourcing leader:

  • Your biggest risks are correlated (weather + disease + processing utilization + logistics) and can move the market quickly.
  • Your “supplier choice” is often also an origin choice and a cold-chain choice.

2) Where the Money Really Goes: Cost & Margin Build-Up by Supply-Chain Node

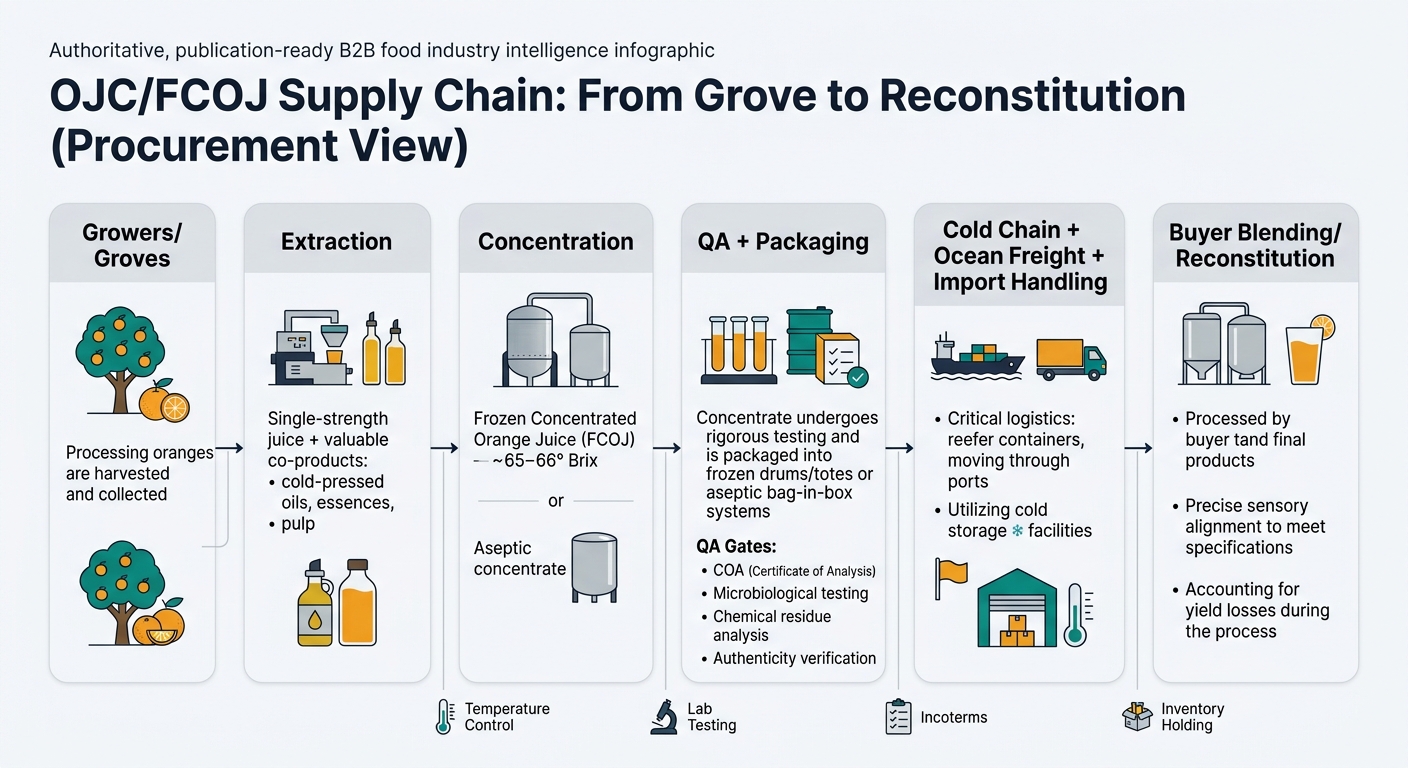
Below is the procurement-relevant cost logic: which levers move cost at each node, and what you can (and cannot) influence.

Node 1 — Groves / Fruit Supply (Processing Oranges)

Key insight: Fruit cost is the largest single cost driver, but it’s not just “farmgate price.” It’s yield and survivability under disease pressure.

What drives cost

  • Grove operating intensity (irrigation, nutrition, crop protection)
  • Disease pressure (HLB/greening) increasing cost per box and lowering juice quality/yield
  • Harvest labor/mechanization and weather disruption

Procurement levers

  • Diversify origin exposure (where spec allows)
  • Contract structures that avoid being fully exposed to spot fruit shocks

Florida’s structural decline is widely linked to citrus greening and repeated weather events; USDA reporting continues to show extremely low output levels versus historical norms. [4]

Node 2 — Extraction (Single-Strength Juice + Co-products)

Key insight: Extraction economics are partially subsidized by co-products (orange oil/essences/pulp). When co-product values weaken, processors often need a higher netback from juice.

What drives cost

  • Throughput and plant utilization (fixed costs spread)
  • Juice yield per ton of fruit (varies by fruit condition)
  • Co-product recovery efficiency

Procurement levers

  • Ask for transparency on yield assumptions and co-product credits (where commercially feasible)
  • Compare suppliers on operational stability (capacity signals, outage history)

Node 3 — Concentration (FCOJ / Aseptic Concentrate)

Key insight: Concentration is energy- and equipment-intensive. Tight years create a double hit: fruit scarcity + higher unit processing cost due to suboptimal utilization.

What drives cost

  • Evaporation energy (steam/electricity)
  • Aroma recovery / standardization steps
  • Shrink and handling losses

Procurement levers

  • Consider format strategy (frozen vs. aseptic) as a risk-and-cost decision, not a technical afterthought
  • Build volume flexibility bands to avoid paying “panic premiums”

Node 4 — QA + Packaging (Frozen drums/totes or aseptic bags)

Key insight: QA is not overhead; it is a market-access gate. Residues, authenticity, and micro failures can turn “lowest price” into a write-off.

What drives cost

  • Packaging materials (drums/totes, aseptic liners)
  • Lab testing: Brix/acid, micro, residues, authenticity/adulteration screening
  • Documentation and traceability

Procurement levers

  • Define spec guardrails vs flex points (e.g., pulp level, color range) to expand qualified supply
  • Require COAs + retain samples + define dispute protocol (who pays retest, timelines)

USDA/AMS provides grade/standard references for orange juice from concentrate that can anchor specification conversations (but it does not replace your product spec and lab validation). [5]

Node 5 — Logistics: Cold Chain, Freight, Storage, Demurrage

Key insight: For frozen concentrate, logistics is a quality-preservation system, not just a cost line.

What drives cost

  • Reefer ocean freight and availability
  • Cold storage capacity and power reliability
  • Port congestion/demurrage and transit variability

Procurement levers

  • Incoterms discipline (clarify where temperature-risk transfers)
  • Safety stock calibrated to lead time variability (not average lead time)

Node 6 — Import/Distribution + Buyer-Side Blending/Reconstitution

Key insight: Many buyers under-budget the internal cost of “making concentrate usable”: blending, sensory alignment, and yield losses.

What drives cost

  • Working capital (inventory holding)
  • Blend losses and rework
  • Changeover costs at co-man/bottler

Procurement levers

  • Allocate volume by supplier tier (core vs flex) with governance
  • Track “total landed + conversion cost,” not just CIF/FOB
A stacked bar chart with three vertical bars labeled (A) FCOJ 65–66° Brix (Frozen), (B) Aseptic Concentrate, and (C) Single-Strength/NFC Base. Each bar is segmented by supply-chain node using the article’s illustrative ratios: Fruit/Grove economics; Extraction & Primary Processing; Concentration/Processing (or Extraction & Stabilization for NFC); Packaging & QA; Freight/Cold Chain/Storage; and Supplier/Trader + Import/Distribution margin. Includes a legend with consistent colors and a footnote noting the ratios are illustrative and vary by origin, terms, energy/freight, format, and spec strictness.

Product-level cost breakdown (illustrative ratios)

Modeled % of final delivered cost to your facility. Actual ratios vary by origin, contract terms, energy/freight, format, and spec strictness.

A) Frozen Concentrated Orange Juice (FCOJ) ~65–66° Brix (bulk frozen drums/totes)

Supply Chain Node Cost Ratio (% of Final Cost) Notes
Fruit / grove economics 45% Yield + disease pressure are decisive.
Extraction & primary processing 10% Throughput and co-product credits matter.
Concentration (evaporation/freezing) 15% Energy + utilization + shrink.
Packaging & QA 7% Drums/totes + lab/testing + documentation.
Cold chain + freight + storage 13% Reefer premiums, cold storage, demurrage.
Supplier/Trader + import/distribution margin 10% Depends on route-to-market and credit terms.

B) Aseptic Orange Juice Concentrate (bulk aseptic bag-in-box)

Supply Chain Node Cost Ratio (% of Final Cost) Notes
Fruit / grove economics 45% Similar fruit exposure.
Extraction & primary processing 10% Similar.
Concentration + aseptic processing 17% More packaging/sterilization complexity.
Packaging & QA 9% Aseptic materials + validation.
Freight + storage (reduced cold-chain) 9% Typically less cold-chain dependence.
Supplier/Trader + import/distribution margin 10% Commercial structure dependent.

C) Single-strength NFC base (industrial, chilled/frozen depending on system)

Supply Chain Node Cost Ratio (% of Final Cost) Notes
Fruit / grove economics 55% Higher fruit intensity per unit solids.
Extraction & stabilization 15% More sensitive to quality and handling.
Packaging & QA 8% Often tighter sensory/handling requirements.
Cold chain + freight + storage 12% Product-dependent.
Supplier/Trader + import/distribution margin 10% Market dependent.

3) The Structural Fact That Explains Most “Surprises”: Export Supply Is Not the Same as Production

A common misunderstanding: “If the world produces a lot of oranges, juice supply is fine.”

The structural fact:Internationally tradable juice is constrained by (a) where industrial processing capacity is concentrated and (b) which origins export versus consume domestically.

  • Brazil is repeatedly cited as the dominant export engine for orange juice, often around ~75%+ of global exports depending on product definition and year. [1]
  • The U.S. can be a meaningful producer in some years, but much of its juice is oriented to domestic use; Florida’s decline further reduces “export swing.” [6]

Procurement implication: Your risk is less “global oranges” and more Brazil crop + Brazil processing + export logistics + inventory drawdowns.

CitrusBR’s audited inventory releases are one of the clearest public signals on Brazilian orange juice stocks (reported in FCOJ-equivalent at 66° Brix). CitrusBR reported 146.3k metric tons as of June 30, 2025 for member-held global inventories (FCOJ-equivalent). [3]

4) The Critical Insight: Why Your Price and Your Risk Can Move in Opposite Directions

In OJC, procurement teams often expect: higher risk → higher price; lower risk → lower price. Reality is messier.

Why prices can “disconnect” from your perceived supply situation:

  1. Inventory buffers are opaque and lumpy
  2. Market can rally even when shipments look “normal” if inventories are thin.
  3. Conversely, prices can soften on inventory rebuild even if headlines stay negative.
  4. CitrusBR audited inventory snapshots can shift sentiment. [3]
  5. Quality and yield are separate from fruit volume
  6. Disease and weather can reduce juice yield and Brix, changing solids output even if box counts look less dramatic.
  7. Financial referencing vs physical reality
  8. Many stakeholders anchor to futures headlines. The ICE FCOJ contract is standardized at 15,000 pounds of orange juice solids, which is useful as a reference but not a substitute for your spec-specific physical market. [7]

Procurement implication: You need a governance model that separates:

  • Market direction signals (price context)
  • Physical availability signals (stocks, capacity, lead times)
  • Spec compliance signals (COA trends, sensory variance, residue risk)

5) The Predictable Mistakes Procurement Teams Make in OJC (Even When They’re Good at Other Categories)

  1. Treating OJC like a substitutable commodity
  2. Tight specs (sensory, Brix/acid ratio, pulp) reduce switching ability.
  3. Over-optimizing unit price instead of coverage risk
  4. A “win” on $/lb solids can be erased by one expedite, one line stoppage, or one quality rejection.
  5. Single-origin dependency hidden inside “multi-supplier”
  6. Two suppliers can still be the same origin, same processors, same ports.
  7. Late qualification of alternates
  8. Waiting for disruption to qualify alternates forces you into bad terms and higher failure risk.
  9. No explicit decision rights / triggers
  10. Teams argue during volatility because thresholds were never pre-agreed (coverage %, price bands, inventory triggers).

6) What an Intelligence-Driven Approach Changes (and What It Still Can’t Do)

This is where procurement intelligence helps—not by predicting prices perfectly, but by making decisions earlier, with clearer trade-offs and audit-ready rationale.

Decisions it improves (practical outcomes)

  • Allocation & diversification:
  • Map your spend and volume by supplier → processor → origin → port lane to expose hidden concentration.
  • Contracting approach:
  • Choose among staged buys, indexed components, and volume bands based on market + risk signals.
  • Early-warning response:
  • Trigger actions (reserve capacity, pull forward shipments, increase safety stock, activate alternates) when risk indicators trip.

What must still be validated by the buyer (non-negotiables)

  • Quality and authenticity: lab testing, retain samples, sensory panels
  • Compliance: certifications, residue/MRL compliance, traceability documents
  • Supplier assurance: audits, food safety verification, business continuity reviews

Governance-ready outputs you can take to leadership:

  • Contract coverage %, inventory days, supplier/origin concentration %, on-time-in-full trend, and “savings vs market movement” narrative.

7) Strategic Use Cases (Designed for Procurement & Sourcing Management)

Use case A — “Set coverage without gambling on spot timing”

Management decision: How much volume to lock for the next 3–9 months, and under what pricing structure.

  • Option 1: Higher coverage / lower regret (lock more, accept less upside)
  • Option 2: Staged coverage (ladder buys + volume bands)
  • Option 3: Core + flex allocation (stable suppliers for base load; opportunistic for flex)

Metrics to report: budget variance, contract coverage %, emergency spot buys.

Use case B — “Pre-qualify alternates before the shock”

Management decision: Which alternates to qualify now (even if not cheapest) to reduce time-to-switch.

  • Build a shortlist by format (frozen/aseptic), spec capability, lane, and lead time
  • Run lightweight qualification: COA review + pilot + sensory + micro/residue screens

Metrics to report: time-to-switch (days), supplier/origin concentration %, service level.

Use case C — “Make supplier performance governable (not anecdotal)”

Management decision: Which suppliers are strategic vs leverage vs bottleneck.

  • Benchmark delivery reliability, disruption exposure by lane/origin, and responsiveness
  • Standardize QBR scorecards and corrective actions

Metrics to report: OTIF, claims rate, corrective action closure rate.

8) Why This Intelligence Logic Transfers to Other Categories You Likely Buy

OJC is an extreme example of origin concentration + biological risk + processing bottlenecks—but the same decision logic applies to other procurement categories common in beverage/food portfolios:

  • Coffee (arabica/robusta): weather volatility + origin concentration + logistics; coverage strategy and diversification matter.
  • Cocoa: structural supply constraints and policy/regulatory shifts; need early-warning and supplier dependency mapping.
  • Dairy powders (e.g., skim milk powder): energy costs + seasonality + export flows; indexation and coverage discipline.
  • Tomato paste / fruit purées: processing capacity constraints and quality specs; alternates must be pre-qualified.

The transferable lesson: price intelligence alone is insufficient. You need a combined view of physical availability, quality/compliance gates, and supplier/origin concentration.

9) Why OJC Is a Powerful “Proof Category” for Procurement Leadership

If your governance model works in OJC, it usually works everywhere else—because OJC forces clarity on the hard parts of procurement:

  • Decision clarity: what to buy, from whom, when, under what terms, with what contingency.
  • Trade-off transparency: cost vs continuity vs spec rigidity vs working capital.
  • Auditability: documented triggers, approvals, and rationale (not “we felt the market”).
  • Resilience by design: alternates and playbooks built before the disruption premium shows up.

In short, OJC rewards teams that treat sourcing as a managed risk-and-coverage portfolio, not a sequence of spot negotiations.

Tridge Eye Data Intelligence Solution

Make Faster, Data-Driven Sourcing Decisions

The insights in this report are just the starting point. Tridge Eye is the data intelligence solution that gives procurement and sourcing leaders real-time market signals, price benchmarks, and supply risk alerts — so you can act before the market moves.

Explore Tridge Eye →

References

  1. lemonde.fr
  2. nass.usda.gov
  3. citrusbr.com
  4. cbsnews.com
  5. ams.usda.gov
  6. ers.usda.gov
  7. interactivebrokers.com
Subscribe
By subscribing you agree to with our Privacy Policy and provide consent to receive updates from our company.
Thank you! Your submission has been received!
Oops! Something went wrong while submitting the form.
Subscribe to receive the latest blog posts, updates, promotions, and announcements from Tridge.