INDUSTRY TRENDS

Mozzarella String Cheese Sourcing (2026): Cost Drivers, Capacity Reality, and Smarter Award Decisions

Author
Team Tridge
DATE
April 9, 2026
10 min read
mozzarella-string-cheese Cover
Tridge Eye Data Intelligence Solution

This report is powered by Tridge Eye Data Intelligence.

Every data point, price signal, and supply risk insight in this analysis comes from the same platform that procurement and sourcing leaders worldwide rely on daily. As you read, consider what this level of market intelligence could do for your sourcing decisions.

Explore Tridge Eye →

Mozzarella string cheese procurement looks straightforward (“refrigerated dairy snack”), but award and contract outcomes are usually decided by a handful of operational constraints: milk components and yield, plant and packaging-line capacity, and cold-chain execution. This guide is written for procurement & sourcing managers who are strong buyers in other categories but want a decision-ready mental model for string cheese—what to ask suppliers, what signals to track, and how to document trade-offs across cost, continuity, quality, and governance.

Executive Summary

  • String cheese is capacity-constrained by specific lines, not just “mozzarella supply.” Packaging lines (individual wrap) and cold storage/shipping windows commonly become the bottleneck even when bulk cheese markets look comfortable.
  • Your true cost stack is “milk/components + make + packaging + cold chain,” and each layer moves on different clocks (spot vs quarterly/annual resets).
  • Milk “price” is incomplete—components drive yield. Butterfat + protein levels materially change pounds of cheese per pounds of milk; moisture targets also change yield and cost.
  • Stretch performance is process-window sensitive. Pasta-filata curd must reach a stretching pH window (often cited roughly ~4.9–5.4; many practical references cluster around ~5.2–5.3).
  • RTE exposure expectations matter. If product is exposed to the environment prior to packaging, regulators emphasize robust preventive controls and verification such as environmental monitoring for Listeria control in RTE facilities.
  • Best-practice awards weight reliability during allocation periods. Lowest unit price often correlates with higher hidden TCO (short ships, premium freight, claims, chargebacks).

Key Insights

(Analyzed at: Apr, 2026)

  • Strategy: Hold
  • Reliability: Medium
  • Potential Saving: 3% ~ 8%
  • Insight: In 2026, the most repeatable savings in string cheese are less about “calling” the milk market and more about tightening the award/contract mechanics around packaging-line constraints and service economics. Hold on major supplier switches unless you already have (a) validated alternate packaging formats/films and (b) pre-approved QA/spec equivalency—then pursue 3–8% TCO improvement by (1) splitting awards across at least two sites/lines (not just corporate entities), (2) indexing only the milk/component layer while fixing or capping packaging + logistics adders, and (3) adding allocation language and OTIF/claims governance that monetizes service failures.

1) What You’re Really Buying: The Ground Truth Supply Chain (String Cheese)

Mozzarella string cheese looks like a simple refrigerated snack, but procurement outcomes are driven by a few non-obvious realities:

  • It’s a pasta-filata product: “stringability” is engineered through controlled acidification and stretching; small process drift changes peelability, bite, and whey-off.
  • It’s milk-component economics, not just “milk price.” Cheese yield and cost depend heavily on butterfat + protein in the milk, and how much moisture the finished stick is allowed to carry.
  • Plants matter more than brands: capacity is concentrated in large, automated cheese plants near milk sheds; a single-plant disruption can remove meaningful volume from the market.
  • Cold chain is not optional: temperature excursions show up as texture defects, mold claims, and retailer chargebacks.
  • Packaging is a critical constraint: individually wrapped sticks require specific barrier films and seal integrity—packaging availability and line uptime can be the bottleneck even when cheese is available.
A left-to-right (or top-to-bottom) flow diagram showing the end-to-end string cheese supply chain with 6–7 labeled nodes: (1) Raw milk intake & standardization (fat/protein components), (2) Pasteurization + curd make + whey separation, (3) Stretching/forming (pasta-filata) with a callout for the stretch pH window (~4.9–5.4; typical target ~5.2–5.3), (4) Brining/cooling, (5) Packaging & QA (individual wrap line + seal integrity + coding + metal detection) with a bottleneck icon, (6) Cold storage + reefer transport (FEFO) with a temperature-control icon, (7) Customer/DC/retail programs. Includes constraint tags under likely bottlenecks such as packaging line uptime/film availability, cold storage capacity, and shipping windows.

End-to-end flow (what to map in sourcing):

  1. Upstream / Raw Material: raw milk (standardized with cream/skim; sometimes solids)
  2. Primary Processing: pasteurization → curd make → whey separation
  3. Secondary Manufacturing: stretching (pasta filata) → forming sticks/ropes → brining/cooling
  4. Packaging & QA: individual wrap/multipack, coding, metal detection, micro program
  5. Logistics & Distribution: refrigerated warehousing + reefer transport (FEFO)
  6. End Markets: retail snack packs, schools/foodservice portion control, industrial inclusions

2) Where Cost Actually Accumulates (and Why Unit Price Misleads)

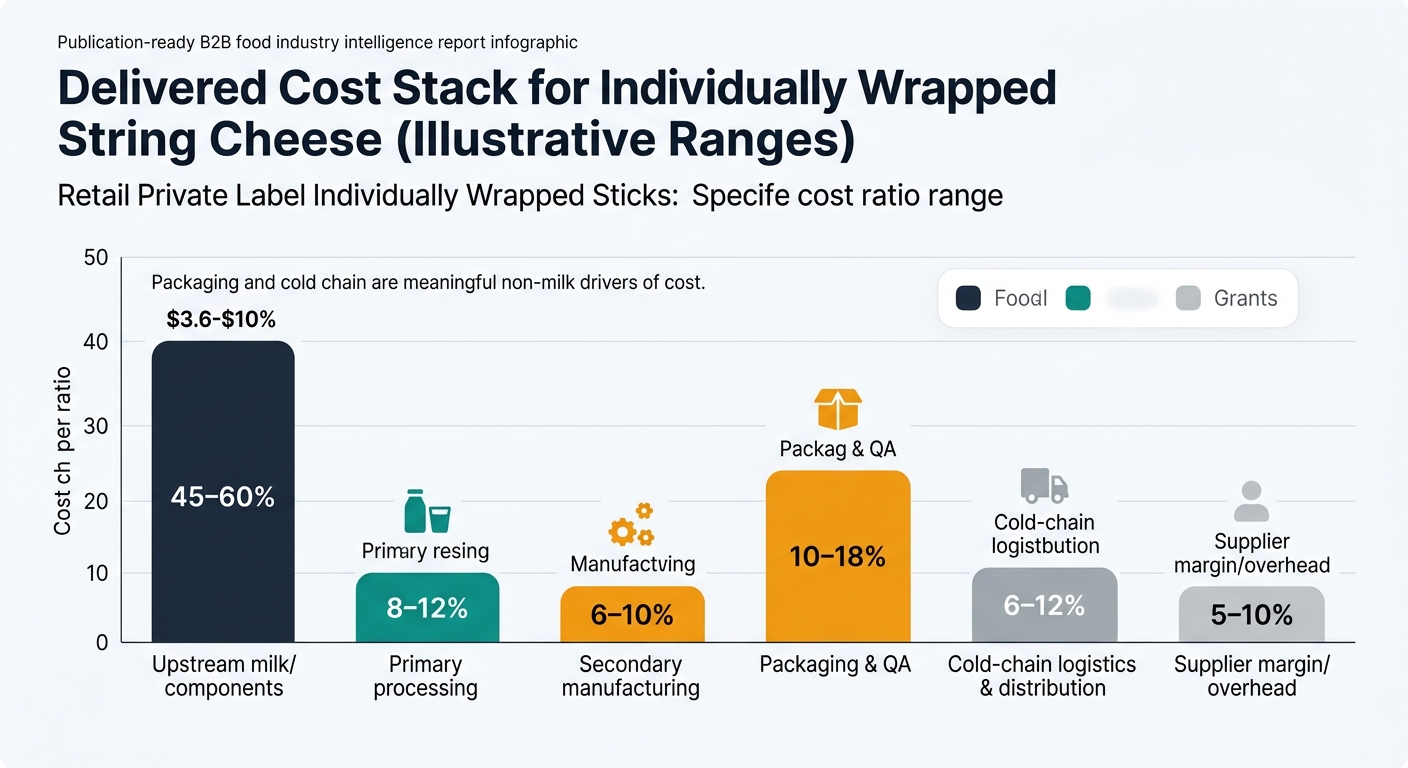
Below is the procurement-relevant cost and margin structure by node. Treat the percentages as illustrative ranges for North American sourcing; actual ratios move with milk markets, packaging resin, freight, and retailer program requirements.

2.1 Upstream: Milk & Components (the cost anchor)

Key insight: Most volatility originates here, but it expresses downstream with a lag depending on contract reset cadence.

What drives it

  • Milk component pricing (fat + protein) and regional milk availability.
  • Seasonality: milk supply and components shift through the year; demand has its own seasonality (e.g., back-to-school lunchbox demand).

Procurement implication

  • A supplier’s “cheese price” is often a function of milk + make; if you don’t separate those, you can’t tell whether a price move is market-driven or supplier-driven.

What to measure

  • Your exposure: % of spend indexed/formula vs fixed; average reset frequency; basis differences by region.

Yield reality (why specs change cost): Cheese yield is commonly discussed as pounds of cheese per 100 pounds of milk, and it varies with milk components (fat/protein) and target moisture/fat in finished cheese. Treat yield as a commercial variable tied to spec, not just a plant technicality.

2.2 Primary Processing: Curd Make (conversion economics)

Key insight: This is where “milk in” becomes “cheese out,” and where byproduct economics (whey) can change a plant’s margin needs.

Cost drivers

  • Cultures/rennet, utilities, labor, yield loss (fat/protein losses to whey), sanitation.
  • Byproduct offset: whey streams can subsidize cheese economics; when whey values drop, plants often need higher cheese contribution margin to hold returns. (This effect is directionally consistent with USDA/industry commentary on dairy product price relationships and byproduct markets.)

Procurement implication

  • Two suppliers quoting the same delivered price can have very different true cost structures depending on their whey monetization and plant efficiency—this affects how they behave during tight markets.

2.3 Secondary Manufacturing: Stretching + Forming (stringability is engineered)

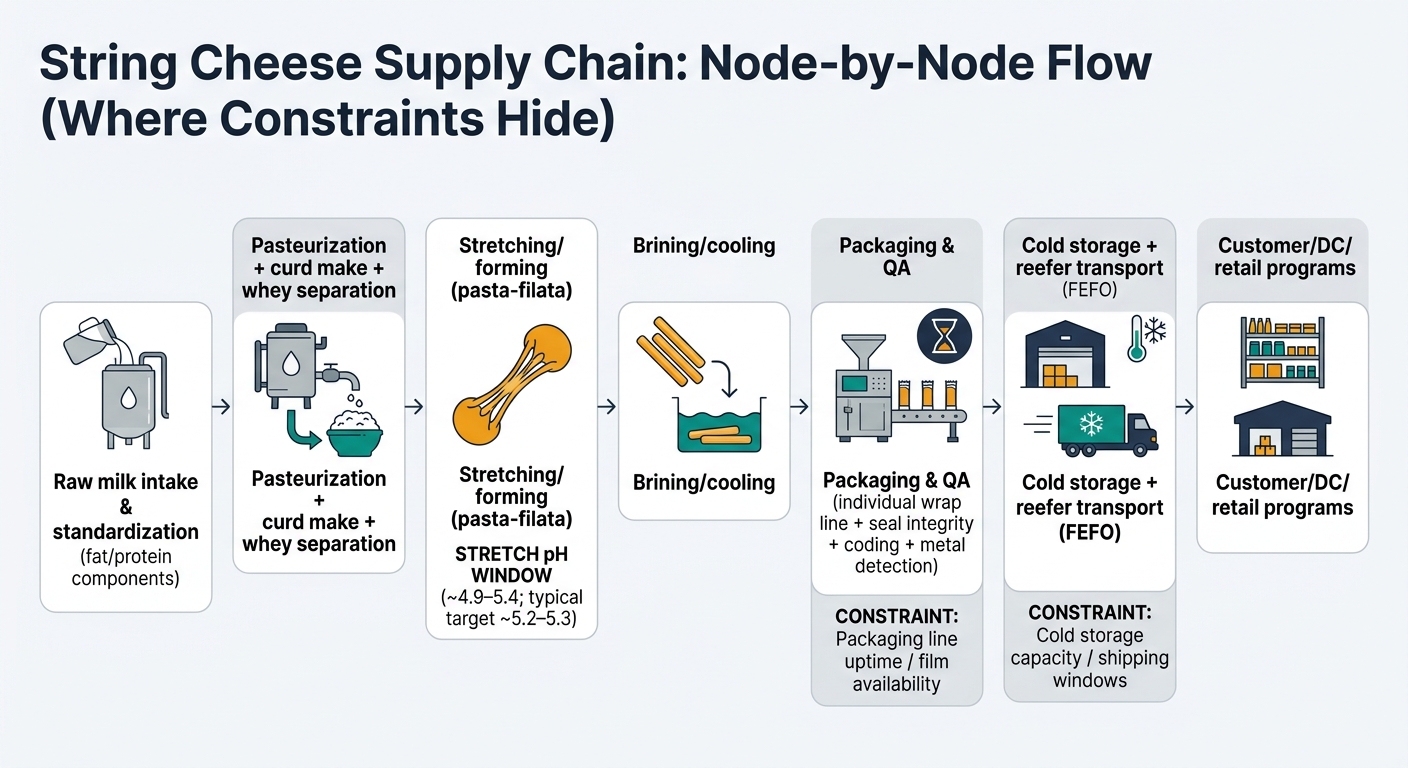
Key insight: String cheese is not “just mozzarella in a different shape.” Stringability depends on hitting a narrow process window.

What matters technically (in plain terms)

  • Curds must reach a specific acidity before stretching; technical literature commonly places pasta-filata stretching pH in a band roughly ~4.9 to 5.4, with many practical targets clustering around ~5.2–5.3 for reliable stretch behavior.

Cost drivers

  • Energy (hot water/steam for stretching + heavy refrigeration load), line efficiency, rework/scrap from texture defects.

Procurement implication

  • If you push price without protecting process capability, you often “buy” hidden costs later: complaints, credits, and retailer service failures.

2.4 Packaging & QA: The hidden bottleneck

Key insight: Individually wrapped sticks are packaging-intensive; packaging and QA can be the constraint even when bulk mozzarella is plentiful.

Cost drivers

  • High-speed wrapping lines, barrier film, seal integrity checks, coding accuracy, case packing.
  • Strong preventive controls and verification are expected for RTE foods exposed to the environment prior to packaging; FDA guidance emphasizes measures to minimize Listeria contamination risk, including verification activities such as environmental monitoring programs in relevant RTE contexts.

Procurement implication

  • When a supplier cites “material shortages” or “line downtime,” it can be real. Packaging capacity is not interchangeable across plants.

2.5 Cold-Chain Logistics & Distribution: TCO lives here

Key insight: Refrigerated logistics is a quality and shrink risk, not just a freight line item.

Cost drivers

  • Reefer availability, fuel, accessorials, cold storage capacity, retailer compliance (temp + shelf-life on receipt).

Procurement implication

  • Cheapest ex-works price can lose to a slightly higher price with better lane control, fewer temperature excursions, and fewer chargebacks.

2.6 End Market Margin Stack: Retail programs amplify penalties

Key insight: Retail and foodservice programs turn small failures into big costs (chargebacks, delists, lost promos).

Procurement implication

  • Your sourcing decision must include service-level economics: fill rate during peaks, promo support, and claims responsiveness.

Product-level cost breakdown (illustrative)

Modeled % of final delivered cost to your DC (not consumer shelf price). Ranges reflect typical variability across milk markets, packaging formats, and freight lanes.

A stacked bar chart (range/interval style) translating the cost ratio ranges into a delivered-cost stack for Retail Private Label Individually Wrapped Sticks. Shows 6 stacked components with labeled ranges: Upstream milk/components (45–60%), Primary processing (8–12%), Secondary manufacturing (6–10%), Packaging & QA (10–18%), Cold-chain logistics & distribution (6–12%), Supplier margin/overhead (5–10%). Annotates each segment with its range and emphasizes that packaging plus cold chain are meaningful non-milk drivers.

A) Retail Private Label Individually Wrapped Sticks (multi-pack)

Supply Chain Node Cost Ratio (% of final delivered cost) Notes
Upstream milk/components 45–60% Main volatility driver; component yield matters.
Primary processing (curd make) 8–12% Efficiency + yield loss + sanitation.
Secondary manufacturing (stretch/form) 6–10% Energy + line performance; stringability window.
Packaging & QA 10–18% Individual wrap film + high-speed line + QA burden.
Cold-chain logistics & distribution 6–12% Reefer + cold storage + compliance.
Supplier margin/overhead 5–10% Varies by scale, utilization, and contract terms.

B) Foodservice Portion-Control Sticks (bulk packs, fewer wraps)

Supply Chain Node Cost Ratio (% of final delivered cost) Notes
Upstream milk/components 50–65% Higher sensitivity to milk markets.
Primary processing 8–12% Similar conversion economics.
Secondary manufacturing 6–10% Similar process control needs.
Packaging & QA 6–12% Less individual wrap can reduce cost and bottlenecks.
Cold-chain logistics & distribution 6–12% Similar reefer exposure.
Supplier margin/overhead 4–8% Often thinner margins in bid-heavy channels.

C) Industrial String Cheese as Inclusion (kits/RTM; spec-driven)

Supply Chain Node Cost Ratio (% of final delivered cost) Notes
Upstream milk/components 45–60% Still dominant.
Primary processing 8–12% Conversion + sanitation.
Secondary manufacturing 6–10% Texture targets may be tighter.
Packaging & QA 8–16% Format-specific; may require special packaging.
Cold-chain logistics & distribution 6–12% Often stricter shelf-life on receipt.
Supplier margin/overhead 5–10% Depends on customization and service requirements.

3) The Structural Fact That Explains Most “Surprises”: Capacity Is Plant- and Line-Specific

In string cheese, capacity is not just “tons of mozzarella.” It’s:

  • Milk intake + vat/curd capacity (can you make the base?)
  • Stretch/form capacity (can you hit stringability consistently?)
  • Packaging line capacity (can you wrap and case-pack at speed?)
  • Cold storage + shipping windows (can you move it without shelf-life loss?)

So a market can look “well supplied” in bulk cheese while sticks are tight because wrapper film, labor, or line uptime is the constraint.

4) The Critical Insight: Why Bulk Mozzarella Signals Don’t Equal Stick Pricing

Procurement teams often use bulk cheese or general “dairy” signals to explain stick quotes. That’s directionally helpful, but incomplete.

Why the disconnect happens:

  • Conversion + spec: moisture/fat targets change yield and cost per pound.
  • Packaging intensity: individual wrap costs don’t move with milk the same way.
  • Contracting lag: retail programs reprice on quarterly/annual cycles; spot moves faster.
  • Allocation behavior: during tight periods, suppliers protect strategic customers and higher-margin SKUs.

What to do with this insight:

treat price as three layers:

  1. milk/component exposure,
  2. make (conversion + yield + energy),
  3. packaging + cold-chain + service.

For market context, USDA AMS publishes regular Dairy Market News reports and price indicators (e.g., cheese blocks/barrels) that are widely used as directional signals, but they are not a direct proxy for packaged string cheese pricing.

5) Where Procurement Teams Typically Get This Wrong (in This Category)

  1. Awarding on unit price without a packaging/capacity view
  2. Result: “lowest price” supplier becomes the first to short ship when packaging lines or labor tighten.
  3. Treating QA as a checkbox instead of a lead-time driver
  4. Switching suppliers requires spec validation, shelf-life verification, label approvals, and often customer sign-off.
  5. Over-indexing on bulk market signals
  6. Result: you negotiate the wrong lever (milk index) while your true swing factor is packaging + logistics.
  7. Single-plant dependency hidden inside a “multi-site” corporate supplier
  8. Corporate diversity is not the same as site-level redundancy.
  9. Not quantifying the TCO of service failures
  10. Chargebacks, premium freight, emergency buys, and spoilage routinely erase “savings.”

6) How an Intelligence-Driven Service Changes the Outcome (Decision-First)

Below is how procurement & sourcing management can use intelligence outputs to make better decisions—without pretending we can “guarantee” plant capacity.

Decision A: Award strategy (single vs dual source, regional redundancy)

What intelligence changes:

  • Supplier discovery + segmentation: build a bench of manufacturers/co-packers/distributors tagged by region, certifications, likely packaging capability, and spec fit.
  • Supplier concentration view: flag where “two suppliers” actually map to one plant or one milk shed.

Confidence framing:

  • High confidence: corporate footprint, certifications, recall history, public events.
  • Medium: capacity indicators (hiring, capex, utilization proxies), lane performance proxies.
  • Low: exact line availability next month (must be validated in direct supplier conversations).

Decision B: Contract structure (fixed vs formula/index, reset cadence)

What intelligence changes:

  • Separate market-driven movement from supplier-driven movement.
  • Scenario-compare:
  • Index/formula to reduce renegotiation friction in volatile milk periods.
  • Fixed windows to protect budgets during promo seasons.
  • Add allocation clauses, service KPIs, and packaging-change governance.

Decision C: Contingency planning (before disruption)

What intelligence changes:

  • Maintain an always-current alternate supplier bench with a switching constraints checklist:
  • spec equivalency (moisture/fat/salt), sensory, shelf-life, packaging format, label, pallet config, lead time.
  • Risk monitoring for:
  • plant incidents, recalls, regulatory events, logistics disruptions, regional milk tightness.

Decision D: Performance governance (QBRs, corrective actions)

What intelligence changes:

  • Standard scorecards across suppliers:
  • cost variance vs formula, OTIF, claims rate, temp excursion incidents, allocation behavior signals.
  • Audit-ready rationale: why awards changed, what risks were accepted, what mitigations were put in place.

7) Strategic Use Cases You Can Operationalize in 30–90 Days

  1. Reduce cost volatility without sacrificing fill rates
  2. Output: cost-driver narrative + contract mechanism scenarios + negotiation benchmarks.
  3. KPI: budget variance reduction; fewer mid-cycle surcharges.
  4. Pre-qualify alternates to cut recovery time
  5. Output: regional alternate bench + switching constraints + pre-approved packaging/label contingencies.
  6. KPI: time-to-switch; % volume with qualified secondary coverage.
  7. Allocation-proof your portfolio
  8. Output: supplier ranking that weights allocation behavior/reliability, not just price.
  9. KPI: peak-season fill rate; emergency buy spend.
  10. Strengthen food safety and compliance posture
  11. Output: risk flags tied to RTE controls expectations; prioritize audits where signals warrant.
  12. KPI: audit findings trend; incident/recall exposure reduction.

8) Why This Matters Beyond String Cheese (Same Pattern, Different Category)

If you source string cheese, you likely also source other categories where input markets + plant constraints + packaging/cold chain create “price vs availability” surprises:

  • Greek yogurt cups: milk solids economics + cup/lid supply + cold chain; line speed and packaging are often the constraint.
  • Ice cream novelties: dairy + sugar + inclusions, but the real bottleneck is novelty line capacity and cold storage.
  • Fresh poultry tray packs: commodity input signals exist, yet packaging film/tray availability and plant labor drive service outcomes.
  • Frozen prepared foods: ingredients may be available, but co-man packing lines, carton supply, and freezer capacity determine fulfillment.

The transferable lesson: procurement wins when you manage node-specific constraints, not just commodity indices.

9) Why This Example Is a Strong Proof Point for Intelligence-Led Sourcing

Mozzarella string cheese is a high-signal category because it forces disciplined procurement thinking:

  • Cost: you must separate milk/component exposure from make + packaging + logistics.
  • Risk: plant/site dependency and RTE food safety expectations materially change supplier selection.
  • Resilience: alternates are only useful if they’re pre-qualified for spec + packaging + cold chain.
  • Governance: decisions are defensible only when you can document trade-offs and evidence.

How to measure success (procurement-owned metrics):

  • Total landed cost variance (vs budget and vs market drivers)
  • Fill rate / OTIF (especially in peak demand windows)
  • Disruption recovery time (days to switch volume)
  • Claims rate (mold/texture/seal failures) and chargebacks
  • Supplier concentration risk (site-level, not corporate-level)
Tridge Eye Data Intelligence Solution

Make Faster, Data-Driven Sourcing Decisions

The insights in this report are just the starting point. Tridge Eye is the data intelligence solution that gives procurement and sourcing leaders real-time market signals, price benchmarks, and supply risk alerts — so you can act before the market moves.

Explore Tridge Eye →

Subscribe
By subscribing you agree to with our Privacy Policy and provide consent to receive updates from our company.
Thank you! Your submission has been received!
Oops! Something went wrong while submitting the form.
Subscribe to receive the latest blog posts, updates, promotions, and announcements from Tridge.