

This report is powered by Tridge Eye Data Intelligence.
Every data point, price signal, and supply risk insight in this analysis comes from the same platform that procurement and sourcing leaders worldwide rely on daily. As you read, consider what this level of market intelligence could do for your sourcing decisions.
Mixed nut snacks look simple on-shelf, but they’re one of the fastest ways for Procurement to get surprised by hidden cost, conversion bottlenecks, and quality/shelf-life failures—because you’re managing a multi-commodity BOM, multi-origin supply, and a low-moisture food safety program at the same time. This guide translates the real supply chain into procurement decisions: where TLC (total landed cost) builds, where risk concentrates, and what to negotiate (and what not to).
(Analyzed at: Apr, 2026)
Evidence base: oxygen control (nitrogen flushing + barrier) is repeatedly shown to slow lipid oxidation in nuts and nut products, improving quality retention. [5]
Mixed nut snacks look simple on-shelf, but procurement complexity comes from multi-commodity BOMs (almonds + cashews + peanuts + pistachios + walnuts/pecans, plus oil/salt/flavors) that move on different crop calendars, originate in different countries, and fail for different reasons.
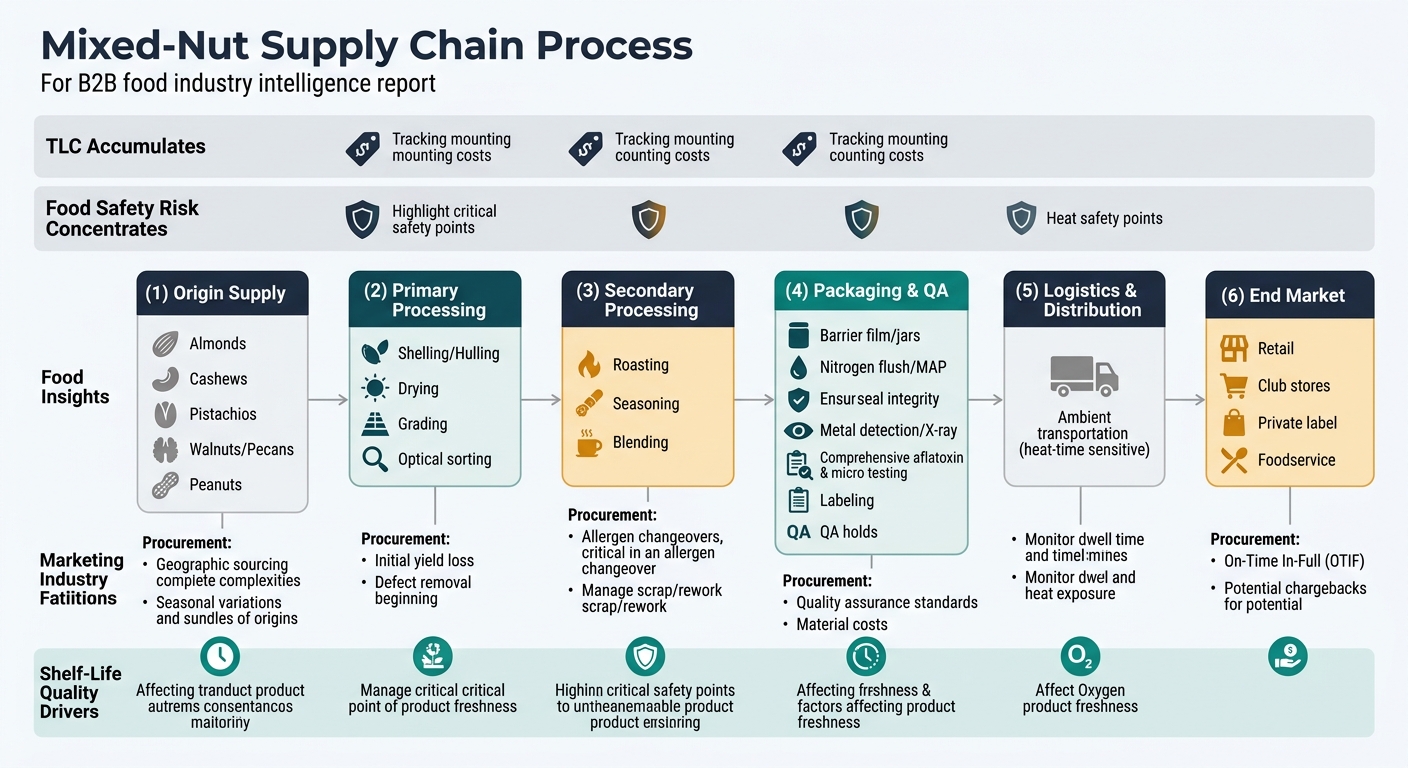
Key procurement reality: You’re not just sourcing “nuts”—you’re sourcing a freshness window (oxidation risk), a food safety system (validated kill-step + allergen controls), and a packaging system (oxygen barrier + sealing discipline) as much as you’re sourcing kernels.
Below is a procurement-oriented view of cost build by supply chain node. Percentages are illustrative ranges to show where cost tends to concentrate; actuals vary by nut type, grade, origin, contract coverage, and whether you’re buying bulk ingredients vs finished retail packs.
Key insight: For most mixes, raw nut cost is still the dominant driver, but it behaves differently by nut type because origin concentration differs.
Key insight: This is where yield loss becomes real money—and where quality specs quietly create hidden cost.
Key insight: Roasting is a cost + risk transformation step. It adds value, but it also becomes a food safety and consistency commitment.
Key insight: For mixed nuts, packaging isn’t “just packaging.” Oxygen control is a direct driver of returns, stales, rancidity complaints, and markdowns.
Key insight: Nuts are “ambient,” but they are heat-time sensitive. Long dwell times and hot containers shorten shelf life and increase complaint rates.
Key insight: Your channel determines your “true” cost of failure.
Modeled to show where cost typically concentrates across common mixed-nut supply forms. Use as a negotiation map (where to push, where to protect). Actual ratios vary by spec, origin, and contract structure.

| Supply Chain Node | Cost Ratio (% of Final Cost) | Notes |
|---|---|---|
| Upstream raw material | 70% | Farm/orchard economics dominate; grade matters. |
| Primary processing | 18% | Shelling, sorting, grading, testing. |
| Secondary processing | 0% | Not yet roasted. |
| Packaging & QA | 3% | Bulk cartons/bags, basic QA. |
| Logistics & distribution | 7% | Inland freight + warehousing. |
| Wholesale margin | 2% | Trader/handler margin varies. |
| Supply Chain Node | Cost Ratio (% of Final Cost) | Notes |
|---|---|---|
| Upstream raw material | 55% | Raw cashew nut supply + origin logistics. |
| Primary processing | 25% | Shelling/peeling/grading is labor- and yield-intensive. |
| Secondary processing | 0% | Often sold as raw kernels to roasters/blenders. |
| Packaging & QA | 5% | Export packaging + QA release. |
| Logistics & distribution | 12% | Ocean + inland + financing time. |
| Wholesale margin | 3% | Depends on contract coverage and tightness. |
| Supply Chain Node | Cost Ratio (% of Final Cost) | Notes |
|---|---|---|
| Upstream raw material | 55% | Multi-nut BOM is the main driver. |
| Primary processing | 12% | Sorting/grading still matters. |
| Secondary processing | 18% | Roasting energy/labor, seasoning, scrap/rework. |
| Packaging & QA | 5% | Bulk liners, QA testing, metal detection. |
| Logistics & distribution | 7% | Lead-time variability impacts freshness. |
| Manufacturer margin | 3% | Value-add margin for roasting/blending. |
| Supply Chain Node | Cost Ratio (% of Final Cost) | Notes |
|---|---|---|
| Upstream raw material | 40% | Still largest single component. |
| Primary processing | 8% | Defect removal, grading. |
| Secondary processing | 12% | Roast/season/blend. |
| Packaging & QA | 18% | Barrier film/jars, nitrogen flush, labeling, QA holds. |
| Logistics & distribution | 10% | DC handling, warehousing, shrink risk. |
| Commercial margin (packer + channel) | 12% | Brand/private label economics vary. |
Key insight: Mixed nuts are not one commodity—they are a portfolio of correlated and uncorrelated risks.
Why this matters: Your category strategy should explicitly separate:
Key insight: Procurement teams often anchor on raw nut market moves, but the delivered cost is frequently driven by (a) yield loss + (b) QA holds/rejections + (c) packaging + (d) logistics time.
For Procurement & Sourcing Management in mixed nut snacks, the highest-leverage pairing is typically: Price intelligence & cost-driver tracking + Supplier benchmarking & peer comparison.
Better resilience usually means paying for at least one of:
The same “multi-node cost + compliance gating + packaging/logistics” pattern shows up in other procurement categories that often sit near mixed nuts in snack portfolios:
Transferable lesson: If you only watch the headline commodity (nuts), you will miss the constraints that actually stop shipments (packaging, QA release, conversion capacity, logistics time).
Mixed nut snacks are a “stress test” category because they combine:
If your team can build an intelligence-driven operating rhythm here—cost drivers, supplier benchmarks, and risk monitoring—you can replicate it across most snack and ingredient categories with measurable improvements in TLC, continuity, and governance.
Make Faster, Data-Driven Sourcing Decisions
The insights in this report are just the starting point. Tridge Eye is the data intelligence solution that gives procurement and sourcing leaders real-time market signals, price benchmarks, and supply risk alerts — so you can act before the market moves.


