INDUSTRY TRENDS

Magnesium Carbonate Sourcing (Food/Ingredient): How Procurement Leaders Balance Cost, Qualification Risk, and Resilience

Author
Team Tridge
DATE
April 2, 2026
10 min read
magnesium-carbonate Cover
Tridge Eye Data Intelligence Solution

This report is powered by Tridge Eye Data Intelligence.

Every data point, price signal, and supply risk insight in this analysis comes from the same platform that procurement and sourcing leaders worldwide rely on daily. As you read, consider what this level of market intelligence could do for your sourcing decisions.

Explore Tridge Eye →

Procurement outcomes for magnesium carbonate rarely hinge on whether the powder exists in the market—they hinge on whether the right grade can be supplied with repeatable process capability and audit-ready documentation at an acceptable total landed cost. This guide translates the magnesium-carbonate supply chain into practical sourcing decisions: how to write specs that keep competition open, where cost volatility actually comes from (and where it doesn’t), and how to build a dual-source posture without overwhelming QA and operations.

Executive Summary

  • Category reality: “Magnesium carbonate” is not one market; grade + qualification friction determine leverage and continuity.
  • Regulatory anchors (non-negotiable for audits):
  • U.S.: Magnesium carbonate is affirmed as GRAS under 21 CFR 184.1425 (conditions of use under cGMP).
  • EU: Magnesium carbonates are E 504 and commonly used under Group I / quantum satis logic (GMP-driven), with purity criteria set under Regulation (EU) No 231/2012.
  • What usually breaks sourcing: spec ambiguity (light vs heavy/basic, PSD, LOI, metals), documentation gaps (CoA consistency/traceability/change control), and “false savings” (unit price down, landed cost + quality risk up).
  • Cost drivers that matter most for procurement: energy (drying/milling), yield loss/off-spec risk, packaging/QA release discipline, and freight/container utilization.
  • Governance win: The fastest way to improve resilience is not “qualify everyone,” but to target 2–3 alternates using documentation readiness + lane feasibility + spec comparability screening.

Key Insights

(Analyzed at: Apr, 2026)

  • Strategy: Hold
  • Reliability: Medium
  • Potential Saving: 4% ~ 10%
  • Insight: For most U.S. food-grade magnesium carbonate buyers, the best near-term outcome is typically achieved by holding core volumes under a disciplined term structure (to protect continuity and QA stability) while running a focused qualification sprint for 1–2 alternates to restore competitive tension. The saving opportunity is more likely to come from tightening surcharge rules, packaging/container optimization, and reducing receiving holds (total landed cost) than from trying to time upstream mineral headlines—because qualified supply and documentation capacity create price stickiness even when upstream inputs soften.

1) What You’re Actually Buying: The Ground Truth of the Magnesium Carbonate Flow

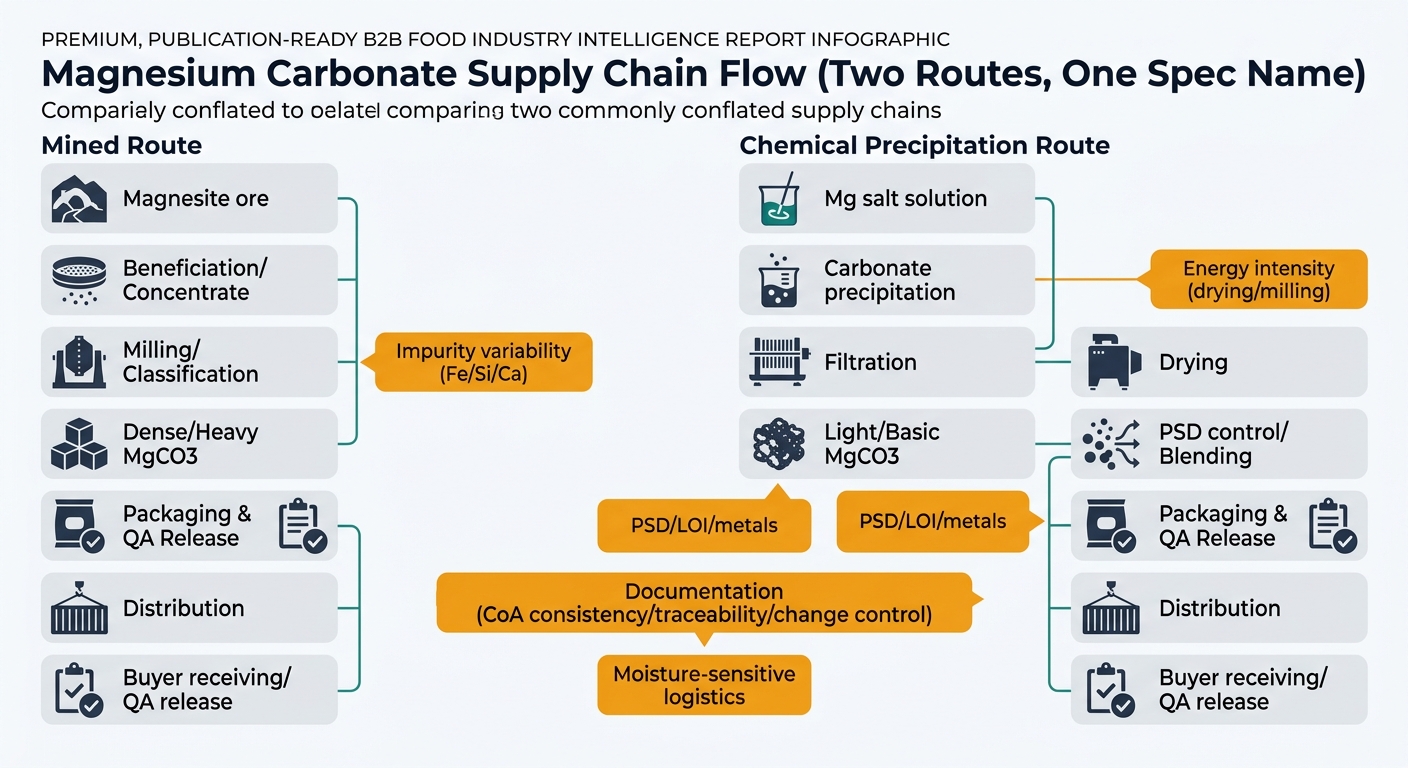
Magnesium carbonate looks like a simple white powder, but procurement outcomes are driven by which production route, which grade, and how tightly controlled the impurity/particle profile is.

Two different supply chains often get lumped together in one spec name:

A procurement-oriented flowchart contrasting two magnesium carbonate supply chains side-by-side: mined route (Magnesite ore → Beneficiation/Concentrate → Milling/Classification → Dense/Heavy MgCO3 → Packaging & QA Release → Distribution → Buyer receiving/QA release) and chemical precipitation route (Mg salt solution → Carbonate precipitation → Filtration → Drying → Light/Basic MgCO3 → PSD control/Blending → Packaging & QA Release → Distribution → Buyer receiving/QA release), with callouts for impurity variability, energy intensity, PSD/LOI/metals, documentation, and moisture-sensitive logistics.
  • Mined route (magnesite ore → beneficiated concentrate → milled/graded “dense/heavy” magnesium carbonate)
  • Typically more exposed to ore quality variability (Fe/Si/Ca impurities) and beneficiation yield.
  • Often competes heavily on price in industrial applications.
  • Chemical precipitation route (Mg salt solution → carbonate precipitation → filtration/drying → “light/basic” magnesium carbonate)
  • More exposed to energy intensity (drying), reagent costs, and process control.
  • Often preferred where surface area / flow function / consistency matters (food/pharma functional performance).

Why this matters for procurement leadership:

  • Your biggest failure modes are rarely “no one can make MgCO3.” They’re:
  • Spec ambiguity (food vs pharma vs technical; light vs heavy/basic; PSD; LOI; heavy metals)
  • Documentation gaps (CoA inconsistency, traceability, change control)
  • False savings (unit price down, total landed cost and quality risk up)

Regulatory anchors that shape the buying spec (not optional in audits):

  • In the EU, magnesium carbonates are listed as E 504 and commonly allowed under Group I / quantum satis logic (use as needed for function, within GMP/justification).
  • EU purity/specification criteria are set under Regulation (EU) No 231/2012, which includes E 504 specifications.
  • In the U.S., magnesium carbonate is affirmed as GRAS under 21 CFR 184.1425 (commonly referenced in technical/regulatory dossiers).

Practical implication: you’re sourcing a regulated input with a mineral upstream. That combination creates a predictable pattern: quality + documentation are the gating factors, while energy and freight are the volatility multipliers.

2) Where the Money Builds Up: Cost & Margin by Node (and Why It’s Not Linear)

Below is a procurement-oriented view of cost accumulation. The key is not “which node is biggest in theory,” but which node is most likely to spike, fail qualification, or create hidden landed cost.

2.1 Upstream Node — Ore / Mineral Feedstock (Magnesite or Mg-bearing sources)

Key insight: Upstream cost is not just mining; it’s the impurity profile you inherit. Higher Fe/Si/Ca means more beneficiation, more yield loss, and higher probability of off-spec downstream.

What drives cost and risk here

  • Ore grade variability → drives beneficiation intensity and yield loss.
  • Concentration risk: Magnesite and magnesia supply chains are often concentrated across a small set of producing countries; disruption risk tends to transmit downstream as lead-time drift and allocation.
  • Permitting and environmental enforcement can constrain mining/processing output (especially where operations are concentrated).

Procurement watch-outs

  • If your supplier is a trader, you may not know the mine/beneficiation source until a disruption forces substitution.

2.2 Primary Processing — Beneficiation / Precipitation (the “cost of making it consistent”)

Key insight: This node is where energy and process yield become the major levers.

Two cost structures depending on route

  • Beneficiation + milling route (dense/heavy)
  • Cost drivers: crushing/grinding power, classification, dust control, yield loss to remove impurities.
  • Precipitation route (light/basic)
  • Cost drivers: reagents, filtration, drying energy, and tight process control.
  • Light/basic magnesium carbonate is commonly produced by precipitation from Mg solutions using carbonate (industrial chemistry route).

Procurement watch-outs

  • When energy spikes, suppliers often attempt surcharges or price resets—especially for precipitated grades.

2.3 Secondary Processing — Grade Making (food/pharma fit is built here)

Key insight: This is where “commodity powder” becomes “qualified ingredient.” The cost is not only processing; it’s QA capability and the ability to hold tight distributions.

Cost drivers

  • Fine milling/classification to hit particle size distribution (PSD) and bulk density targets.
  • Whitening/impurity control (process capability + incoming feed quality).
  • Reject/off-spec handling (hidden yield loss).

Procurement watch-outs

  • A supplier can pass a one-time CoA but fail process capability over time (spec drift).

2.4 Packaging & QA Release — The auditability premium

Key insight: For food/pharma, packaging and QA release are not overhead; they are qualification enablers.

Cost drivers

  • Food-contact packaging (lined bags, controlled storage) to reduce moisture pickup/caking.
  • Test panels: assay/LOI, heavy metals, micro (as applicable), method repeatability.
  • Documentation: CoA consistency, traceability statements, allergen statements where relevant, and change control.

Procurement watch-outs

  • Documentation quality often correlates with on-time release and fewer holds at receiving.

2.5 Logistics & Distribution — The “powder penalty” in landed cost

Key insight: MgCO3 is typically non-hazardous, but it is low density and moisture-sensitive, making packaging integrity, container utilization, and warehouse humidity meaningful.

Cost drivers

  • Ocean freight/container availability for bagged powders.
  • Inland drayage + port handling.
  • Inventory carrying cost driven by long lead times for qualified grades.

2.6 Downstream Margin Stack — Distributor vs manufacturer economics

Key insight: Many buyers pay for “availability and paperwork” via distributors. That’s not wrong—but it must be explicit in your category strategy.

Margin drivers

  • Distributors price for short lead time, smaller MOQs, and credit terms.
  • Manufacturers price for volume commitments and stable scheduling.
A stacked bar chart comparing delivered cost stack by node across three grades: Food Grade (E504), Pharmaceutical/Excipient Grade, and Industrial Grade. Each bar is segmented into Upstream/Raw material, Primary processing, Secondary processing, Packaging & QA release, Logistics & distribution, and Channel margin, using the illustrative percentages from the tables, with a legend and a footnote noting ratios vary by incoterms, lane, packaging, and qualification burden.

Product-level cost breakdown (illustrative ratios)

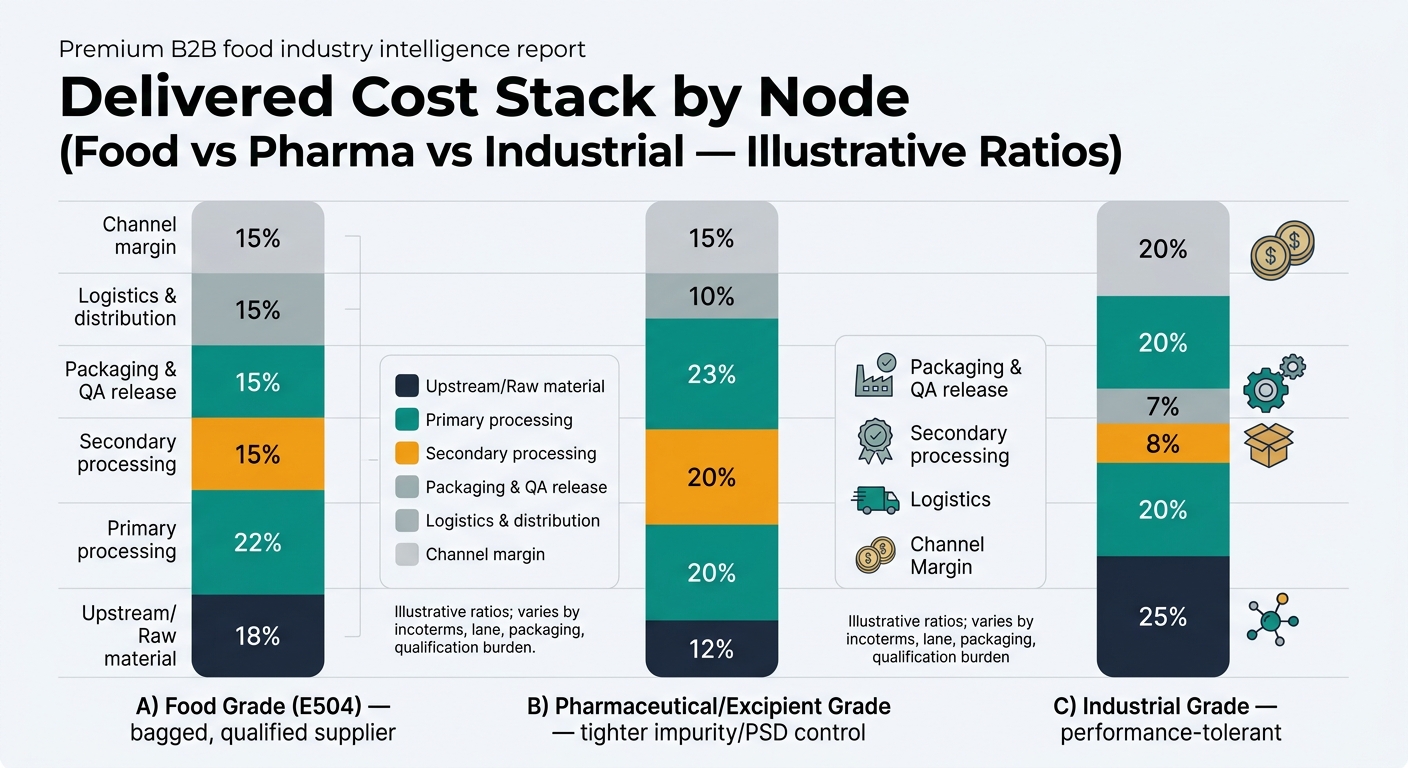
Modeled % of final delivered cost to a U.S. food manufacturer site. Actuals vary by incoterms, lane, packaging, and qualification burden.

A) Food Grade Magnesium Carbonate (E504) — bagged, qualified supplier

Supply Chain Node Cost Ratio (% of Final Cost) Notes
Upstream / Raw material 18% Ore or Mg-salt feedstock cost; impurity profile matters more than headline ore price.
Primary processing 22% Beneficiation or precipitation + drying energy; yield losses.
Secondary processing 15% PSD control, whiteness, blending/standardization.
Packaging & QA release 15% Testing + compliant packaging + documentation overhead.
Logistics & distribution 15% Powder shipping, handling, warehousing, moisture control.
Channel margin (importer/distributor) 15% Service level + MOQ flexibility + working capital.

B) Pharmaceutical/Excipient Grade Magnesium Carbonate — tighter impurity/PSD control

Supply Chain Node Cost Ratio (% of Final Cost) Notes
Upstream / Raw material 12% Feedstock is screened; supplier pays for consistency earlier.
Primary processing 20% Process control and yield discipline matter.
Secondary processing 20% Tight PSD/bulk density; higher reject risk.
Packaging & QA release 23% Higher test burden + batch release discipline + documentation.
Logistics & distribution 10% More controlled packaging; often higher value density.
Channel margin (specialty distributor) 15% Qualification support + smaller lots + continuity service.

C) Industrial Grade Magnesium Carbonate — performance-tolerant applications

Supply Chain Node Cost Ratio (% of Final Cost) Notes
Upstream / Raw material 25% More commodity-like; ore economics show through.
Primary processing 20% Grinding/classification; energy still matters.
Secondary processing 8% Less tight PSD/impurity control.
Packaging & QA release 7% Lower documentation burden.
Logistics & distribution 20% Low value density makes freight a larger share.
Channel margin 20% Distribution and availability drive deal structure.

3) One Structural Fact You Should Build the Category Strategy Around

“Magnesium carbonate” is not one market. It’s a family of grades where qualification friction creates price stickiness.

What this means in practice:

  • Tight-spec food/pharma grades behave like a constrained specialty when a supplier exits or fails audits.
  • Industrial grades behave more like a mineral commodity, with faster price pass-through and more substitutability.

Why that’s structurally true:

  • EU additive use is often quantum satis / Group I, so control shifts to purity criteria and GMP justification, not dosage limits.
  • U.S. GRAS status exists, but your customer audits and internal QA specs determine who is actually “approved.”

4) The Critical Insight: Why Ore/Freight Signals Don’t Translate Cleanly to Your Delivered Price

Procurement teams often try to time purchases based on upstream mineral or freight headlines. For magnesium carbonate, the delivered price can disconnect for four reasons:

  1. Qualification creates inertia
  2. If you can only buy from 1–2 approved sources, your negotiating leverage is structurally capped.
  3. Energy is embedded twice (processing + fine milling)
  4. Even if ore is flat, drying and classification costs can move with electricity/gas.
  5. Yield loss is the hidden “tax”
  6. A small change in impurity profile can increase rejects and rework.
  7. Channel structure masks true supply tightness
  8. Distributors can temporarily buffer shortages, but often at higher margins and with allocation rules.

Decision implication: the best timing decisions are usually made using a blend of cost-driver intelligence (energy/freight), supplier capacity signals, and lead-time distributions, not ore price alone.

5) Where Procurement Teams Commonly Misstep (and the Business Consequences)

Mistake 1 — Writing specs that are “technically correct” but commercially narrowing

  • Example: specifying “food grade MgCO3” without defining light vs heavy/basic, PSD, LOI range, and heavy metals thresholds.
  • Outcome: fewer qualified bids, more single-source exposure, and higher audit workload.

Mistake 2 — Treating CoA as a checkbox rather than a capability signal

  • Outcome: repeated deviations, receiving holds, and emergency buys.

Mistake 3 — Optimizing unit price instead of total landed cost

Outcome: savings erased by:

  • higher freight per kg (poor container utilization),
  • higher moisture/caking losses,
  • expediting,
  • line disruptions.

Mistake 4 — Building “backup supplier” plans that are not activation-ready

  • Outcome: during disruption, you discover the alternate can’t meet documentation, lead time, or PSD—and you pay a premium anyway.

6) What an Intelligence-Driven Approach Changes (Decision by Decision)

This section maps procurement decisions to intelligence capabilities—without pretending intelligence guarantees supply or pricing.

Decision A: “Who do we invite to the RFQ so we actually get competitive tension?”

Use: Supplier discovery & longlist building

  • Segment by manufacturer vs distributor, region, stated grades (E504/food, pharma/excipient, industrial).
  • Outcome: broader bid set without wasting QA time on non-starters.

Decision B: “Which alternates are worth spending qualification bandwidth on?”

Use: Supplier benchmarking & qualification support

  • Compare:
  • documentation completeness (CoA consistency, traceability, change control),
  • typical lead times/MOQs,
  • packaging formats and moisture controls.
  • Outcome: faster dual-source readiness.

Decision C: “Spot vs term—what’s the least-regret choice this quarter?”

Use: Price intelligence & trend analysis

  • Track energy/freight indicators and separate:
  • short-term noise vs structural shifts,
  • supplier-specific surcharges vs market-wide moves.
  • Outcome: fewer poorly timed contract locks.

Decision D: “When do we trigger contingency actions?”

Use: Supply chain risk monitoring & early warning

  • Trigger thresholds tied to:
  • lead-time drift (e.g., +20–30% vs baseline),
  • allocation signals,
  • documentation lapses or quality events.
  • Outcome: earlier activation of alternates, less expediting.

Decision E: “Can we defend our sourcing choices in audits and internal governance?”

Use: Procurement performance & governance analytics

  • Maintain an audit-ready decision log:
  • why this supplier,
  • what risks were accepted/mitigated,
  • what monitoring is in place.
  • Outcome: faster internal approvals, fewer compliance surprises.

7) Strategic Use Cases Procurement Leaders Actually Run (with Owners and Cadence)

Use Case 1 — Build a credible dual-source strategy for magnesium carbonate

Owner: Category manager + QA lead

Cadence: Quarterly

Steps:

  1. Normalize the spec into “must-have” vs “nice-to-have” (PSD, LOI, heavy metals, whiteness, packaging).
  2. Longlist 8–12 suppliers, shortlist 2–3 based on documentation readiness and lane feasibility.
  3. Run a qualification sprint with a defined test plan and change control requirements.
  4. Put an activation rule in writing (lead time, allocation, or deviation thresholds).

Outcomes + trade-offs:

  • Resilience improves; qualification cost increases upfront.

Use Case 2 — Reduce cost volatility without increasing continuity risk

Owner: Procurement + Finance

Cadence: Monthly driver review; semiannual contracting

Steps:

  1. Build a should-cost view: energy + freight sensitivity + packaging/MOQ impacts.
  2. Use benchmarks to negotiate:
  3. surcharge rules,
  4. price review clauses,
  5. volume bands.
  6. Decide what portion to lock (term) vs flex (spot) based on risk signals.

Outcomes + trade-offs:

  • Better budget stability; may sacrifice some upside if spot falls.

Use Case 3 — Strengthen supplier governance and audit readiness

Owner: Supplier quality + procurement operations

Cadence: Monthly scorecard; quarterly business review

Steps:

  1. Track: OTIF, deviation rate, CoA accuracy, change notifications, complaint closure time.
  2. Require a documented change control process for:
  3. raw material source changes,
  4. process changes,
  5. packaging changes.
  6. Keep a “supplier dossier” updated for audits.

Outcomes + trade-offs:

  • Fewer surprises; more disciplined supplier management effort.

8) Why This Matters Beyond Magnesium Carbonate (Patterns You’ll Recognize)

Magnesium carbonate is a clean example of a broader procurement pattern: mineral/chemical inputs where qualification friction dominates the commercial outcome.

Comparable categories procurement teams often manage:

  • Citric acid / lactic acid: commodity-like chemistry, but supplier qualification and contamination controls create switching friction.
  • Silicon dioxide (anticaking) / calcium carbonate: similar “powder economics” where freight, PSD, and documentation drive total landed cost more than raw input price.
  • Phosphate salts (food/pharma): regulatory documentation and impurity control create a narrow approved supplier set.

In all of these, intelligence improves results by:

  • expanding the qualified option set,
  • detecting risk earlier than the PO lead time,
  • making cost drivers explicit so negotiations don’t rely on anecdotes.

9) Why Magnesium Carbonate Is a High-Signal Example for Procurement Intelligence

This category is powerful because it combines:

  • Upstream concentration and mineral reality (mine/processing constraints),
  • Midstream energy and yield sensitivity (drying/milling),
  • Downstream audit and documentation gating (food/pharma acceptance),
  • Logistics that materially changes unit economics (powder handling + container utilization).

For procurement leadership, that means improvements are measurable in four KPI families:

  • Cost: lower total landed cost variance; fewer surprise surcharges.
  • Risk: fewer quality holds and supplier documentation failures.
  • Resilience: shorter time-to-qualify alternates; reduced single-source exposure.
  • Governance: audit-ready sourcing rationale and supplier performance traceability.

Clarifying questions (to tailor this to your category reality)

  1. What’s your primary application: anticaking (E504), excipient/pharma, or industrial filler?
  2. Which constraints are non-negotiable: PSD, LOI, whiteness, Pb/As/Cd/Hg limits, micro?
  3. What’s your current buy model: manufacturer-direct vs distributor, spot vs term, and typical annual volume?
  4. Any region exclusions (policy, tariffs, lead time, customer requirements)?
Tridge Eye Data Intelligence Solution

Make Faster, Data-Driven Sourcing Decisions

The insights in this report are just the starting point. Tridge Eye is the data intelligence solution that gives procurement and sourcing leaders real-time market signals, price benchmarks, and supply risk alerts — so you can act before the market moves.

Explore Tridge Eye →

Subscribe
By subscribing you agree to with our Privacy Policy and provide consent to receive updates from our company.
Thank you! Your submission has been received!
Oops! Something went wrong while submitting the form.
Subscribe to receive the latest blog posts, updates, promotions, and announcements from Tridge.