INDUSTRY TRENDS

Lavender Oil Sourcing (2026 Guide): Where Cost, Risk, and Quality Actually Form—and How Procurement Should Act

Author
Team Tridge
DATE
April 6, 2026
10 min read
lavender-oil Cover
Tridge Eye Data Intelligence Solution

This report is powered by Tridge Eye Data Intelligence.

Every data point, price signal, and supply risk insight in this analysis comes from the same platform that procurement and sourcing leaders worldwide rely on daily. As you read, consider what this level of market intelligence could do for your sourcing decisions.

Explore Tridge Eye →

Lavender oil sourcing looks straightforward until you run into (1) seasonal supply windows, (2) chemistry-driven specs that shrink your supplier pool, and (3) authenticity risk that turns “cheap” into TCO pain. This guide is written for Procurement & Sourcing Management teams who are experienced buyers but newer to lavender oil. It explains where cost and risk truly form in the chain, how supplier tiers (distiller vs blender vs distributor) change outcomes, and what measurable KPIs to use to keep supply stable without overpaying.

Executive Summary

  • Market clears at harvest: Most true price-and-availability risk is set during a short harvest/distillation window; inventory is then sold down over the next 9–12 months.
  • Yield reality (true lavender): Fresh lavender flowers typically contain ~0.7%–1.4% volatile oil, so small agronomic swings can translate into big unit-cost moves. [1]
  • Spec drives supplier count: Tight GC/MS windows often force blending/standardization, which is a manufacturing capability—not a commodity add-on.
  • Lavender vs lavandin is a procurement-critical split: ISO-based profiles differ materially; for lavandin (Grosso French type), camphor is commonly specified around 6.0%–8.5% (and linalool/linalyl acetate ranges also differ). [2]
  • Logistics is a quality variable: Heat exposure and dwell time can change organoleptics; “delivered cost” should include packaging/handling controls and realistic lead times.
  • Key governance lever: Your leverage is not “trust,” it’s test design + documentation completeness + change control.

Key Insights

(Analyzed at: Apr, 2026)

  • Strategy: Hold
  • Reliability: Medium
  • Potential Saving: 4% ~ 10%
  • Insight: If you are buying on spot or re-quoting frequently, the best near-term savings typically come from tightening spec clarity and quote comparability rather than chasing the lowest unit price. Standardize your RFQ pack (species/ISO reference, GC/MS method + acceptance bands, lot-level testing cadence, packaging/Incoterms, and lead-time definitions). This reduces “apples-to-oranges” quote variance (distiller vs distributor inventory premiums; lavender vs lavandin; differing test burdens) and prevents avoidable nonconformance/expedite costs—often a mid-single-digit % of annual spend in practice. (To upgrade this to a Buy/Strong Buy call, confirm: your current spot-buy share, rejection/expedite frequency, and whether you’re inadvertently mixing lavender and lavandin specs.)

1) What You’re Actually Buying: The Lavender-Oil Supply Chain, End-to-End

Lavender oil looks like a simple agricultural ingredient, but procurement outcomes are usually decided upstream—in the 2–6 weeks around harvest and distillation—and then “locked in” downstream through blending, documentation quality, and inventory strategy.

Ground-truth flow (typical B2B ingredient path):

  1. Farming / biomass: Lavender flowering tops harvested at peak bloom; timing affects yield and ester profile.
  2. Primary processing (steam distillation): Field-adjacent stills convert bulky biomass into a high-value, low-volume oil.
  3. Secondary processing (standardization/blending): Oils are blended across lots/origins to meet GC/MS + organoleptic targets.
  4. Packaging & QA: Drumming, headspace management, and lot-level testing (GC/MS; sometimes advanced authenticity tests).
  5. Logistics & distribution: Carrier acceptance varies by classification and documentation; heat exposure risk, and working-capital tied to harvest-season inventory.
  6. End markets: Fragrance/personal care dominate; food use is niche and typically requires tighter contaminant and documentation expectations.
A clean left-to-right flow diagram showing the end-to-end B2B path: (1) Farming/biomass (harvest timing, yield variability) → (2) Steam distillation (capacity/energy constraints during a short window) → (3) Secondary processing (blending/standardization to hit GC/MS bands) → (4) Packaging & QA (COA, GC/MS per lot, authenticity screening) → (5) Logistics & distribution (heat exposure, dwell time, lead time) → (6) End markets (fragrance/personal care/food-adjacent). Add callouts on the two key splits: 'True lavender vs Lavandin' and 'Distiller vs Blender/Standardizer vs Distributor'. Use simple icons (field, still, lab flask, drum, truck/ship, bottle) and highlight the harvest window as the main risk-setting point.

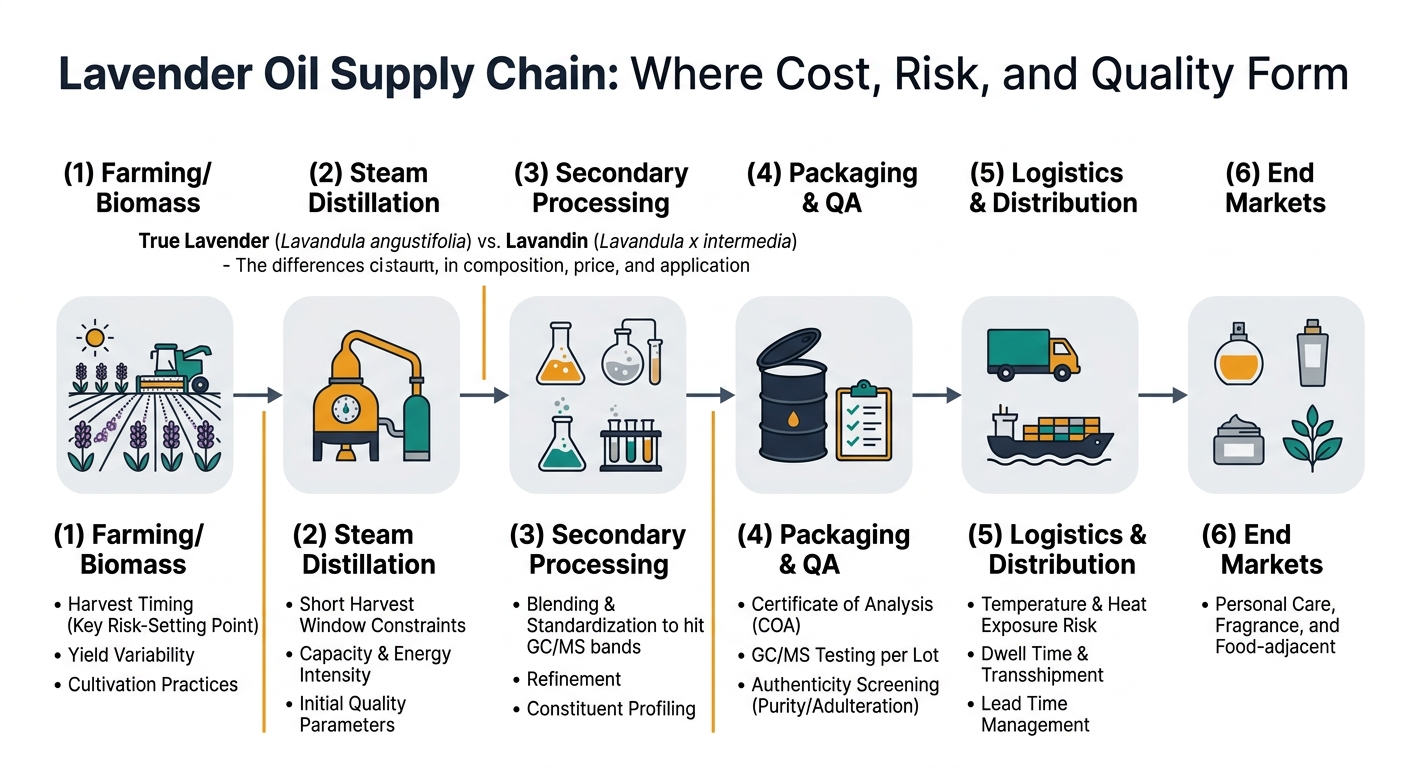
Two procurement realities that matter immediately:

  • “Lavender oil” is not one thing: the market often mixes true lavender (Lavandula angustifolia) and lavandin (Lavandula × intermedia) economics and quality expectations. ISO monographs differentiate them, including camphor tolerance (a common “tell” in practice). [2]
  • The oil’s chemical profile is inherently variable (cultivar, terroir, harvest maturity, distillation parameters). Your spec, not your PO, determines how many suppliers you really have. [1]

2) Where the Money Accumulates: Cost & Margin by Node (and Why It Moves)

Below is how cost typically builds through the chain, and what procurement can actually influence.

2.1 Upstream (Farming / Biomass): “Your cost base is a yield story”

Key insight: Lavender oil is a low-yield output of a bulky, time-sensitive input. When yields swing, unit costs swing—even if labor rates are stable.

  • What drives cost here
  • Harvest labor/mechanization and short harvest window constraints
  • Weather-driven yield swings (drought/heat/rain at bloom)
  • Plantation age/replant cycles and agronomy
  • Why it matters for sourcing
  • In a short crop year, distillers allocate oil to their best customers first; spot buyers pay the volatility premium.

Useful benchmark (directional, true lavender): Fresh lavender flowers are often cited around ~0.7%–1.4% volatile oil, which is why crop outcomes translate quickly into price signals. [1]

2.2 Primary Processing (Steam Distillation): “Energy and throughput decide the season”

Key insight: Distillation is a capacity-constrained conversion step during a narrow window. If a region has biomass but not enough still time, oil availability tightens.

  • What drives cost here
  • Fuel/energy for steam generation (high sensitivity to energy shocks)
  • Still utilization (bottlenecks during peak weeks)
  • Water availability and maintenance
  • Procurement implication
  • Supplier model matters: farm-distiller vs. independent distiller vs. blender changes your exposure to harvest congestion.

2.3 Secondary Processing (Blending / Standardization): “Spec compliance is a manufacturing activity”

Key insight: Many buyers assume lavender oil is a single-origin, single-lot commodity. In practice, meeting a tight GC/MS window often requires blending across lots.

  • What drives cost here
  • Blending losses, filtration/winterization (where used)
  • QA burden to prove conformance lot-by-lot
  • Inventory holding to enable blending (working capital)
  • Procurement implication
  • The cheapest quote can be the most expensive if it increases nonconformance risk (rejections, rework, expedite).

Spec anchor (true lavender): ISO 3515:2002 is commonly referenced for Lavandula angustifolia oil; many procurement specs use linalool/linalyl acetate/camphor bands as practical anchors (exact ranges can vary by standard and interpretation, and some ISO standards define multiple characteristics beyond just these three). [3]

Lavandin contrast (more defensible numeric benchmark): ISO 8902:2009 (lavandin, Grosso French type) is commonly summarized with camphor around 6.0%–8.5% (and linalool and linalyl acetate in the mid-20s to 30s). This is why lavandin can be acceptable for detergents/industrial perfumery but problematic for “fine lavender” expectations. [2]

2.4 Packaging & QA: “Authenticity is a cost center—until it’s a loss event”

Key insight: Lavender oil has persistent authenticity/adulteration exposure; the procurement lever is not “trust,” it’s test design + documentation completeness.

  • What drives cost here
  • Lot-level GC/MS and trend review vs. one-time qualification
  • Packaging that reduces oxidation/light exposure (drums, liners, headspace)
  • Documentation: COA, SDS, traceability, allergen-related disclosures depending on end-use
  • Procurement implication
  • If you don’t specify testing cadence and acceptance criteria, you’re buying a paperwork narrative, not a controlled ingredient.

Industry literature describes using composition patterns and diagnostic markers to flag inauthentic oils against ISO/pharmacopoeia expectations. [1]

2.5 Logistics & Distribution: “Heat and dwell time are hidden quality variables”

Key insight: Logistics cost is not just freight—it’s quality preservation + lead-time reliability.

  • What drives cost here
  • Carrier constraints and documentation (varies by mode and classification)
  • Summer heat exposure, port dwell time, and warehouse conditions
  • Import documentation and insurance
  • Procurement implication
  • Distributors can be more expensive per kg but may reduce risk via buffer inventory and shorter lead times.

Many essential oils are shipped under “extracts” classifications in dangerous goods frameworks depending on flash point and composition; industry guidance notes consolidation around UN1197 with a transition period where UN1169/UN1197 were both used (timing depends on regulation edition and mode). Treat this as mode- and lane-specific and confirm with your SDS and forwarder. [4]

2.6 End-Market Margin: “The downstream markup reflects risk transfer”

Key insight: Downstream margins often price in inventory risk, QA burden, and claims risk, not just handling.

  • Premium segments pay for: traceability depth, consistent organoleptics, and lower authenticity risk.
  • Value segments optimize for: availability and cost, with broader specs.

Product-Level Cost Breakdown (Illustrative, Delivered-to-Buyer)

A 100% stacked chart with three bars: (A) True Lavender Oil (Fine Spec), (B) Lavandin Oil (Industrial/Value Spec), (C) Standardized/Blended 'Lavender Profile' Oil. Each bar is segmented by the same nodes: Farming/biomass, Distillation, Blending/standardization, Packaging & QA, Logistics & distribution, Supplier/distributor margin. Use the article’s illustrative ratios (A: 30/22/15/12/11/10; B: 25/20/10/8/12/25; C: 20/18/22/15/10/15). Include a small note on-chart: 'Illustrative ratios (not industry averages) — use to identify RFQ levers.'

Modeled % allocations to show where costs concentrate. Actual ratios vary by origin, supplier tier (distiller vs blender vs distributor), contract structure, and testing requirements.

A) True Lavender Oil (Lavandula angustifolia), “Fine” Spec

Supply Chain Node Cost Ratio (% of Final Delivered Cost) What typically drives variance
Farming / biomass 30% Yield swings, harvest labor, replant cycles
Primary processing (distillation) 22% Energy, still capacity, harvest congestion
Secondary processing (blending/standardization) 15% Tight GC/MS targets, blending losses, working capital
Packaging & QA 12% GC/MS per lot, authenticity screening, drum/liner quality
Logistics & distribution 11% Freight + dwell time + carrier constraints
Supplier/distributor margin 10% Inventory risk transfer, service level, credit terms

B) Lavandin Oil (Lavandula × intermedia), Industrial/Value Spec

Supply Chain Node Cost Ratio (% of Final Delivered Cost) What typically drives variance
Farming / biomass 25% Higher yield potential reduces relative share
Primary processing (distillation) 20% Energy and throughput
Secondary processing (blending/standardization) 10% Broader spec = less blending constraint
Packaging & QA 8% Lighter testing burden in some channels
Logistics & distribution 12% Similar handling needs
Supplier/distributor margin 25% Trading/blending channels often dominate value capture

C) Standardized/Blended “Lavender Profile” Oil (Multi-origin Blend)

Supply Chain Node Cost Ratio (% of Final Delivered Cost) What typically drives variance
Farming / biomass 20% Multi-origin flexibility dampens shocks
Primary processing (distillation) 18% Origin mix changes cost base
Secondary processing (blending/standardization) 22% The product is the blending capability
Packaging & QA 15% Trend monitoring across inputs
Logistics & distribution 10% Inventory positioning
Supplier/distributor margin 15% Formulation and reliability premium

These ratios are plausible as a teaching tool, but they are not “industry averages.” Use them to guide which levers to interrogate in an RFQ (yield/energy/blending/testing/inventory), not as a should-cost model.

3) The Structural Fact Most Teams Miss: The Market Clears at Harvest, But You Buy Year-Round

Lavender oil is produced in a seasonal window (often late spring/summer depending on origin), but consumption is steady. That creates a structural pattern:

  • Producers build inventory once, then sell down over 9–12 months.
  • Working capital and storage discipline become part of the price.
  • Tight years show up as: allocation, longer lead times, and sudden MOQ increases.

Procurement takeaway: your contracting and inventory decisions must be synchronized to pre-harvest, harvest, and post-harvest phases—not just quarterly budgeting.

4) The Critical Insight: Why “Lavender Oil” Prices Disconnect From Your Supplier Quotes

When procurement sees two quotes that don’t move together, it’s usually not supplier opportunism—it’s a mismatch in what’s being priced.

Four common disconnect mechanisms:

  1. Species/spec mismatch
  2. True lavender vs lavandin can look similar on a line item but behave differently in chemistry and price; ISO-referenced profiles differ materially (camphor is a common differentiator). [2]
  3. Testing and authenticity assurance level
  4. A quote that includes lot-level GC/MS review and adulteration screening will not track a “minimal paperwork” quote.
  5. Supplier tier and inventory position
  6. Distiller pricing moves with harvest reality; distributors price the value of inventory availability (especially in tight markets).
  7. Blending complexity
  8. If your spec is narrow (e.g., tight linalyl acetate window), the supplier is effectively selling you a manufacturing outcome (standardization), not raw oil.

5) Where Procurement Teams Typically Get It Wrong (and Pay for It Later)

From a Procurement & Sourcing Management perspective, these are the repeat failure modes:

  1. Treating lavender oil as a single-grade commodity
  2. Result: supplier count collapses once QA applies real acceptance criteria.
  3. Qualifying a “backup supplier” on paper only
  4. Result: during disruption you discover gaps in COA format, testing cadence, MOQ, lead time, or packaging.
  5. Over-optimizing unit price and under-optimizing total cost of ownership (TCO)
  6. Result: higher nonconformance, expedite freight, line downtime, reformulation work.
  7. Not separating “origin story” from “resilience strategy”
  8. Result: single-origin dependence without a quantified continuity plan.

KPIs that expose these problems early:

  • Price variance vs budget (monthly/quarterly)
  • OTIF (on-time, in-full)
  • Nonconformance rate (COA failures, organoleptic rejects)
  • Expedite frequency and cost
  • Allocation events (count and duration)

6) What an Intelligence-Driven Workflow Changes (Decision-by-Decision)

This is not about “finding suppliers.” It’s about reducing avoidable surprises by aligning market reality, supplier capability, and your spec.

A) Supplier landscaping that reflects the real tiers

Instead of a flat supplier list, segment the market into:

  • Distillers (origin-linked): best for traceability and cost transparency; higher harvest-season risk.
  • Blenders/standardizers: best for spec consistency; you pay for blending capability and inventory.
  • Distributors: best for lead time and buffer stock; you pay for availability and service.

B) Benchmarking that procurement can act on

Compare suppliers on procurement-relevant signals:

  • Lead time patterns (in-season vs off-season)
  • MOQ and allocation behavior in tight years
  • Documentation completeness (COA fields, traceability depth)
  • Quality risk proxies (spec drift frequency; retest rates)

C) Price intelligence tied to drivers (not just “last paid”)

Track price drivers that actually move lavender oil economics:

  • Harvest yield signals and regional weather anomalies
  • Energy/fuel costs affecting distillation
  • Freight and port dwell time risk

D) Alternative sourcing that is truly pre-qualified

A “real” dual-source plan includes:

  • Matched spec ranges (and agreed test methods)
  • Approved packaging, Incoterms, and lead times
  • Trial lot history and change-control expectations

Measurable outcomes:

  • Lower price variance and fewer emergency spot buys
  • Higher OTIF stability during disruption
  • Lower nonconformance and fewer claim escalations
  • Faster switch-over time when a supplier fails

7) Strategic Use Cases Procurement Leaders Can Operationalize

7.1 Reduce Cost Volatility Without Sacrificing Quality

  • Use pre-harvest intelligence to time negotiations and lock volume bands
  • Structure contracts with: split awards, volume flexibility, and defined quality dispute process
  • KPI targets: reduce spot-buy share; reduce budget variance

7.2 Dual-Sourcing Done Correctly (Resilience Without Chaos)

  • Maintain at least one alternate source in a different region or supplier tier
  • Run annual re-validation: documentation, COA format, and a small trial PO
  • KPI targets: recovery time (days), allocation exposure (% volume)

7.3 Governance & Audit Readiness in a High-Authenticity-Risk Ingredient

  • Standardize required documents: COA fields, SDS, traceability statement, change-control notice period
  • Implement lot-level trend review (flag spec drift early)
  • KPI targets: documentation completeness (%), corrective action closure time

7.4 Align Stakeholders on Trade-Offs (QA, R&D, Finance, Ops)

Make trade-offs explicit:

  • Lower price vs higher authenticity assurance
  • Single-origin vs multi-origin resilience
  • Direct-from-distiller vs distributor buffer inventory

KPI targets: fewer escalations; fewer reformulation-driven expedites

8) Why This Matters Beyond Lavender (Where You’ll See the Same Pattern)

If you source lavender oil, you likely source other ingredients with the same structural dynamics:

  • Vanilla extract / vanilla beans: harvest concentration, fraud/adulteration exposure, inventory carry economics.
  • Citrus oils (e.g., orange/lemon): weather-driven yield swings, processing capacity constraints, spec variability.
  • Peppermint oil: agronomic variability and quality profile drift, plus supplier tier opacity.
  • Cocoa and coffee: origin concentration risk, climate volatility, and downstream pricing that reflects inventory and risk transfer.

The transferable lesson: procurement performance improves when you manage spec + supplier tier + seasonality + authenticity risk as one system.

9) Why This Lavender-Oil Example Is a Strong Proof Point for Procurement Intelligence

Lavender oil is an unusually clear case where:

  • Seasonality creates predictable risk windows.
  • Chemistry-based specs (linalool, linalyl acetate, camphor) define supplier feasibility and price behavior (with ISO standards commonly used as reference points). [2]
  • Adulteration detection is measurable (GC/MS marker patterns vs ISO/pharmacopoeia expectations). [1]
  • Supplier tiering (distiller vs blender vs distributor) explains most quote variance that looks “illogical” on a spreadsheet.

If you can build a sourcing strategy that holds cost, OTIF, and nonconformance stable in lavender oil, you can replicate the same governance model across a broader botanical and natural-ingredient portfolio.

Minimum inputs I’d ask for to tailor this to your situation

  1. Annual volume (kg) and pack format (drums, pails)
  2. Required spec: true lavender vs lavandin tolerance; target GC/MS markers; organoleptic constraints
  3. Application (fine fragrance, personal care, home care, food-adjacent)
  4. Required certifications and documentation (e.g., organic, allergen statements, traceability depth)
  5. Target origins and any single-origin constraints
Tridge Eye Data Intelligence Solution

Make Faster, Data-Driven Sourcing Decisions

The insights in this report are just the starting point. Tridge Eye is the data intelligence solution that gives procurement and sourcing leaders real-time market signals, price benchmarks, and supply risk alerts — so you can act before the market moves.

Explore Tridge Eye →

References

  1. pmc.ncbi.nlm.nih.gov
  2. standards.iteh.ai (ISO 8902:2009 summary page)
  3. rcastoragev2.blob.core.windows.net (PDF)
  4. thecompliancecenter.com
Subscribe
By subscribing you agree to with our Privacy Policy and provide consent to receive updates from our company.
Thank you! Your submission has been received!
Oops! Something went wrong while submitting the form.
Subscribe to receive the latest blog posts, updates, promotions, and announcements from Tridge.