INDUSTRY TRENDS

Granola Procurement Intelligence: A Practical Sourcing Guide to Control Landed Cost, Reduce Risk, and Protect OTIF

Author
Team Tridge
DATE
March 9, 2026
8 min read
Granola Cover

This report is powered by Tridge market intelligence.

Every data point, price signal, and supply chain insight in this analysis is drawn from the same engine that procurement teams worldwide rely on daily. As you read, consider what this level of visibility could do for your category.

See how Tridge Eye works →

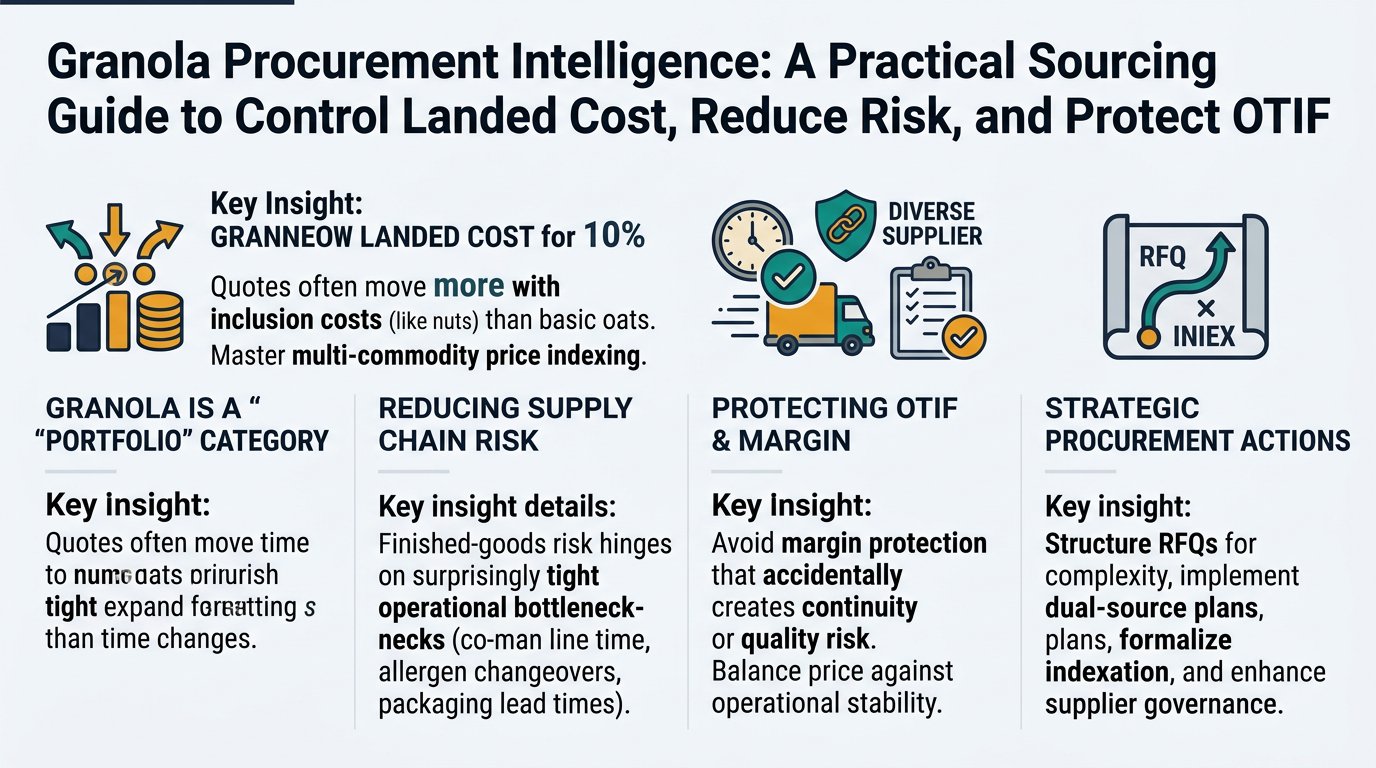
Granola looks straightforward on the shelf, but procurement outcomes hinge on a multi-commodity bill of materials plus a surprisingly tight set of operational bottlenecks (co-man line time, allergen changeovers, and packaging lead times). This guide translates that reality into how a Procurement Manager should structure RFQs, dual-source plans, indexation, and supplier governance—so margin protection doesn’t accidentally create continuity or quality risk.

Executive Summary

  • Granola is a “portfolio” category: finished-goods quotes often move more with inclusions (nuts/dried fruit/chocolate), packaging film, and capacity than with oats alone.
  • Oat trade concentration is real: in 2024, top exporters of oats by value were Canada (~$445M), Finland (~$145M), Australia (~$123M)—useful for origin exposure mapping and contingency planning. [1]
  • Low-moisture ≠ low risk: nuts and dried fruit are repeatedly implicated in mycotoxin and contamination monitoring/notifications; treat supplier approval + incoming controls as a governance requirement, not a “QA nice-to-have.” [2]
  • Hidden cost is usually operational: changeover time (allergens/flavors), scrap/fines, QA holds, and OTIF penalties can erase “unit price” wins.
  • Best-practice sourcing model: combine (1) commodity-informed contracting for oats/sugar/oils with (2) capacity-and-governance sourcing for co-mans, inclusions, and packaging.

Key Insights

(Analyzed at: Mar, 2026)

  • Strategy: Buy
  • Reliability: Medium
  • Potential Saving: 4% ~ 9%
  • Insight: Prioritize near-term contracting/coverage for your “non-oat” cost and service bottlenecks—packaging film capacity/lead times and top 2–3 inclusions—because finished granola pricing often decouples from oats when inclusion load and plant constraints dominate. Run an RFQ that explicitly prices changeover economics (allergen clean-down time, throughput, scrap) and converts them into a TCO comparison; this is typically where procurement can capture mid-single-digit savings without increasing supply risk.

1) What You’re Actually Buying When You Buy Granola (Ground Truth Flow)

Granola looks like a simple dry grocery item, but procurement outcomes are determined by a multi-commodity, multi-risk chain where a few nodes dominate cost and disruption risk.

Granola supply chain flow (practical view):

A left-to-right flowchart showing the end-to-end granola supply chain with 6 labeled nodes (Upstream Raw Materials, Primary Processing, Secondary Manufacturing, Packaging & QA, Logistics & Distribution, End Market Execution) and bottleneck callouts/icons for Allergen changeovers, Co-man line time, Packaging lead time, and Incoming QA controls.
  1. Upstream raw materials
  2. Base grains: oats (rolled/thick/thin; GF vs conventional)
  3. Sweeteners: sugar, brown sugar, honey, syrups
  4. Fats/oils: canola, sunflower, coconut, butter (less common)
  5. Inclusions: nuts, seeds, dried fruit, chocolate
  6. Primary processing
  7. Oat cleaning, dehulling, heat treatment, rolling
  8. Inclusion sorting/grading, roasting, dicing; dried fruit washing/dicing/oil-coating
  9. Secondary manufacturing (granola plant / co-man)
  10. Blending + syrup/oil application + baking/toasting + cooling
  11. Post-bake inclusion addition (heat-sensitive)
  12. Metal detection / X-ray; allergen changeovers
  13. Packaging & QA
  14. Film/pouches/cartons, barrier performance (moisture/oxygen)
  15. Label compliance (claims, allergens), micro/foreign material testing
  16. Logistics & distribution
  17. Inbound: inclusions often travel farther than oats
  18. Outbound: bulky ambient pallets; humidity/heat exposure risk
  19. End market execution
  20. Retail OTIF/chargebacks, promo spikes, shelf-life management

Why this matters for procurement:

  • Oats are usually the largest by weight input, but inclusions and packaging often dominate cost per kg and risk exposure.
  • Supplier decisions cascade into: allergen governance, label/claim integrity (GF/organic/non-GMO), and co-man capacity/lead time.

2) Where Cost Really Accumulates (Node-by-Node Margin Mechanics)

Below is an analyst-style view of how cost stacks through the chain. The goal is not fake precision—it’s to show where procurement leverage and hidden costs live.

2.1 Upstream / Raw Materials (Your COGS “Volatility Engine”)

Key insight: Granola is a “portfolio” of commodities. The volatility you feel in finished goods pricing is often inclusions + oils + packaging, not just oats.

What drives cost here:

  • Oats: origin concentration in global trade; GF programs add premiums (segregation/testing).
  • Nuts & dried fruit: high $/kg, seasonal grades, and food-safety screening costs.
  • Sweeteners: contract/index complexity; label-driven constraints (e.g., “no refined sugar”).
  • Oils/fats: oxidation stability requirements and geopolitical/weather exposure.

Risk reality (validated):

Low-moisture foods are not “low risk.” Pathogens can persist in low-moisture foods (LMFs), and nuts/dried fruits are repeatedly implicated in contamination and mycotoxin monitoring and border notifications. For procurement, that translates into supplier approval rigor + incoming controls (COAs, sampling plans, and traceability) as part of the commercial decision—not after the fact. [3]

2.2 Primary Processing (Where Specs Become Real)

Key insight: This node is where your written spec turns into manufacturing behavior (bake performance, cluster formation, shelf-life).

Cost drivers:

  • Oat milling/rolling capacity and yield
  • Sorting/grading losses for inclusions (rejects, foreign material removal)
  • Additional controls for gluten-free oats (segregation + testing)

Procurement trap:

Switching a cheaper oat cut size or inclusion grade can create downstream losses:

  • higher fines/breakage
  • cluster instability
  • more rework and QC holds

2.3 Secondary Manufacturing (Co-Man or In-House: Capacity Is a Price)

Key insight: In granola, the “factory slot” is often as valuable as the ingredient price—especially during peak demand windows.

Cost drivers:

  • Line utilization and changeover time (allergens, flavors, pack formats)
  • Energy for baking/toasting and cooling
  • Scrap/rework (fines, off-spec clusters)
  • QA holds and release lead times

Commercial reality:

A low tolling rate can be offset by:

  • higher scrap
  • slower throughput
  • more frequent allergen clean-downs

2.4 Packaging & QA (The Quiet Margin Killer)

Key insight: Packaging is not just “materials”—it is shelf-life protection + retailer compliance.

Cost drivers:

  • Film structure/barrier, zipper features, print complexity
  • Case pack/pallet configuration (cube efficiency)
  • Testing: moisture/water activity, rancidity indicators, allergen validation, foreign material controls

Failure mode:

Humidity ingress → loss of crunch → complaints/returns; heat exposure → oxidation/rancidity claims.

2.5 Logistics & Distribution (Where You Pay for Bulk and Variability)

Key insight: Granola is bulky and crush-sensitive. You’re paying for volume (cube) and damage prevention, not refrigeration.

Cost drivers:

  • Inbound lane complexity (inclusions can be import-heavy)
  • Outbound freight cube + accessorials
  • Inventory carrying cost (high-value inclusions + many SKUs)

2.6 Wholesale/Retail Execution (Margins Leak Through Service)

Key insight: For many procurement teams, the biggest “unplanned cost” is not the invoice—it’s chargebacks, expedites, and service recovery.

Cost drivers:

  • OTIF penalties/chargebacks
  • Promo-driven volatility and short-notice production
  • Emergency buys and air/expedite freight
A stacked bar chart with three bars representing (A) Mainstream Oat-Forward Granola, (B) Premium Nut & Dried Fruit Granola, and (C) Gluten-Free Certified Granola. Each bar is divided into six colored segments with a legend: Upstream Raw Materials, Primary Processing, Secondary Manufacturing, Packaging & QA, Logistics & Distribution, Wholesale/Retail Margin & Fees. Midpoints of the provided ranges are plotted and each segment is annotated with its range (e.g., '45–55%'). A note under the chart reads: 'Illustrative modeled ranges; varies by recipe, claims, pack format, channel.'

Product-level cost breakdown (illustrative, procurement-useful ranges)

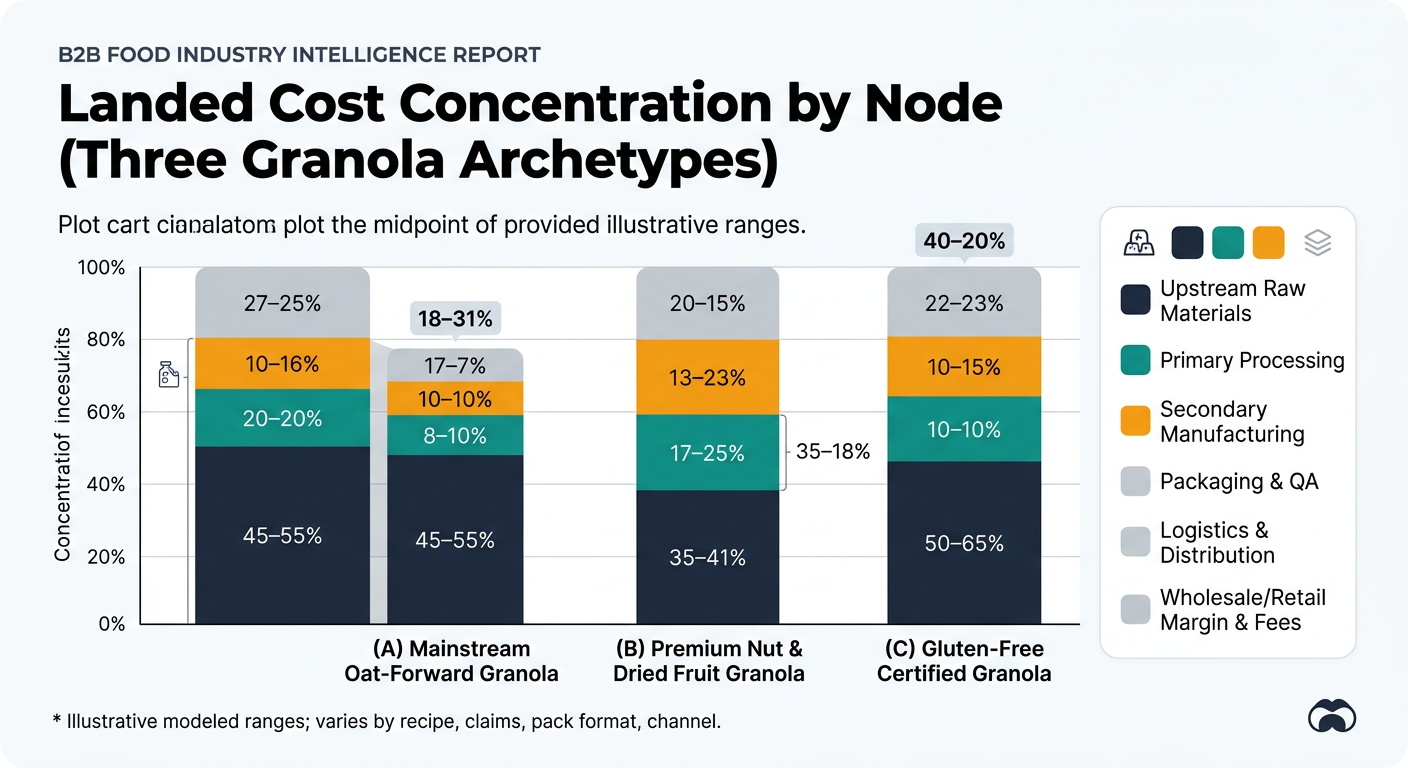
These are modeled ranges to show cost concentration by node. Actual ratios vary by recipe, claims (organic/GF), pack format, and channel.

A) Mainstream Oat-Forward Granola (few inclusions)

Supply Chain Node Cost Ratio (% of Final Landed Cost) What moves it most
Upstream raw materials 45–55% oats + sweeteners + oil
Primary processing 6–10% oat rolling + sorting losses
Secondary manufacturing 12–18% throughput, changeovers
Packaging & QA 10–16% film structure, print, testing
Logistics & distribution 6–12% cube, lanes, damage
Wholesale/retail margin & fees 8–15% channel terms, chargebacks

B) Premium Nut & Dried Fruit Granola (high inclusion load)

Supply Chain Node Cost Ratio (% of Final Landed Cost) What moves it most
Upstream raw materials 55–70% nuts/dried fruit/chocolate
Primary processing 7–12% grading rejects, foreign material removal
Secondary manufacturing 10–16% allergen changeovers, scrap
Packaging & QA 8–14% barrier + allergen governance
Logistics & distribution 5–10% inbound complexity + outbound cube
Wholesale/retail margin & fees 5–12% channel mix

C) Gluten-Free Certified Granola (GF oats + controlled environment)

Supply Chain Node Cost Ratio (% of Final Landed Cost) What moves it most
Upstream raw materials 50–65% GF oats premium + controlled inclusions
Primary processing 8–14% segregation + testing overhead
Secondary manufacturing 10–18% dedicated lines, longer changeovers
Packaging & QA 10–16% additional verification/testing
Logistics & distribution 5–10% similar to mainstream
Wholesale/retail margin & fees 5–12% channel mix

3) The Structural Fact That Should Change Your Sourcing Strategy

Global oats are tradable, but your granola operation is not.

  • Oats are a globally traded commodity with notable exporter concentration. In 2024, the top exporters of oats by value included Canada (~$445M), Finland (~$145M), and Australia (~$123M). [1]
  • That means upstream shocks (weather, logistics, quality) can transmit quickly into your ingredient market.
  • But finished granola is constrained by co-man capacity, allergen changeovers, packaging availability, and retailer service windows—so your true bottleneck is often manufacturing + packaging, not grain availability.

Procurement implication: You need a dual strategy:

  1. Commodity-informed contracting for oats/sugar/oils, and
  2. capacity-and-governance sourcing for co-mans + inclusion suppliers.

4) The Critical Insight: Why Oat Prices and Your Granola Quotes Don’t Move Together

Procurement teams often expect a clean pass-through: “oats down → granola down.” In practice, granola quotes disconnect because:

  1. Inclusion dominance (premium SKUs): nuts/dried fruit/chocolate can overwhelm oat movement.
  2. Packaging and capacity pricing: film, MOQs, and co-man slot scarcity behave like a separate market.
  3. Quality and yield effects: cheaper grades can raise scrap/fines, increasing true cost.
  4. Governance costs: GF/organic/allergen controls add fixed overhead that doesn’t fall with commodities.

Decision threshold example (how to think):

  • If inclusions are >35–40% of formula cost, your “oats index” is a weak predictor of finished goods cost.
  • If co-man utilization is high and you’re competing for line time, the “capacity premium” can dominate any commodity relief.

5) Where Procurement Teams Commonly Misfire in Granola

These are predictable failure modes when a skilled procurement manager is new to granola:

  1. RFQ optimized for unit price, not for changeover economics
  2. Result: lower price, higher hidden cost (scrap, downtime, missed OTIF).
  3. Single-sourcing GF oats or a key inclusion because qualification is painful
  4. Result: fragile continuity; disruption forces rushed spec exceptions.
  5. Treating packaging as a late-stage buy
  6. Result: missed ship windows due to film lead times/MOQs.
  7. No spec-flex corridors approved in advance
  8. Result: every disruption becomes an executive escalation.

6) How Intelligence-Driven Procurement Changes the Outcome (Without “Feature Dumping”)

Playbook applied: Reduce cost volatility without increasing supply risk

Problem: Margin pressure + volatile inputs + service penalties.

Traditional approach (limit):

Periodic RFQs and aggressive negotiation on price.

  • Misses timing (buying at peaks)
  • Underestimates hidden costs (yield, freight, changeovers)
  • Creates supplier churn and qualification fatigue

Intelligence-driven approach (what changes in decisions):

  1. Price/market intelligence
  2. Separate commodity movement from supplier-specific behavior
  3. Build contracting logic (indexation, collars, duration) based on volatility drivers
  4. Supplier benchmarking + alternative mapping
  5. Maintain pre-qualified backups for oats, key inclusions, and packaging
  6. Compare suppliers on lead time, certifications, allergen programs, and capacity signals
  7. Risk monitoring
  8. Trigger contingency sourcing based on defined thresholds (OTIF drop, quality holds, regional disruption)
  9. Performance analytics
  10. Scorecards that tie service failures to specific plants/lanes/specs

Outcome you can measure:

  • Lower total landed cost variance (not just lower price)
  • Fewer expedites and fewer emergency substitutions
  • Faster, auditable decisions under disruption

7) Strategic Use Cases Procurement Leaders Actually Fund (Granola-Specific)

  1. Dual-source strategy for the top 3 cost drivers by SKU
  2. Mainstream: oats + sweetener + packaging
  3. Premium: inclusions + chocolate + packaging
  4. GF: GF oats + controlled inclusions + QA capacity
  5. Spec-flex corridors (pre-approved) to protect supply without brand damage
  6. Example corridors: inclusion piece size, inclusion mix %, sweetener blend window, oil type within oxidative targets
  7. Co-man resilience map
  8. Backup capacity by geography, allergen handling, and pack format (pouch/carton/bulk)
  9. Allergen and low-moisture food safety governance (validated)
  10. Supplier audit cadence + incoming testing strategy for nuts/dried fruit (toxins/foreign material). Industry updates and RASFF-style notifications routinely highlight ongoing mycotoxin vigilance needs in nuts and dried fruits. [2]

8) Why This Procurement Model Matters Beyond Granola (Adjacent Categories You Likely Buy)

The same “commodity + capacity + governance” pattern repeats in other procurement portfolios:

  • Snack bars (granola bars, protein bars): inclusions and chocolate volatility; co-man slot scarcity; allergen changeovers.
  • Breakfast cereal (RTE): grain markets matter, but packaging + plant scheduling often drive service failures.
  • Nut butters and nut snacks: low-moisture food safety controls and mycotoxin/contaminant monitoring costs can dominate supplier selection. [3]
  • Dried fruit blends/trail mix: grade availability and sorting losses behave like hidden “yield taxes.”

Takeaway: intelligence-led sourcing is less about “finding cheaper suppliers” and more about preventing predictable margin leakage from volatility, quality holds, and service penalties.

9) Why This Example Works for Evaluating Procurement Intelligence

Granola is a strong test case because it forces a service to prove it can support decisions across four outcomes simultaneously:

  • Cost: multi-commodity should-cost, not a single index
  • Risk: allergens + low-moisture food safety + origin exposure
  • Resilience: alternative suppliers for both ingredients and capacity
  • Governance: auditable decisions when specs must flex under disruption

Practical next steps (what data you need to operationalize this)

  1. Spend + volume by SKU (annual + peak weeks) and channel terms (OTIF/chargebacks)
  2. Spec stack per SKU (claims, allergens, inclusion load %, pack format, shelf-life targets)
  3. Supplier/origin map for oats + top 5 inclusions + packaging film
  4. Performance history (OTIF, quality holds, customer complaints, scrap/fines)

If you share (a) your top 3 SKUs by margin exposure and (b) whether you run in-house or co-man, the analysis can be tightened into a category strategy that’s specific enough to execute (RFQs, dual-source plan, and contract/indexation structure).

Take Your Sourcing Intelligence to the Next Level

The insights in this report are just the starting point. Tridge Eye gives you real-time market signals, origin risk alerts, and price benchmarks — so you can act before the market moves.

Explore Tridge Eye →

References

  1. wits.worldbank.org
  2. inc.nutfruit.org
  3. iafns.org
Subscribe
By subscribing you agree to with our Privacy Policy and provide consent to receive updates from our company.
Thank you! Your submission has been received!
Oops! Something went wrong while submitting the form.
Subscribe to receive the latest blog posts, updates, promotions, and announcements from Tridge.