INDUSTRY TRENDS

Frozen Whole Chicken Sourcing (Mar 2026): Price, Risk, and Cold-Chain Reality for Procurement Leaders

Author
Team Tridge
DATE
March 20, 2026
9 min read
frozen-whole-chicken Cover
Tridge Eye Data Intelligence Solution

This report is powered by Tridge Eye Data Intelligence.

Every data point, price signal, and supply risk insight in this analysis comes from the same platform that procurement and sourcing leaders worldwide rely on daily. As you read, consider what this level of market intelligence could do for your sourcing decisions.

Explore Tridge Eye →

Frozen whole chicken is often treated like a simple commodity buy, but sourcing outcomes are usually decided by three constraints procurement teams can’t “negotiate away”: (1) biological production lead times, (2) vertically integrated capacity allocation, and (3) cold-chain and SPS/documentation execution risk. This guide translates those realities into practical sourcing actions—how to time events, structure specs, build backup supply, and govern performance—without overpromising what any single data source or supplier claim can guarantee.

Executive Summary

  • Cold-chain baseline: Many food-safety and industry references anchor frozen storage at 0°F / -18°C or below (consumer guidance and “quick frozen” cold-chain references align on this threshold). [1]
  • Cost gravity: Feed is widely cited as the largest cost input in poultry production; ~60–70% is commonly referenced as a directional range (varies by region, formulation, and period—validate with supplier models). [2]
  • Disruption mechanism is fast: HPAI events can trigger immediate SPS/trade actions and lane-specific tightness even when global supply looks “fine.” Brazil’s May 2025 commercial-farm HPAI confirmation and subsequent import halts illustrate the speed of availability/price expectation shifts. [3]
  • Diversification reality: In practice, “supplier diversification” is usually integrator + region + lane diversification (not just adding another legal entity).
  • Governance that pays back: A pre-approved spec control sheet + risk triggers + pre-qualified alternates reduces emergency buys, QA holds, and OTIF misses more reliably than chasing the lowest spot quote.

Key Insights

(Analyzed at: Mar, 2026)

  • Strategy: Hold
  • Reliability: Medium
  • Potential Saving: 4% ~ 10%
  • Insight: Treat the current window as a governance-and-structure opportunity rather than a pure “price call.” With ongoing HPAI-driven trade sensitivity and cold-chain execution risk, the most defensible savings in frozen whole chicken typically come from (1) tightening lane-level landed-cost control (reefer, dwell, storage, claims), (2) widening only the right specs to expand qualified bidders, and (3) pre-qualifying a second region/integrator so you can credibly negotiate service and continuity. Run an RFI now to build the bench; time the next RFP when your internal inventory position and supplier capacity signals indicate real competition (not “phantom” bids).

1) What You’re Actually Buying: The Ground Truth Supply Chain for Frozen Whole Chicken

Frozen whole chicken looks like a simple commodity, but procurement outcomes are driven by biology + vertical integration + cold-chain physics + SPS compliance.

A left-to-right supply chain flow with 7 nodes and risk callouts, showing where risk and cost accumulate from breeding/hatchery through feed and grow-out, processing, freezing, cold storage and inland reefer transport, port handling and reefer ocean freight, to destination cold store and retail/DC, including callouts for biological lead time, vertical integration/capacity allocation, cold-chain temperature control (-18°C/0°F or below), and SPS/documentation hold risk, plus a legend distinguishing cost drivers vs execution risks.

The real flow (and where procurement pain shows up)

  1. Breeding / hatchery / day-old chicks (DOC)
  2. Often controlled by integrated poultry groups; genetics and chick quality drive growth rate and uniformity.
  3. Feed inputs (corn/maize + soybean meal) → grow-out farms
  4. Feed is a dominant cost driver and moves with a lag into finished poultry costs.
  5. Primary processing (slaughter, evisceration, chilling)
  6. Yield losses (condemnations, downgrades) and line speed constraints matter.
  7. Freezing + grading + bagging (frozen whole bird spec)
  8. Blast/spiral/plate freezing; size grading; optional glazing; export labeling.
  9. Cold storage + inland refrigerated transport
  10. Storage and reefer capacity are often the hidden constraint in disruptions.
  11. Port handling + reefer ocean freight (for imports/exports)
  12. Dwell time, reefer plugs, and documentation errors create temperature and claim risk.
  13. Destination cold store → distributor/retail DC → end customer
  14. Inventory buffers can delay price pass-through; service failures show up as OTIF misses and QA holds.

Procurement implication (non-obvious)

  • You are rarely negotiating with a “processor” in isolation—you’re negotiating with a vertically integrated system whose economics are tied to feed, flock health, and byproduct values.
  • Cold chain is not a nice-to-have: common guidance anchors frozen storage at 0°F / -18°C or below (consumer guidance and “quick frozen” cold-chain references align on maintaining -18°C or lower through the chain, with operational tolerances defined by program). [1]

2) Where the Money Goes: Cost & Margin Stack by Node (and why quotes diverge)

Key insight: Frozen whole chicken is a feed-and-energy dominated category with a biological production cycle. Price movements often reflect lagged feed economics, plus sudden discontinuities from avian influenza (HPAI) and trade/SPS actions.

2.1 Upstream: DOC + Grow-out (Farming)

What procurement should know

  • Integrators typically control genetics, hatchery, feed mills, and contract grow-out.
  • The production cycle creates a timing mismatch: feed moves today, but bird costs show up weeks later.

Cost drivers that move your price

  • Feed (corn/soy) is commonly cited as the largest single cost component in broiler production; ~60–70% is a frequently referenced directional range in multiple sources (region/time dependent—validate with your supplier’s cost model and your own receipts). [2]
  • Flock health / mortality / feed conversion changes (especially during heat stress or disease pressure).

Margin reality

  • Integrators may accept thinner margins on whole birds if byproducts (feet, giblets, offal) are strong.

2.2 Primary Processing: Slaughter + Evisceration + Chilling

What procurement should know

  • Throughput constraints are real: labor availability, line speed limits, sanitation downtime.
  • Yield losses show up as grade-outs, condemnation, and customer claims.

Cost drivers

  • Labor, water/effluent, food safety controls, and plant energy.

Margin reality

  • Plants optimize carcass utilization across whole birds vs cut-up parts depending on market signals.

2.3 Secondary Processing: Freezing + Size Grading + Bagging

What procurement should know

  • Freezing is electricity-intensive; freezer capacity can become a bottleneck.
  • Size grading (e.g., 900–1100g, 1100–1300g) changes yield and availability.

Cost drivers

  • Electricity load (freezers + cold store), packaging (bags/cartons), rework/QA holds.

Margin reality

  • Tight specs (narrow weight bands, low defect tolerance) reduce the supplier pool and increase premiums.

2.4 Packaging & QA / Compliance

What procurement should know

  • Export programs often require traceability coding, health certificates, and (where applicable) Halal documentation.
  • QA cost is not just “testing”—it’s the cost of preventing shipment holds.

Cost drivers

  • Certification, inspection, labeling changes, micro testing, metal detection, lot segregation.

2.5 Logistics & Distribution (Cold Chain)

What procurement should know

  • Many cold-chain references anchor “frozen” handling at -18°C (0°F) or below, with tighter requirements in certain programs and products. [4]
  • Temperature excursions are often a claims and relationship killer, not just a cost issue.

Cost drivers

  • Reefer trucking, cold storage, demurrage/detention, reefer ocean freight, insurance.

2.6 End Markets: Importer/Distributor/Wholesale/Retail

What procurement should know

  • Inventory buffers can delay price moves—until they don’t (shortage events break the lag).

Product-level cost breakdown (illustrative, procurement-oriented)

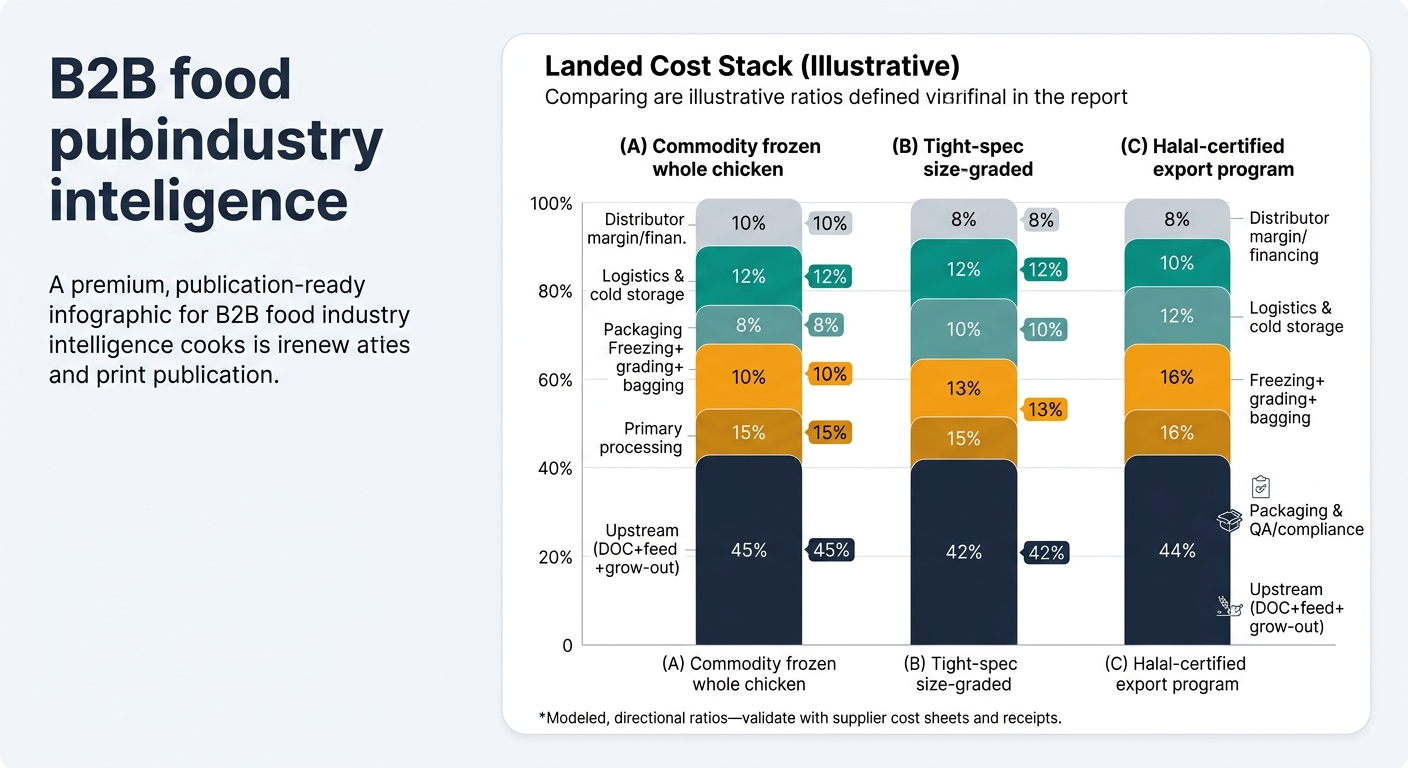
These ratios are modeled, directional to show where cost concentrates by product form. Validate with supplier cost sheets, freight invoices, and internal receipts.

A three-column stacked bar chart comparing landed cost ratios for commodity, tight-spec size-graded, and Halal-certified frozen whole chicken programs, segmented by upstream, primary processing, freezing/grading/bagging, packaging and QA/compliance, logistics and cold storage, and distributor margin/financing, using the article’s illustrative percentages and noting the ratios are modeled and directional.

A) Commodity frozen whole chicken (standard weight band)

Supply Chain Node Cost Ratio (% of landed cost) What typically explains variance
Upstream (DOC + feed + grow-out) 45% Feed moves, flock performance, mortality
Primary processing 15% Labor, yield loss, sanitation downtime
Freezing + grading + bagging 10% Electricity, freezer capacity, tight size grading
Packaging & QA/compliance 8% Labeling, certs, inspection intensity
Logistics & cold storage 12% Reefer availability, dwell time, demurrage
Distributor margin/financing 10% Inventory carry, FX (if import), credit terms

B) Tight-spec size-graded frozen whole chicken (narrow weight band, stricter defects)

Supply Chain Node Cost Ratio (% of landed cost) What typically explains variance
Upstream (DOC + feed + grow-out) 42% More birds needed to hit narrow band; selection loss
Primary processing 15% Similar base cost
Freezing + grading + bagging 13% Higher grading labor, more rework/segregation
Packaging & QA/compliance 10% Higher inspection/hold risk, more documentation
Logistics & cold storage 12% Same physics; higher risk cost if rejected
Distributor margin/financing 8% Often negotiated down with volume commitments

C) Halal-certified frozen whole chicken (export program)

Supply Chain Node Cost Ratio (% of landed cost) What typically explains variance
Upstream (DOC + feed + grow-out) 44% Same biology; segregation costs can appear upstream
Primary processing 16% Halal process controls, segregation
Freezing + grading + bagging 10% Similar
Packaging & QA/compliance 12% Halal documentation, audits, export certificates
Logistics & cold storage 10% Route-specific reefer and port handling
Distributor margin/financing 8% Market structure and credit risk

3) One Structural Fact That Explains 80% of Sourcing Outcomes

Frozen whole chicken supply is concentrated in vertically integrated systems, which means:

  • Capacity is not infinitely flexible in the short term (biology + plant throughput).
  • “Supplier diversification” is often really integrator + region diversification.
  • Your negotiation leverage depends on where you sit in their optimization (whole bird vs parts vs byproducts).

Governance control to add

  • Maintain a supplier concentration view by integrator group and by production region (not just legal entity).

Trade-off to surface

  • Single large integrator can offer price and scale, but increases single-point-of-failure risk during disease or trade actions.

4) The Critical Insight: Why Market Signals and Your Supplier Quotes Often Don’t Match

Key insight: In frozen whole chicken, price is a blend of (1) lagged feed economics, (2) sudden risk events, and (3) cold-chain/logistics basis—so two buyers can see very different outcomes in the same month.

Three common “disconnects”

  1. Feed drops but your price doesn’t
  2. Biological lag + integrator hedging + existing frozen inventory buffers.
  3. Global supply is “fine,” but your lane is tight
  4. Cold storage constraints, reefer shortages, port dwell time.
  5. Disease event causes opposite price moves in different regions
  6. Trade bans can create oversupply in one exporting region and shortages in importing regions.

Real-world illustration (trade disruption mechanism)

  • In May 2025, Brazil confirmed HPAI on a commercial farm and multiple countries temporarily halted imports—an example of how quickly availability and price expectations can shift via SPS actions. [3]

5) Where Procurement Teams Commonly Misfire (and why it shows up as OTIF/claims)

  1. Treating “frozen whole chicken” as one spec
  2. Weight band, glazing %, packaging, labeling language, and defect tolerances materially change the bidder pool.
  3. Running RFQs on a calendar, not on market structure
  4. Timing an event into a tightening risk window often yields “phantom competition.”
  5. Optimizing unit price while ignoring cold-chain failure cost
  6. A cheap lane with high temperature excursion risk is often the most expensive option after claims, chargebacks, and delistings.
  7. Assuming “backup supplier” can switch on instantly
  8. True backups need pre-qualification, documentation alignment, and trial orders.

Governance control to add

  • A spec control sheet with “must have / should have / acceptable alternates,” pre-approved by QA and Ops.

Trade-off to surface

  • Tighter specs improve consistency but shrink the supplier pool and increase shortage risk.

6) How an Intelligence-Driven Approach Changes the Outcome (Without Overpromising)

This is not about replacing audits or supplier relationships. It’s about making your decisions earlier and with better evidence.

A) Supplier discovery & pre-qualification shortlists (decision: add/replace suppliers)

What changes

  • Build a defensible longlist by region, certification signals, export program fit, and cold-chain readiness.

Evidence boundary

  • Capacity and compliance claims are signals until validated.

Validation steps (non-negotiable)

  • Desk-based doc check → plant audit plan → trial order → temperature logger review.

B) Benchmarking & should-cost drivers (decision: negotiate, renew, or rebid)

What changes

  • Separate “market move” from “supplier premium” using driver narratives (feed/energy/logistics).

Evidence boundary

  • Benchmark ranges are context, not a guarantee of achievable price.

Validation steps

  • Request supplier cost breakdown (even simplified) and compare to driver movements; reconcile with your receipt history.

C) Price intelligence & trend monitoring (decision: event timing, contract length)

What changes

  • Identify when price is moving structurally vs noise; set rebid triggers.

Validation steps

  • Cross-check alerts against: supplier quotes, internal receipts, and inventory position.

D) Supply chain risk monitoring (decision: activate contingency plan)

What changes

  • Convert “news” into actionable triggers: disease events, trade restrictions, logistics chokepoints.

Evidence boundary

  • Risk monitoring is probability-weighted; it cannot predict exact outage timing.

Validation steps

  • Run a weekly risk review with Ops/QA: confirm exposure by lane and supplier; pre-book cold storage/reefer where needed.

7) Strategic Use Cases Procurement Leaders Actually Run (and the KPIs that matter)

Use case 1: Reduce cost volatility without sacrificing service

  • Decision: extend vs rebid; indexation vs fixed price; lock volume vs flexible.
  • KPIs: budget variance, landed-cost variance, OTIF, expedite spend.
  • Governance control: define a volatility band and pre-agreed renegotiation clauses.

Use case 2: Build disruption-ready dual sourcing (HPAI + logistics shocks)

  • Decision: dual-source by region/integrator; pre-negotiate framework terms.
  • KPIs: time-to-switch, fill rate during disruption, concentration risk.
  • Governance control: “activate backup” triggers (e.g., trade halt, port dwell-time spike, repeated temperature excursions).

Use case 3: Spec flexibility to expand the supplier pool (without breaking QA)

  • Decision: widen weight band, adjust packaging, approve alternate labels.
  • KPIs: number of qualified bidders, event competitiveness, defect/hold rate.
  • Governance control: controlled trials + codified approved alternates.

Use case 4: Scorecards that change behavior (not just reporting)

  • Decision: supplier status tiering, corrective actions, volume reallocations.
  • KPIs: OTIF, temperature excursion incidents, claim rate, QA hold rate.
  • Governance control: tie performance tiers to contract consequences (chargebacks, probation, volume caps).

8) Why This Matters Beyond Chicken (Examples Your Team Likely Also Buys)

The same intelligence-led mechanics apply whenever biology, compliance, and logistics interact.

  • Frozen shrimp / seafood: disease and farm shocks + strict cold chain + residue testing → similar “risk-trigger sourcing.”
  • Dairy (butter, SMP): feed and energy drivers + export policy + inventory buffers → similar price-lag behavior.
  • Coffee / cocoa: weather and origin concentration + quality grading → similar spec-driven supplier pool constraints.
  • Edible oils: geopolitical and freight basis risk → similar landed-cost volatility and timing of buys.

Transferable governance pattern

  • Define triggers, maintain pre-qualified alternates, and run lane-level landed cost models—not just unit price comparisons.

9) Why Frozen Whole Chicken Is a Strong Proof Point for Intelligence-Led Sourcing

Frozen whole chicken is a harsh test because it forces procurement to manage all four at once:

  • Cost: feed and energy-driven, with lag effects.
  • Continuity: disease and SPS actions can reshape trade quickly.
  • Compliance: documentation and certification failures stop shipments.
  • Resilience: cold chain failures convert into claims, waste, and service breakdowns.

If your team can institutionalize:

  1. spec discipline,
  2. driver-based negotiation,
  3. risk triggers, and
  4. validated supplier benches

…you reduce emergency buys, improve OTIF, and make sourcing decisions easier to defend in audits and finance reviews.

Tridge Eye Data Intelligence Solution

Make Faster, Data-Driven Sourcing Decisions

The insights in this report are just the starting point. Tridge Eye is the data intelligence solution that gives procurement and sourcing leaders real-time market signals, price benchmarks, and supply risk alerts — so you can act before the market moves.

Explore Tridge Eye →

References

  1. fsis.usda.gov
  2. fao.org
  3. apnews.com
  4. fao.org
Subscribe
By subscribing you agree to with our Privacy Policy and provide consent to receive updates from our company.
Thank you! Your submission has been received!
Oops! Something went wrong while submitting the form.
Subscribe to receive the latest blog posts, updates, promotions, and announcements from Tridge.