
This report is powered by Tridge Eye Data Intelligence.
Every data point, price signal, and supply risk insight in this analysis comes from the same platform that procurement and sourcing leaders worldwide rely on daily. As you read, consider what this level of market intelligence could do for your sourcing decisions.
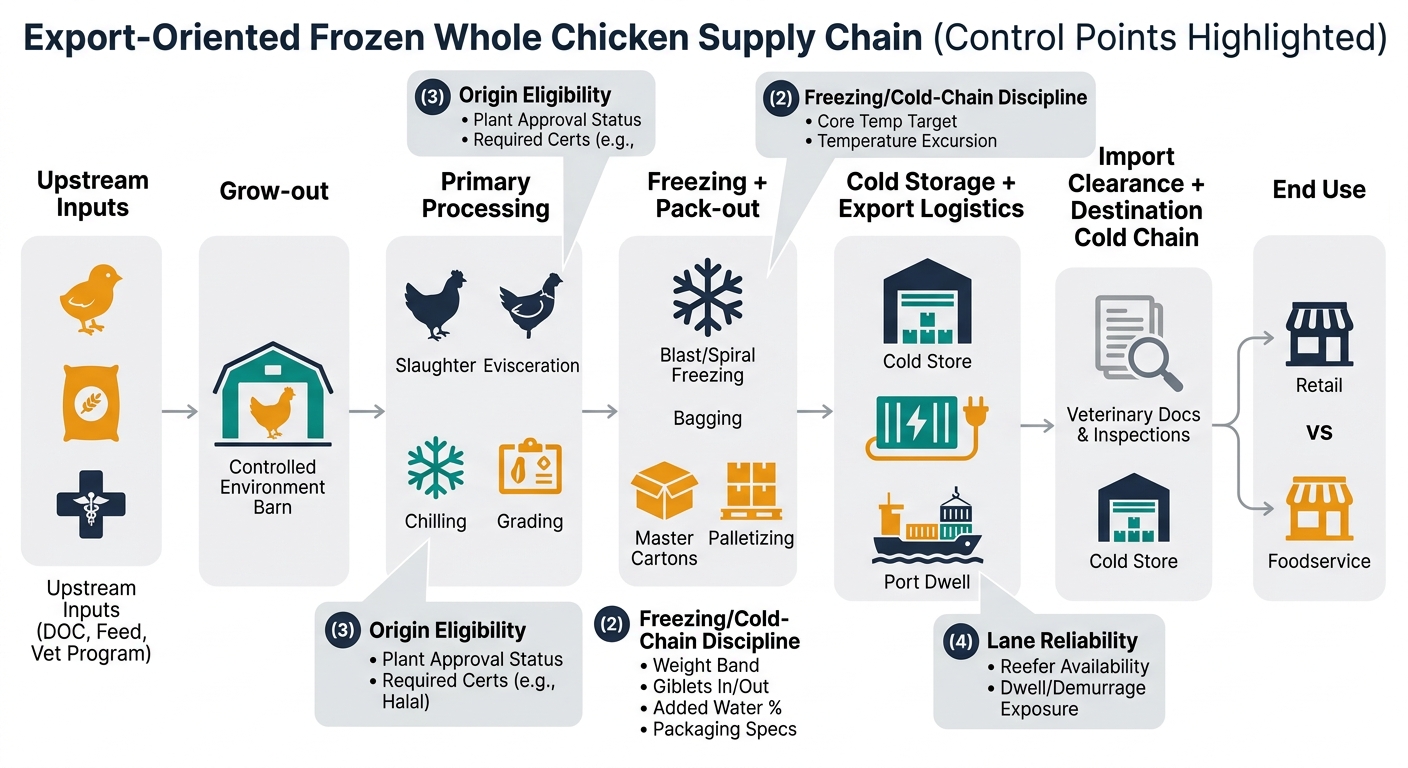
Frozen whole chicken looks like a simple commodity, but procurement outcomes are usually decided by a small set of controllable “control points”: spec comparability, freezing/cold-chain discipline, origin eligibility, and lane reliability. This guide is written for procurement leaders who are strong in sourcing fundamentals but newer to the poultry vertical—so it focuses on what changes in frozen whole bird buying versus other food categories.
(Analyzed at: Apr, 2026)
Frozen whole chicken looks like a simple commodity, but procurement outcomes (landed cost variance, fill rate, claims, auditability) are driven by where the bird sits in the chain when risk hits.
Below is a decision-useful view of cost build by node. Percentages are illustrative ranges because actual ratios vary by origin, energy prices, freight lane, product spec (weight band, giblets, packaging), and contract terms.
Key insight: Feed is typically the dominant swing factor. In published broiler economics, feed is often cited at roughly ~65–75% of production cost (systems vary by country and integration model) [2].
What procurement should watch (even if you don’t buy feed):
Key insight: Processing is where yield and downgrade risk becomes real cost.
Procurement implications:
Key insight: Freezing is both a cost center (energy + equipment) and a compliance/quality control point.
Procurement implications:
Key insight: Logistics is often a large variance driver in landed cost for export lanes.
Procurement implications:
Key insight: Border holds are a cost and service-level risk.
Procurement implications:
Key insight: Whole bird economics are influenced by what else the plant can monetize.
Procurement implications:
Modeled ranges to show where cost concentrates. Use as a framework for should-cost conversations and contract structure—not as a quote.

| Supply chain node | Cost ratio (illustrative) | What drives variance most |
|---|---|---|
| Upstream + grow-out | 45–60% | Feed (corn/soy), mortality, FCR |
| Primary processing | 10–18% | Yield/condemnations, labor, throughput |
| Freezing + pack-out | 6–12% | Energy, freezing capacity, packaging quality |
| Cold storage + logistics | 10–20% | Reefer/ocean rates, port dwell, inland cold chain |
| Import + destination distribution | 3–8% | Clearance holds, cold store fees |
| Channel margin | 5–15% | Distributor/wholesale structure |
| Supply chain node | Cost ratio (illustrative) | What drives variance most |
|---|---|---|
| Upstream + grow-out | 40–55% | Feed + tighter live-bird spec compliance |
| Primary processing | 12–22% | Grade-out, cosmetic defects, trimming losses |
| Freezing + pack-out | 8–15% | Retail bag/carton, labeling, QA intensity |
| Cold storage + logistics | 10–18% | Lane reliability, temperature control |
| Import + destination distribution | 3–8% | Documentation accuracy, inspections |
| Channel margin | 8–20% | Retail program economics |
| Supply chain node | Cost ratio (illustrative) | What drives variance most |
|---|---|---|
| Upstream + grow-out | 40–55% | Feed + program compliance |
| Primary processing | 12–22% | Segregation, audit overhead, throughput |
| Freezing + pack-out | 7–14% | Labeling/market-specific packaging |
| Cold storage + logistics | 10–20% | Reefer capacity + port dwell |
| Import + destination distribution | 3–10% | Certificate acceptance, border holds |
| Channel margin | 5–15% | Importer/distributor structure |
Procurement takeaway: you’re not just managing suppliers—you’re managing origin eligibility + lane feasibility + cold-chain capacity.
Frozen whole chicken is famous for procurement surprises because three pricing layers move on different clocks:
So two suppliers can quote the same FOB price, but your outcomes differ materially in:
These are common failure modes when the buyer is experienced in other categories but newer to poultry:
Below is how procurement decisions improve when intelligence is embedded into the category cadence.
Use supplier discovery & qualification support plus comparative profiling to build a longlist that is actually usable for frozen whole birds:
Outcome impact: reduced time-to-switch suppliers; lower concentration risk.
Use price intelligence & cost driver tracking to separate:
Then choose contract posture:
Outcome impact: lower budget variance; fewer pricing disputes; clearer finance narrative.
Use supply chain risk monitoring to define triggers tied to poultry realities:
Pair with alternative origin scenario building:
Outcome impact: faster contingency activation; fewer emergency spot buys.
Use procurement performance analysis to standardize:
Outcome impact: QBRs become evidence-based; leadership gets consistent risk reporting.
Frozen whole chicken is a strong example because it combines biology + regulation + cold chain. The same intelligence-driven approach typically improves outcomes in adjacent procurement categories that many poultry buyers also touch:
Common thread: benchmarks are necessary, but procurement performance is won by spec control, lane feasibility, and pre-built contingencies.
This category makes the value of intelligence tangible because results show up in measurable procurement outcomes:
If you can run frozen whole chicken with discipline—spec equivalency, cold-chain risk, and origin contingency—you can usually raise the sourcing maturity of multiple food categories with the same operating model.

Make Faster, Data-Driven Sourcing Decisions
The insights in this report are just the starting point. Tridge Eye is the data intelligence solution that gives procurement and sourcing leaders real-time market signals, price benchmarks, and supply risk alerts — so you can act before the market moves.


