INDUSTRY TRENDS

Frozen Sardine Procurement Intelligence Playbook (2026): Total Landed Cost, Cold-Chain Risk, and Spec Control

Author
Team Tridge
DATE
April 9, 2026
9 min read
frozen-sardine Cover
Tridge Eye Data Intelligence Solution

This report is powered by Tridge Eye Data Intelligence.

Every data point, price signal, and supply risk insight in this analysis comes from the same platform that procurement and sourcing leaders worldwide rely on daily. As you read, consider what this level of market intelligence could do for your sourcing decisions.

Explore Tridge Eye →

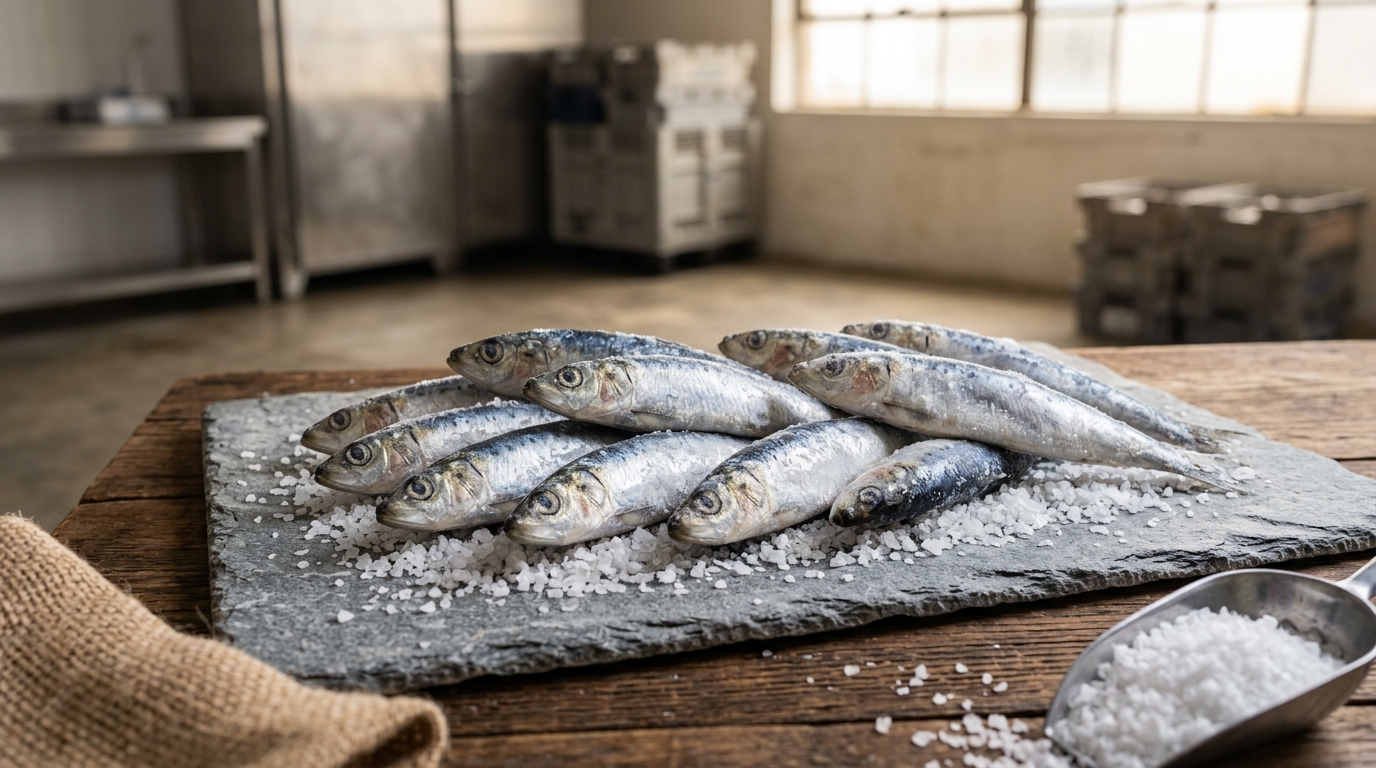
Frozen sardines can look like a simple commodity line-item, but the outcomes procurement leaders are judged on—service levels, true landed cost, and audit-ready compliance—are determined upstream by seasonality, freezing capacity, glaze/net weight terms, and cold-chain execution. This guide translates those realities into practical buying decisions (contract timing, supplier selection, spec flexibility, and contingency planning) using evidence you can operationalize with QA, Ops, and Finance.

Executive Summary

  • Most “savings” leakage is self-inflicted: unclear payable basis (gross vs net deglazed), weak temperature/record requirements, and over-tight size specs during peak season.
  • -18°C is a real operational anchor: Codex references -18°C as the completion/holding benchmark for quick-frozen fish and frozen storage; procurement should contract to evidence of temperature control, not just a set-point claim [1].
  • Glazing is protective but commercially risky: glaze % varies materially by product/handling; Codex provides a method framework for determining net content/deglazing conditions—use it to standardize payable weight verification [2].
  • Histamine control is upstream; freezing doesn’t “fix” it: FDA guidance emphasizes time/temperature control and that freezing/cooking does not destroy histamine already formed—so procurement terms must require process records and corrective actions [3].
  • Origin policy shocks are current, not theoretical: Morocco implemented a one-year licensing restriction for exports of fresh/frozen sardines effective February 1, 2026 (commonly reported as an export “ban” in trade press). If you depend on Moroccan supply, you should treat this as a continuity trigger [4].

Key Insights

(Analyzed at: Apr, 2026)

  • Strategy: Hold
  • Reliability: Medium
  • Potential Saving: 4% ~ 10%
  • Insight: Given Morocco’s export restriction regime effective February 1, 2026 and the ongoing variability in reefer logistics, the best near-term value is not aggressive spot-chasing—it’s tightening your payable basis (net deglazed kg), standardizing temperature evidence/claims language, and pre-qualifying at least one alternate origin/processor lane. Teams typically capture 4–10% in “silent savings” via net-weight and claim-rate reduction while lowering stockout risk [4].

1) The Ground Truth: How Frozen Sardines Actually Flow From Sea to Your Dock

Frozen sardines look like a simple commodity, but procurement outcomes are determined by a few hard constraints that sit upstream of the quote.

What makes frozen sardines different from many other frozen proteins:

  • Supply is seasonal and biologically variable. Catch volumes and size distribution can swing quickly with ocean conditions and management decisions.
  • Quality is time/temperature sensitive early, then oxidation sensitive later. If fish aren’t chilled quickly after capture and frozen fast, defects (soft texture, gaping, rancid notes) and food-safety risk (histamine) escalate.
  • “Frozen” doesn’t mean “safe from cost leakage.” Glaze %, net weight definitions, temperature excursions in ports, and demurrage/reefer plug delays can turn a low unit price into a high total landed cost.
  • Origin risk is real. When a major supplying origin restricts exports, downstream buyers feel it immediately (e.g., Morocco export licensing restrictions effective Feb 1, 2026) [4].

Reference flow (typical for food-grade frozen whole sardines):

  1. Fishing & landing (vessel handling, time-to-chill, landing/auction)
  2. Primary processing & freezing (grading by size, IQF or block freezing, glazing)
  3. Cold storage & export (origin cold store, documentation, container stuffing)
  4. Ocean freight & import handling (reefer container, port dwell, inspections)
  5. Destination cold storage & distribution (3PL cold store, order picking)
  6. Buyer receiving & QA release (temperature checks, deglaze/net weight verification, sensory/defect checks)
A left-to-right (or top-to-bottom) flow diagram showing the reference flow for food-grade frozen whole sardines: (1) Fishing & landing (time-to-chill), (2) Primary processing & freezing (grading, IQF vs block, glazing), (3) Origin cold storage & export readiness (container stuffing, docs), (4) Ocean freight & import handling (reefer, port dwell), (5) Destination cold storage & distribution (3PL), (6) Buyer receiving & QA release (core temp check, deglaze/net weight test, sensory/defect checks). Add 2–3 small callouts at the highest-risk nodes: 'Time/Temp control (histamine)', 'Glaze/net weight payable basis', 'Port dwell/reefer plug risk'. Use clean icons (boat, factory, snowflake, container/ship, warehouse, clipboard/thermometer) and avoid any dashboard-like UI elements.

2) Where Cost and Margin Accumulate (Node-by-Node) — and What Procurement Can Actually Influence

Below is the practical cost-and-margin logic procurement teams can use to separate real market pressure from avoidable leakage.

2.1 Fishing & Landing (Raw Material Supply)

Key insight: The true raw material cost is driven more by catch rates, fuel, and access rules than by processing efficiency. When landings fall, everything downstream tightens with a lag.

What drives cost here

  • Fuel and vessel operating cost
  • Catch rates (how hard it is to find and catch fish)
  • Seasonal openings/closures and quota-like controls
  • Landing fees and auction dynamics (where used)

Procurement levers (indirect, but real)

  • Diversify origins before tight seasons (avoid forced spot buying)
  • Contract structures that recognize seasonality (split awards; indexed components)

2.2 Primary Processing & Freezing (Grading, IQF vs Block, Glazing)

Key insight: This is the node where spec decisions create hidden cost. The same “sardine” can price very differently once you lock in size count, freezing format, and glaze/net weight terms.

What drives cost here

  • Freezing energy and throughput (blast/IQF capacity is a bottleneck in peak season)
  • Labor for sorting/grading and packing
  • Packaging materials (cartons, liners)
  • Glazing practices: glaze protects against dehydration/oxidation, but it also creates commercial ambiguity unless net weight is controlled

Evidence points to use in negotiations

  • Glazing is a recognized protective practice, and its percentage varies with product size/shape and process control; FAO technical guidance notes glaze % can vary considerably even at the same thickness and can be controlled via time/temperature/process discipline [2].
  • Codex standards include methods to determine net content of frozen glazed fish, including deglazing under standardized conditions—use this as the backbone for a buyer/supplier test SOP [5].

Procurement levers

  • Define payable basis: “price per kg net deglazed weight” (and attach a deglaze test protocol + sampling frequency)
  • Allow controlled spec flexibility when supply is tight (size range tolerance; block vs IQF substitution)

2.3 Origin Cold Storage & Export Readiness

Key insight: Cold storage is where working capital and claims risk build quietly. Delays here increase oxidation risk and can push sellers to prefer buyers with faster lift schedules.

What drives cost here

  • Origin cold-store fees and electricity
  • Container availability and stuffing schedules
  • Documentation readiness (catch/traceability, health certificates)

Procurement levers

  • Book lift windows aligned to production runs
  • Require temperature records and loading protocols (pallet airflow, pre-cooling)

2.4 Ocean Freight & Import Handling (Reefer Reality)

Key insight: “Frozen” is usually managed around -18°C or colder in international standards and practice, but performance depends on container condition, port dwell time, and power/plug availability.

Useful operational facts

  • Codex references -18°C as the benchmark for frozen storage facilities and as the “complete” point for quick-freezing at the thermal center (after stabilization) [1].

What drives cost here

  • Reefer freight rates and surcharges
  • Port congestion and dwell time (demurrage + temperature risk)
  • Inspection/hold risk (paperwork mismatches, sampling)

Procurement levers

  • Negotiate Incoterms with clear risk transfer points
  • Put temperature excursion thresholds into contracts (who pays for what, what evidence is required)

2.5 Destination Cold Storage & Distribution

Key insight: This node often becomes the “shock absorber” for seasonality—meaning it drives inventory carrying cost and can hide fill-rate problems until they become urgent.

What drives cost here

  • 3PL storage and handling
  • Inventory shrink/claims
  • Rework (relabeling, repacking, regrading)

Procurement levers

  • Align order cadence to reduce long dwell times
  • Use supplier OTIF and claim rates as commercial levers

2.6 Buyer Receiving & QA Release

Key insight: If QA checks are not designed around sardine-specific failure modes (glaze, oxidation, temperature history), procurement will keep paying for avoidable defects.

Food safety reminder (not legal advice): Histamine risk is managed primarily by time-temperature control; FDA guidance emphasizes preventive controls and that freezing/cooking does not destroy histamine already formed [3].

Procurement levers

  • Standard receiving checklist: core temp, packaging integrity, deglaze/net weight test, sensory (rancid/painty), defect counts
  • Tie corrective actions to supplier scorecards (chargebacks, tighter release rules, or temporary holds)

Product-Level Cost Breakdown (Illustrative % of Final Delivered Cost)

Modeled to show where cost concentrates; actual ratios vary by origin, season, freight cycle, and contract terms. These are intentionally “order-of-magnitude” ratios for management discussions—not a market price index.

A stacked bar chart with three bars labeled: 'Block Frozen', 'IQF (Graded)', and 'H&G'. Each bar is segmented by supply chain node using the article’s illustrative ratios: Fishing & landing; Primary processing & freezing; Origin cold storage & export prep; Ocean freight & import handling; Destination cold storage & distribution; Buyer receiving/QA/downstream margin. Include percentage labels inside segments and a consistent color legend. Add a small footnote: 'Illustrative allocation; varies by origin/season/freight/terms.' Keep the design data-forward and avoid any product UI/dashboard framing.

A) Frozen Whole Sardines — Block Frozen (Bulk Cartons)

Supply Chain Node Cost Ratio (% of Final Cost) Notes
Fishing & landing (raw material) 45% Catch rates/fuel/seasonality dominate
Primary processing & freezing 18% Sorting, freezing energy, cartons
Origin cold storage & export prep 7% Cold store + documentation + stuffing
Ocean freight & import handling 15% Reefer rates + port dwell/fees
Destination cold storage & distribution 6% 3PL storage/handling
Buyer receiving, QA, and downstream margin 9% QA labor, claims reserve, internal handling

B) Frozen Whole Sardines — IQF (Graded by Size)

Supply Chain Node Cost Ratio (% of Final Cost) Notes
Fishing & landing (raw material) 40% Same drivers, but higher value capture
Primary processing & freezing 24% IQF throughput and grading add cost
Origin cold storage & export prep 7% Similar
Ocean freight & import handling 14% Similar
Destination cold storage & distribution 6% Similar
Buyer receiving, QA, and downstream margin 9% More spec enforcement (size/glaze)

C) Frozen Sardines — H&G (Headed & Gutted, where used)

Supply Chain Node Cost Ratio (% of Final Cost) Notes
Fishing & landing (raw material) 38% Higher unit value, but yield loss matters
Primary processing & freezing 28% Labor + yield loss + QA controls
Origin cold storage & export prep 7% Similar
Ocean freight & import handling 13% Similar
Destination cold storage & distribution 6% Similar
Buyer receiving, QA, and downstream margin 8% More defect opportunities (trim, damage)

3) One Structural Fact That Explains Most Procurement Surprises: “Sardine Supply” Is Not One Market

Procurement teams often treat sardines as interchangeable, but supply is segmented by:

  • Species and substitution risk (sardine vs sardinella; labeling and market acceptance)
  • Catch area and management regime (which determines volatility)
  • Product form (block vs IQF vs H&G) and spec tightness (size count)
  • Channel competition (food vs bait vs reduction into fishmeal/oil can create a price floor)

Why this matters: your incumbent supplier’s quote may be reacting to a constraint your benchmark suppliers don’t share (different fishery timing, different freezing bottleneck, different buyer competition).

4) The Critical Insight for Buyers: Why “Cheap” Frozen Sardines Become Expensive (Glaze + Cold-Chain + Spec)

The most common disconnect is between invoice price and payable, usable protein delivered on time.

Three repeatable leakage mechanisms:

  1. Glaze ambiguity
  2. If you buy “10 kg cartons inclusive of glaze” without enforcing deglazed net weight, you can pay materially different effective prices between suppliers.
  3. Glazing % can vary materially by product geometry and process; treat it as a controlled variable with a test method, not a “supplier promise” [2].
  4. Cold-chain variability
  5. Port dwell and plug/unplug events increase risk of temperature excursions, texture damage, and claims.
  6. -18°C is a widely referenced benchmark for frozen storage/quick-frozen products, but execution varies by lane and equipment [1].
  7. Over-tight specs during tight seasons
  8. Narrow size counts or strict defect tolerances can force spot buying or late shipments when size distribution shifts.

5) How Procurement Teams Typically Get Frozen Sardines Wrong (Even When They’re Good at Other Categories)

Pattern 1: Treating supplier quotes as comparable when the payable basis differs

  • Comparing $/kg “gross” across suppliers with different glaze assumptions and pack weights.

Pattern 2: Qualifying “backup suppliers” only on paper

  • Supplier looks acceptable until the first disruption—then lead times, documentation, and cold-chain execution fail under pressure.

Pattern 3: Managing food safety as a QA-only topic

  • Histamine and temperature control are upstream process controls; procurement terms (records, rejection rights, corrective actions) are part of prevention [3].

Pattern 4: Underestimating origin policy shocks

  • Example: Morocco implemented an export restriction regime (widely described as a “ban,” operationalized via licensing controls) effective February 1, 2026 for sardine exports, explicitly tied to domestic supply/price and stock concerns—directly disrupting buyers dependent on Moroccan frozen sardines [4].

6) What an Intelligence-Driven Workflow Changes (Decision-Grade, Not “More Data”)

This is how procurement leadership uses intelligence outputs to make auditable decisions across cost, continuity, and compliance.

Decision 1: When to lock contracts vs stay flexible

Evidence to assemble

  • Origin landing signals and policy shifts (closures, export restrictions/licensing)
  • Freight/port dwell risk by lane
  • Price benchmarks by product form (IQF vs block) and spec

Service capabilities that matter (keep it tight):

  • Price intelligence & cost drivers (separate raw material pressure from logistics and spec)
  • Supply chain risk monitoring (alerts tied to origin policy and logistics disruption)

Management-ready thresholds

  • If reefer dwell time (or port congestion indicators) increases beyond an internal threshold (e.g., +20% vs 3-month average), shift more volume to suppliers with proven OTIF on alternate lanes.
  • If a key origin announces an export restriction effective within 30–60 days, trigger contingency awards and spec-flex review.

Decision 2: How to build real backup supply (not theoretical)

Evidence to assemble

  • Export history signals (ability to ship to your market)
  • Cold-chain capability indicators (cold store access, container loading discipline)
  • Quality/compliance posture (traceability docs, temperature records, defect patterns)

Service capabilities that matter:

  • Alternative supplier/origin identification
  • Supplier benchmarking (lead time stability, complaint/claim proxies, term norms)

7) Strategic Use Cases Procurement Leaders Can Operationalize in 60–90 Days

Use case A: Reduce total landed cost volatility without raising stockout risk

  • Build a lane-by-lane landed cost model (raw + processing + glaze effect + freight + port fees + storage)
  • Create a negotiation checklist focused on:
  • Payable basis (net deglazed weight)
  • Temperature record requirements
  • Substitution rules (IQF ↔ block; size tolerance bands)

Use case B: Pre-qualify backup origins for continuity

  • Map dependency by origin + processor (not just “supplier name”)
  • Pre-approve a switching plan:
  • Spec concessions allowed (size range, packaging)
  • QA release tests and acceptance criteria
  • Lead time and minimum inventory targets

Use case C: Governance pack for seafood sourcing approvals and audits

  • Standard supplier scorecards including:
  • OTIF trend
  • Claims rate (temperature, net weight, rancidity)
  • Documentation completeness
  • Decision logs: why supplier A won volume vs supplier B, tied to evidence and thresholds

8) Why This Matters Beyond Sardines (Examples from Adjacent Categories You Likely Buy)

Frozen sardines are a clean example of a broader procurement truth: the biggest risks sit where specs and logistics meet biology.

Similar patterns show up in:

  • Frozen shrimp (glaze and net weight): payable yield can diverge sharply if deglaze controls are weak.
  • Frozen tuna/other histamine-formers: time-temperature control and records are procurement-relevant because histamine is not removed by freezing/cooking and is controlled upstream [6].
  • Frozen berries/veg: cold-chain interruptions drive claims and service failures; supplier OTIF and lane performance matter as much as unit price.

9) Why This Frozen Sardine Example Is a Strong “Proof Case” for Procurement Intelligence

Because it forces management teams to balance four outcomes at once—using evidence, not instinct:

  • Total landed cost control: prevent glaze and cold-chain leakage from erasing “savings.”
  • Supply continuity: diversify before disruptions (e.g., export restrictions) force spot buys [4].
  • Food safety and compliance risk reduction: embed time-temperature and documentation expectations into commercial terms [3].
  • Governance: scorecards, thresholds, and decision logs that stand up in internal approvals and audits.
Tridge Eye Data Intelligence Solution

Make Faster, Data-Driven Sourcing Decisions

The insights in this report are just the starting point. Tridge Eye is the data intelligence solution that gives procurement and sourcing leaders real-time market signals, price benchmarks, and supply risk alerts — so you can act before the market moves.

Explore Tridge Eye →

References

  1. fao.org
  2. fao.org
  3. fda.gov
  4. en.7news.ma
  5. alimentosargentinos.magyp.gob.ar
  6. en.wikipedia.org
Subscribe
By subscribing you agree to with our Privacy Policy and provide consent to receive updates from our company.
Thank you! Your submission has been received!
Oops! Something went wrong while submitting the form.
Subscribe to receive the latest blog posts, updates, promotions, and announcements from Tridge.