

This report is powered by Tridge Eye Data Intelligence.
Every data point, price signal, and supply risk insight in this analysis comes from the same platform that procurement and sourcing leaders worldwide rely on daily. As you read, consider what this level of market intelligence could do for your sourcing decisions.
Frozen raspberries behave like a commodity only on the surface. In practice, procurement outcomes (landed cost stability, supply continuity, rejection rate, and OTIF) are driven by three things you can control: spec clarity (format/grade/defects), approved-supply depth (qualification speed + alternates), and contract governance (price + service + quality triggers). This guide maps the real supply chain, explains where cost and risk accumulate, and shows how to structure RFQs and contracts so you can negotiate and govern suppliers with fewer surprises.
(Analyzed at: Apr, 2026)
Frozen raspberries look like a simple commodity line item until you map the flow from hand-picked fruit to IQF or block to import cold stores to your plant’s yield and QA outcomes.
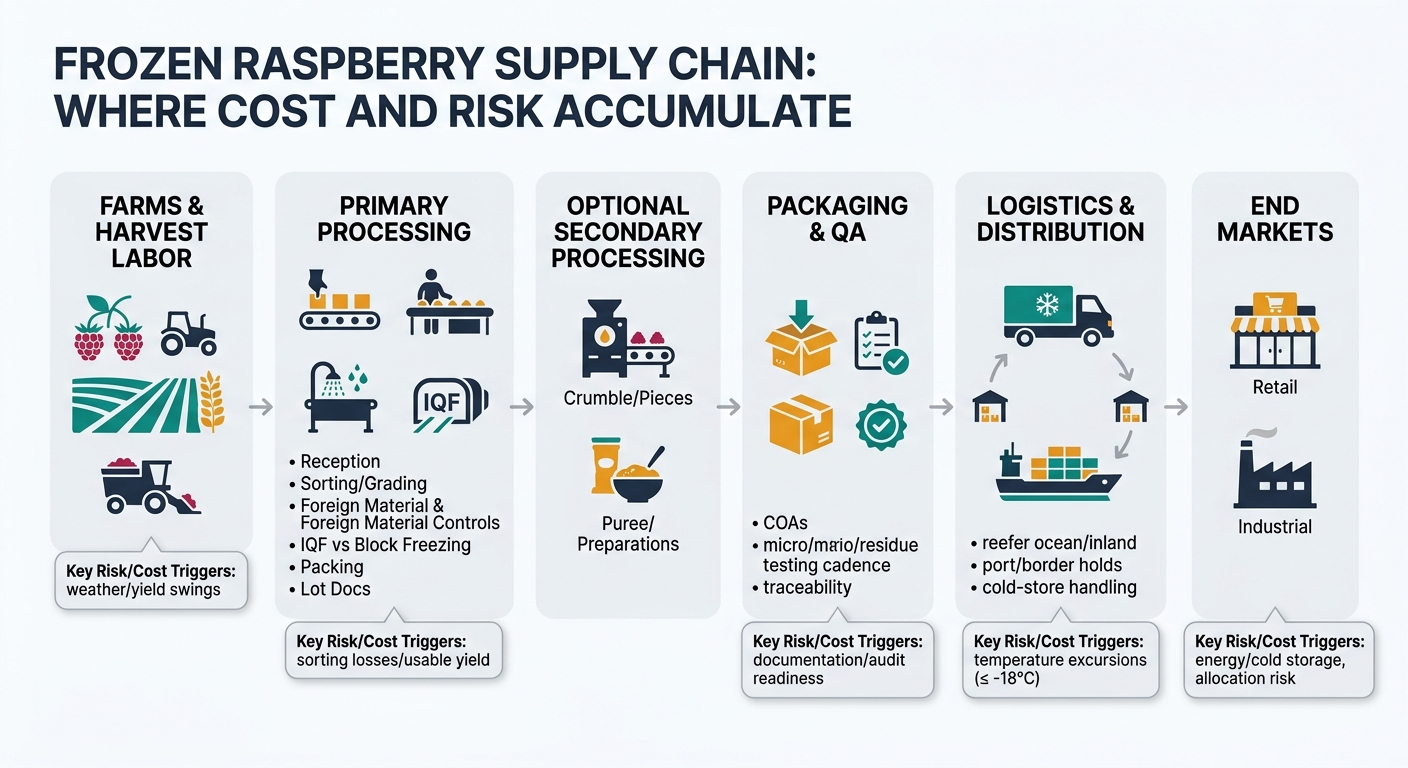
Key insight: Frozen raspberries are a “spec-driven commodity.” Price and risk are dominated by (a) origin crop reality, (b) format (IQF vs block), and (c) your defect/yield tolerance—not just supplier negotiation skill.
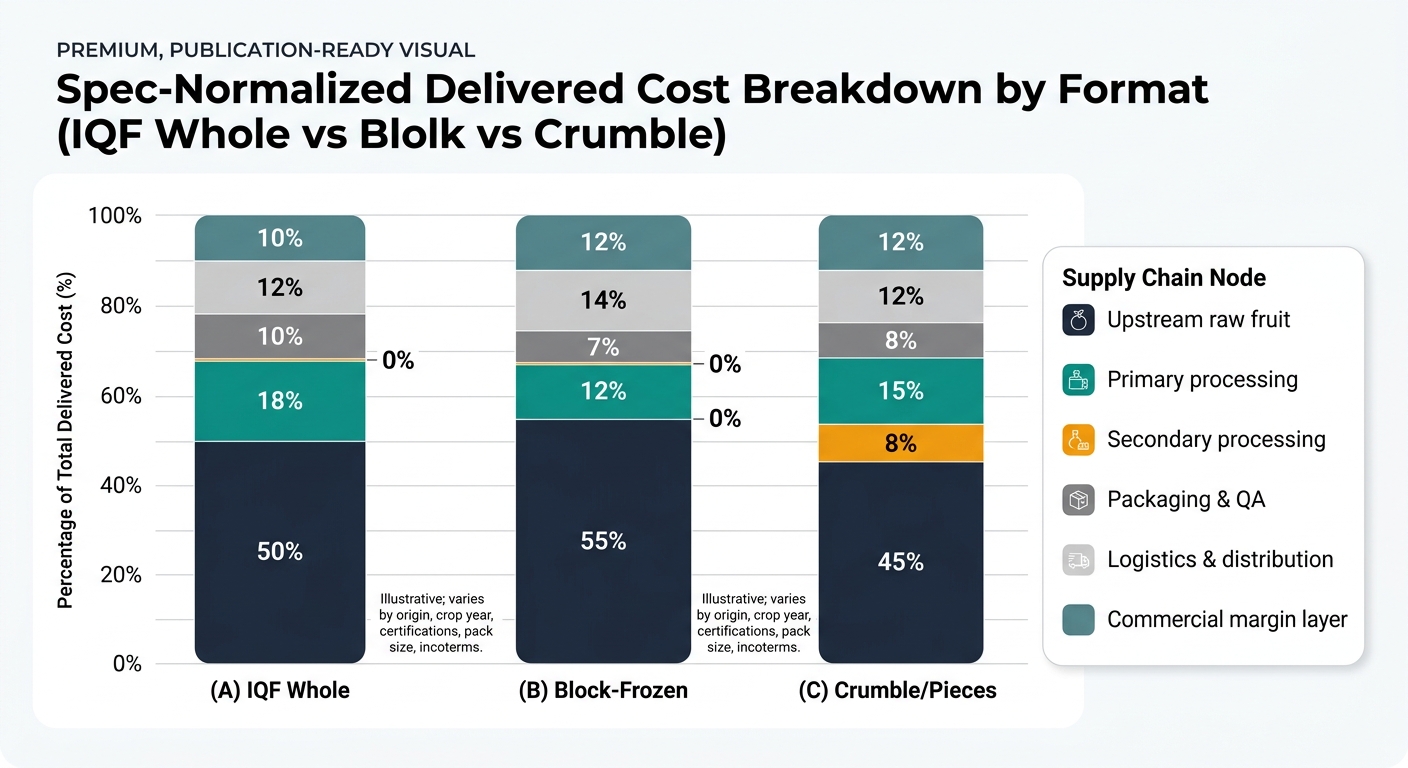
Modeled as % of final delivered cost to your receiving dock. Actual ratios vary by origin, crop year, certifications, pack size, and incoterms.
| Supply Chain Node | Cost Ratio (% of Final) | What moves it most |
|---|---|---|
| Upstream raw fruit | 50% | Crop size/quality, harvest labor |
| Primary processing (IQF) | 18% | Sorting intensity, energy, yield loss |
| Secondary processing | 0% | N/A |
| Packaging & QA | 10% | Testing cadence, traceability, pack spec |
| Logistics & distribution | 12% | Reefer + cold-store + port delays |
| Commercial margin layer | 10% | Allocation tightness, credit terms |
| Supply Chain Node | Cost Ratio (% of Final) | What moves it most |
|---|---|---|
| Upstream raw fruit | 55% | Fruit price and grade mix |
| Primary processing (block) | 12% | Energy and throughput |
| Secondary processing | 0% | N/A |
| Packaging & QA | 7% | Bulk pack materials + COA discipline |
| Logistics & distribution | 14% | Heavier reliance on cold-store handling |
| Commercial margin layer | 12% | Spot buying vs contract coverage |
| Supply Chain Node | Cost Ratio (% of Final) | What moves it most |
|---|---|---|
| Upstream raw fruit | 45% | Crop quality (more crumble availability) |
| Primary processing | 15% | Sorting strategy, defect removal |
| Secondary processing | 8% | Sizing, rework, additional handling |
| Packaging & QA | 8% | Spec testing, lot segregation |
| Logistics & distribution | 12% | Lane and cold-store costs |
| Commercial margin layer | 12% | Demand spikes from substitution |
Even when global production looks adequate, procurement teams get squeezed because:
Procurement teams often expect IQF and block to move together because they start from the same fruit. They don’t—because the grade mix and yield economics differ.
The same “spec-driven commodity” logic shows up in categories procurement teams often manage alongside berries:
Key takeaway: Intelligence is most valuable where (1) supply is seasonal, (2) specs create hidden segmentation, and (3) disruptions convert quickly into real P&L impact.
Frozen raspberries concentrate the hardest procurement problems into one category:

Make Faster, Data-Driven Sourcing Decisions
The insights in this report are just the starting point. Tridge Eye is the data intelligence solution that gives procurement and sourcing leaders real-time market signals, price benchmarks, and supply risk alerts — so you can act before the market moves.


