INDUSTRY TRENDS

Frozen Pumpkin Sourcing (2026): A Procurement Guide to Cost Drivers, Supply Risk, and Better Buying Decisions

Author
Team Tridge
DATE
March 18, 2026
10 min read
frozen-pumpkin Cover
Tridge Eye Data Intelligence Solution

This report is powered by Tridge Eye Data Intelligence.

Every data point, price signal, and supply risk insight in this analysis comes from the same platform that procurement and sourcing leaders worldwide rely on daily. As you read, consider what this level of market intelligence could do for your sourcing decisions.

Explore Tridge Eye →

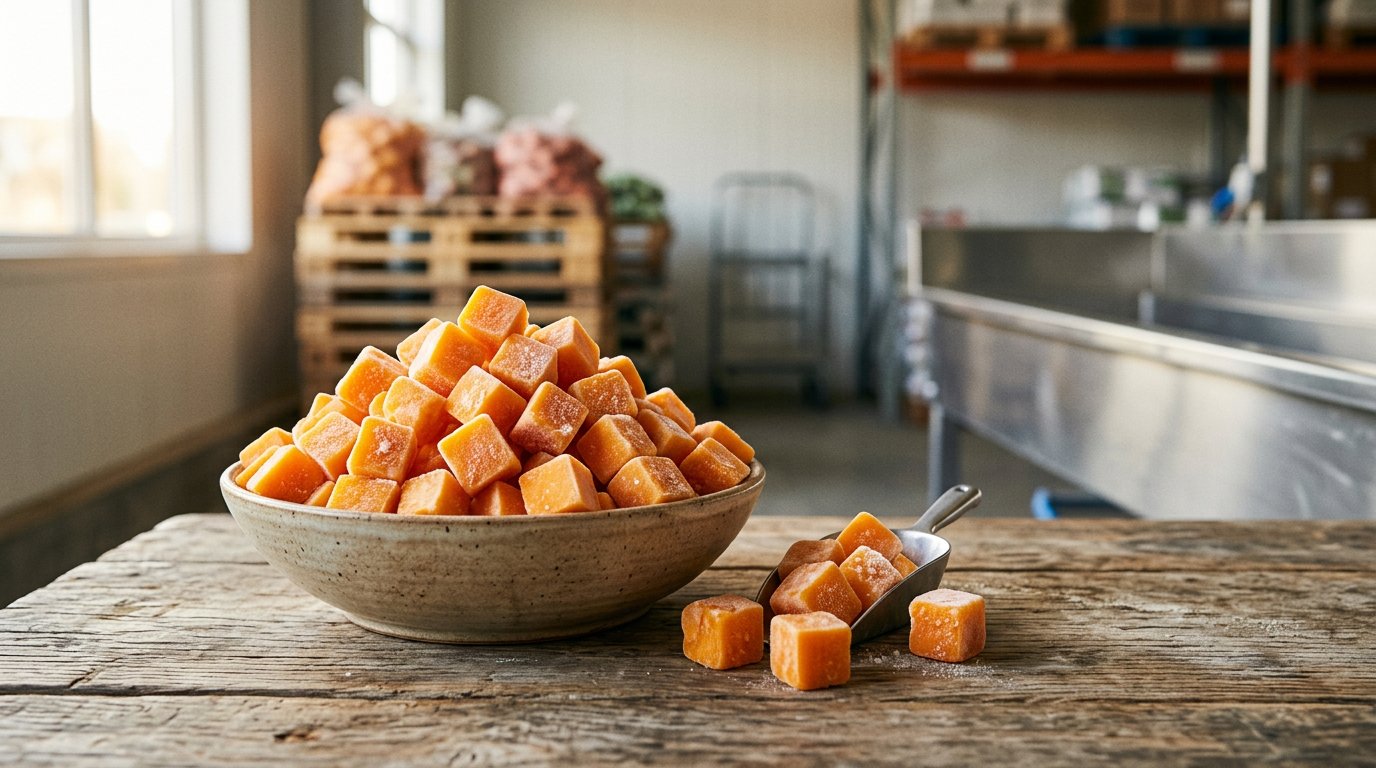
Frozen pumpkin is easy to treat like a standard frozen-veg line item—until a harvest-quality swing, a plant constraint, or a cold-chain disruption turns into allocation, spec drift, or emergency buys.

This guide is written for procurement and sourcing managers who are strong in general sourcing but newer to frozen pumpkin. It translates the category’s “product reality” (puree vs. dice, solids/Brix, cut integrity, cold chain) into practical levers: how to structure contracts, how to avoid hidden yield costs, how to reduce concentration risk, and what governance triggers to put in place so you act before service fails.

Executive Summary

  • Frozen pumpkin is harvest-built inventory: most supply is processed and frozen post-harvest to serve year-round demand—risk often shows up first as allocation/lead-time changes, not invoice price.
  • Your real constraint is qualified plants, not farms: freezing-capable plants and approved lines (IQF for dice; cook/pulp/fill + freezing for puree) are the bottleneck.
  • Cold chain is part of the product: temperature control affects texture, drip loss, and claims; cold storage is also a major energy user, making energy a meaningful cost driver in frozen operations [1].
  • Trade hubs can obscure true origin/plant concentration: in Europe, the Netherlands functions as an importer/producer/exporter/transit country for re-export of frozen vegetables—vendor ≠ plant of origin [2].
  • Specs are application-specific: published puree specs show Brix ranges can be broad (example: 5–10 °Brix for a pumpkin puree spec), so procurement should avoid over-tightening specs unless CTQ [3].

Key Insights

(Analyzed at: Mar, 2026)

  • Strategy: Hold
  • Reliability: Medium
  • Potential Saving: 4% ~ 10%
  • Insight: Treat 2026 contracting as a “risk-adjusted hold”: keep your core volumes under contract through your next harvest-to-freeze cycle, but immediately reduce hidden cost and disruption exposure by (1) adding a second qualified plant (not just a second vendor) for at least your top SKU format (puree or dice), and (2) re-baselining specs into CTQ vs. flexible bands—especially solids/Brix for puree and fines/breakage limits for dice. The biggest near-term savings typically come from fewer expedites/quality holds and from negotiating lane + cold-storage terms, not from chasing a lower $/lb headline.

1) What you’re actually buying: the ground truth of the frozen‑pumpkin supply chain

Frozen pumpkin looks like a simple vegetable ingredient, but procurement outcomes are usually determined by three realities:

  1. Harvest-driven intake: raw pumpkin (often winter squash types sold as “pumpkin” in trade) is highly seasonal, so processors freeze inventory post‑harvest to serve year‑round demand.
  2. Processing concentration: farming is fragmented, but freezing-capable plants (IQF lines, puree cook lines, cold stores) are fewer—so a plant outage or compliance issue can remove disproportionate supply.
  3. Cold chain is the product: once frozen, your continuity and quality depend as much on storage, reefer availability, and temperature control as on agriculture.

Frozen‑pumpkin supply chain flow (typical)

A left-to-right flowchart showing the typical frozen-pumpkin supply chain with a clear split into two product paths (IQF dice vs puree), including harvest/intake, wash/sort/trim/seed removal, dice cut+blanch then IQF freezing, puree cook then pulp/sieve and freezing, packaging, cold storage, reefer transport, and customer; with callouts for plant capacity bottleneck, yield loss at trim, energy-intensive freezing/cold storage, temperature excursion risks, and allocation risk appearing as lead-time/MOQ changes.
  1. Upstream / Raw material
  2. Contracted growers deliver pumpkins/squash varieties selected for solids (Brix/dry matter) and color.
  3. Key constraint: field quality variability (rot, dry matter swings, size variability).
  4. Primary processing (trim + conversion)
  5. Wash/sort → peel/trim → seed removal → cut/cook.
  6. Output splits:
  7. Dice/cubes (often blanched prior to freezing; blanching is a common step used in vegetable freezing to protect quality) [4].
  8. Puree (cooked, pulped, sieved; sometimes deaerated)
  9. Secondary processing (freezing + standardization)
  10. IQF freezing for dice/cubes (tunnel/spiral freezer)
  11. Block or slab freezing for puree (or frozen pails/bags)
  12. Standardization to spec (especially puree: Brix/solids, color, particle size)
  13. Packaging & QA
  14. Industrial formats: poly-lined cartons (10–20 kg), bags, pails; retail bags for IQF.
  15. QA focus: foreign material control, micro limits, lot traceability, spec conformance.
  16. Logistics & distribution
  17. Frozen storage at origin + destination.
  18. Reefer truck/container transport; port handling where imported.
  19. Risk: temperature excursions → texture breakdown/drip loss and quality claims.
  20. End markets
  21. Retail frozen veg blends/ready meals, foodservice soups/sides, industrial bakery/fillings.

Decision you’re usually trying to make (even if it’s not stated):

“How do I lock in competitive cost without over‑concentrating on one plant/origin/spec that will break continuity later?”

2) Where cost accumulates (and why margins behave differently by format)

Below is a procurement-oriented cost walk that maps where cost and margin tend to concentrate—and which levers are actually negotiable.

2.1 Upstream / Raw material (farm + intake)

Key insight: In frozen pumpkin, farmgate price matters, but usable yield matters more. A cheap crop with low dry matter or high defect rate can be more expensive after conversion.

What drives cost

  • Contract premiums for varieties with higher solids and consistent color
  • Harvest labor/mechanization and field-to-plant haul
  • Weather-driven defect rates (rot, bruising) → higher trim loss

Where margin shows up

  • Processors may pay growers on a contracted basis but protect their own economics via quality-based acceptance and conversion yields.

2.2 Primary processing (trim/seed removal/cook)

Key insight: This is where hidden cost sits: yield loss at trim and seed removal + energy/water/effluent costs.

What drives cost

  • Sorting labor, water use, effluent treatment
  • Trim loss variability (rind thickness, defects)
  • Cooking energy for puree

Procurement implication

  • Two suppliers can quote the same $/lb but behave differently under stress: one may protect margin by tightening defect tolerances or pushing spec exceptions downstream.

2.3 Secondary processing (freezing + cold storage)

Key insight: Freezing economics are dominated by energy intensity and capacity utilization. When plants are full, they allocate capacity to the “best customers.”

What drives cost

  • Freezer energy load + refrigeration systems
  • Maintenance and downtime risk
  • Cold storage fees and working capital (inventory carried for months)

Useful external reference (validated/updated framing)

  • Cold storage facilities are widely described as major power users, and published industry commentary provides an example benchmark for electricity intensity (kWh per square foot per year) [1].
  • Industry energy guidance commonly notes refrigeration is a dominant portion of a cold storage facility’s electricity bill (often cited in the ~70–80% range), reinforcing why energy clauses can matter in negotiations [5].

2.4 Packaging & QA

Key insight: For frozen pumpkin, packaging is not “just packaging.” It is line compatibility + traceability + complaint risk control.

What drives cost

  • Poly liner quality, carton strength, pallet pattern
  • Metal detection/X-ray, micro testing, retained samples
  • Customer-specific labeling and lot coding requirements

2.5 Logistics & distribution (cold chain)

Key insight: Landed cost volatility often comes from reefer + cold storage more than from the pumpkin itself—especially for imported supply.

What drives cost

  • Reefer container/truck rates, port/terminal handling
  • Frozen demurrage/detention exposure (temperature-controlled dwell time)
  • Destination cold storage capacity constraints

2.6 End-market margin stack

Key insight: Frozen pumpkin is often an ingredient inside a higher-margin SKU (soups, bakery, ready meals). That means procurement pressure typically focuses on cost, while operations/QA pressure focuses on continuity and spec.

Product-level cost breakdown (illustrative ratios)

A three-bar 100% stacked bar chart comparing delivered cost composition for frozen pumpkin puree, IQF pumpkin dice/cubes, and aseptic pumpkin puree, with segments for raw material, primary processing, secondary processing, packaging & QA, logistics & distribution, and supplier/channel margin labeled with the article’s illustrative percentage ratios and a note that ratios vary by origin, energy, pack, and lane.

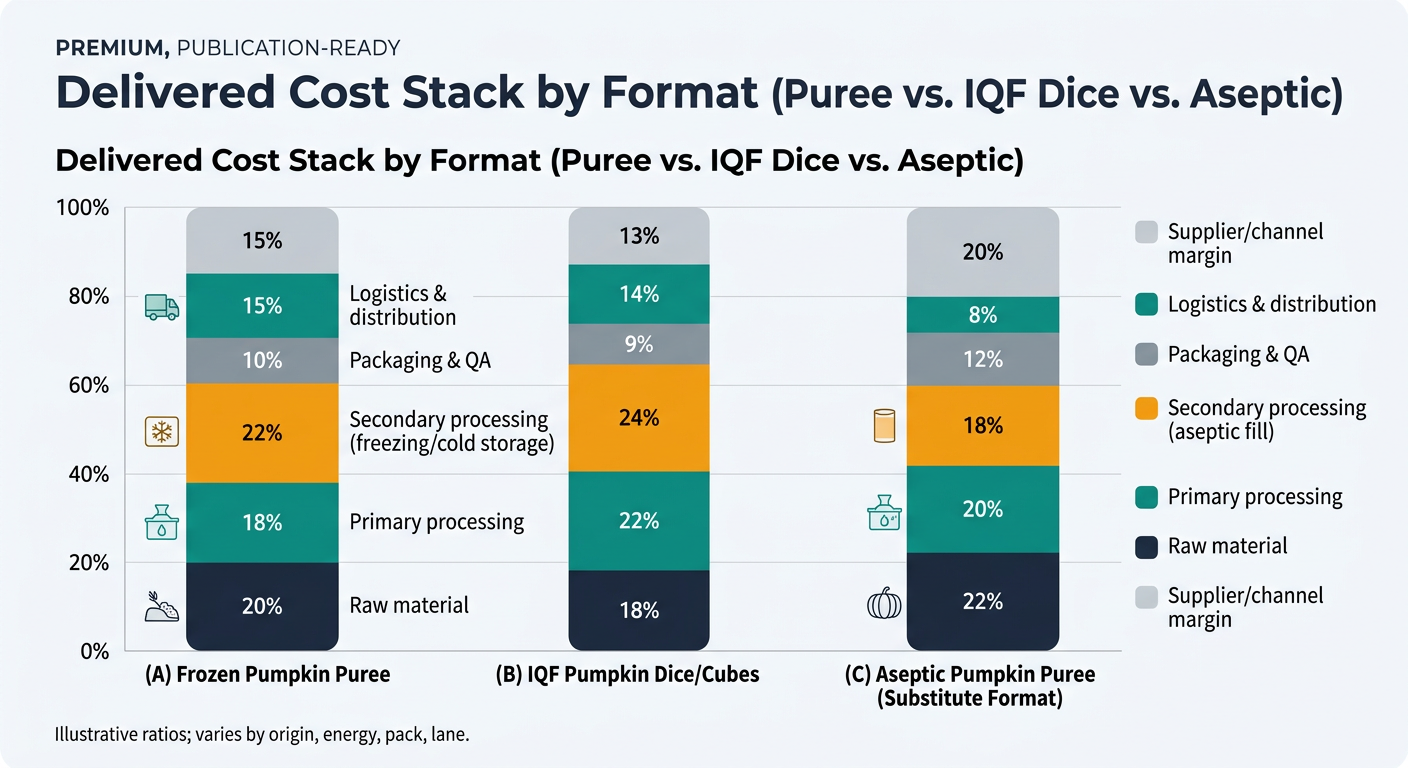
Modeled to show where cost concentrates by product form; actual ratios vary by origin, contract terms, energy costs, pack format, and lane.

A) Frozen pumpkin puree (industrial cartons/bags)

Supply chain node Cost ratio (% of delivered cost) What to watch as a buyer
Raw material (pumpkin) 20% Solids/dry matter variability changes conversion value
Primary processing 18% Yield loss at trim/seed removal; cooking energy
Secondary processing (freezing + cold storage at origin) 22% Allocation risk when freezer capacity tight
Packaging & QA 10% Lot integrity, foreign material controls
Logistics & distribution 15% Reefer + cold storage + dwell time
Supplier + channel margin 15% Margin expands in shortage periods

B) IQF pumpkin dice/cubes (foodservice/ingredient)

Supply chain node Cost ratio (% of delivered cost) What to watch as a buyer
Raw material (pumpkin) 18% Size/firmness affects dice yield and breakage
Primary processing 22% Cutting losses, blanching losses, labor
Secondary processing (IQF + cold storage) 24% IQF throughput constraints + energy
Packaging & QA 9% Screen size, defect tolerances, foreign material
Logistics & distribution 14% Lane volatility and temperature control
Supplier + channel margin 13% Premium for tight spec + consistent cut

C) Aseptic pumpkin puree (substitute format, not frozen)

Supply chain node Cost ratio (% of delivered cost) What to watch as a buyer
Raw material (pumpkin) 22% Solids variability still matters
Primary processing 20% Cook/pulp/sieve costs
Secondary processing (aseptic processing/fill) 18% Sterilization + aseptic packaging line constraints
Packaging & QA 12% Aseptic packaging material + sterility assurance
Logistics & distribution 8% No frozen chain; different warehousing
Supplier + channel margin 20% Value add for shelf-stable continuity

Note on specs (validated): Published supplier specs for pumpkin puree show Brix ranges that can vary widely by product and application (e.g., one pumpkin puree spec lists Brix 5–10) [3]. This is why procurement should treat “Brix” as an application-specific requirement, not a universal number.

3) Structural facts that quietly control your negotiating power

  1. “Pumpkin” is not always the orange carving pumpkin. Industrial “pumpkin” supply often uses squash types selected for solids and consistency; this affects sensory profile and spec comparability across suppliers.
  2. Europe’s frozen-vegetable trade is a hub system. The Netherlands is not only an importer but also a producer, exporter and transit country for the re-export of frozen vegetables, which can obscure true origin and plant concentration if you only look at the immediate vendor [2].
  3. Canned vs frozen are different risk pools. In the U.S., canned pumpkin production is highly concentrated around Morton, Illinois (Libby’s/Nestlé Professional references Morton, IL as its farming/packing base), which is a useful analogy for how processed-veg capacity can bottleneck [6].

Procurement takeaway: Your leverage is less about “how many farms exist” and more about how many qualified plants can hit your spec, pack, audit, and lead-time requirements.

4) The critical insight: why your price and your supply risk can diverge

Frozen pumpkin is a category where price signals lag risk signals.

  • A crop shock (quality/rot/dry matter) may not show up in your invoice immediately if suppliers are shipping from frozen inventory.
  • But the risk (allocation, longer lead times, spec drift, MOQ increases) can show up quickly—especially late season when inventory is being rationed.

What this looks like in practice

  • Puree: Supplier holds price but starts pushing lots that are “technically within spec” yet trend lower in solids/color → downstream you pay in rework, longer cookdown, or formulation adjustments.
  • IQF dice: Supplier holds price but increases breakage/fines or relaxes cut integrity—your line sees higher loss.

So the true cost is:

Invoice price + yield loss + quality holds + cold-chain claims + expedite freight.

5) Where procurement teams typically misstep (and how it shows up later)

  1. Treating frozen pumpkin like a generic frozen vegetable line item
  2. Miss: harvest + freezing inventory cycle and allocation behavior.
  3. Over-indexing on last price paid and ignoring conversion economics
  4. Miss: solids/yield variability. A “cheaper” puree can be more expensive in use.
  5. Single-sourcing because “QA approval is hard”
  6. Miss: the switching lead time is exactly why you need a bench before disruption.
  7. Specs that are tighter than the application requires
  8. Miss: you shrink the feasible supplier pool, increasing concentration risk.
  9. No explicit triggers
  10. Miss: teams wait for a crisis, then pay a disruption premium.

6) What an intelligence-driven process changes (not “more data,” better decisions)

The goal is to convert scattered signals into repeatable governance: when to rebid, when to dual-source, when to lock, when to flex spec.

Decision-relevant intelligence (frozen‑pumpkin-specific)

  • Supplier capability reality
  • Format capability (puree vs dice), freezing method, pack formats, MOQ behavior
  • Certifications/audit cadence and “audit readiness” signals
  • Capacity + allocation signals
  • Plant utilization proxies, lead-time distributions (not averages), seasonal shutdown patterns
  • Spec compliance trend signals
  • Lot-to-lot drift (Brix/solids, color), complaint frequency, corrective action patterns
  • Cold-chain risk signals
  • Lane reliability, reefer availability constraints, cold storage bottleneck indicators

How it changes the workflow for procurement leadership

  • From: annual bid + reactive expediting
  • To: portfolio strategy with thresholds
  • Example governance triggers:
  • If lead time P90 increases > X weeks, activate backup supplier validation
  • If spec drift shows 3 consecutive lots trending toward lower solids, tighten incoming QA sampling and open a corrective action track
  • If origin/plant concentration > Y% of volume, require a second qualified plant

Boundaries (important): intelligence supports decisions; it does not replace QA validation, plant audits, or legal review.

7) Strategic use cases procurement leaders can run in 60–90 days

Use case A: Build a credible backup bench (without inflating total cost)

What you do

  1. Define “switchable spec” bands (core vs flexible attributes)
  2. Longlist alternates by format + pack + audit profile
  3. Pre-negotiate contingency terms (MOQ, lead time, packaging)

Trade-off

  • Slightly higher qualification workload and sometimes a small unit-cost premium
  • In exchange for lower disruption premium and faster switching

KPIs

  • Time-to-switch (weeks)
  • % volume with at least 2 qualified plants
  • Emergency buys/expedites as % of spend

Use case B: Reduce cost volatility without raising stockout risk

What you do

  • Split buys into: contracted base + indexed component + contingency volume
  • Tie renegotiation clauses to observable drivers (energy/cold storage/freight)

KPIs

  • Price variance vs benchmark
  • OTIF and fill rate during peak season

Use case C: Spec governance that expands supply options safely

What you do

  • Identify which specs are truly CTQ (critical-to-quality)
  • Create tiered acceptance bands (e.g., “A spec” vs “B spec” for non-critical attributes)

KPIs

  • # of qualified suppliers per spec tier
  • Quality holds and complaint rate

8) Why this matters beyond frozen pumpkin (categories you likely also buy)

Frozen pumpkin is a clean example of a broader procurement pattern: processed-food inputs where capacity + cold chain create hidden constraints.

Comparable categories where intelligence-driven sourcing tends to outperform:

  • IQF berries (strawberry/blueberry/raspberry): high cold-chain dependence; quality drift and claims risk; strong seasonality.
  • Frozen cauliflower/broccoli: tight harvest-to-freeze windows; plant throughput and blanching/freezing capacity constraints.
  • Aseptic fruit purees (mango, passion fruit): spec standardization (Brix/acidity), sterility assurance, and supplier qualification lead time.
  • Frozen spinach: contamination/foreign material governance and recall exposure; supplier concentration risk.

In all of these, the “best price” supplier is not always the “lowest total cost” supplier once you include yield, quality incidents, and logistics reliability.

9) Why frozen pumpkin is a powerful case study for procurement governance

Frozen pumpkin forces clarity on the questions procurement leadership should be able to answer at any time:

  • Concentration: What % of volume is tied to a single plant/origin?
  • Switchability: How long does it take to qualify and ramp an alternate (realistically)?
  • Spec flexibility: Which attributes are CTQ vs preference—and how many suppliers does each spec choice eliminate?
  • True cost: What is the all-in cost of variability (rework, yield loss, holds, expediting), not just $/lb?
  • Triggers: What leading indicators cause us to act before service fails?

When teams can answer those with evidence, frozen pumpkin stops being a seasonal firefight and becomes a managed category with measurable resilience.

Tridge Eye Data Intelligence Solution

Make Faster, Data-Driven Sourcing Decisions

The insights in this report are just the starting point. Tridge Eye is the data intelligence solution that gives procurement and sourcing leaders real-time market signals, price benchmarks, and supply risk alerts — so you can act before the market moves.

Explore Tridge Eye →

References

  1. naiop.org
  2. cbi.eu
  3. yamco.net (PDF)
  4. ohioline.osu.edu
  5. securesolarfutures.com (PDF)
  6. nestleprofessional.us
Subscribe
By subscribing you agree to with our Privacy Policy and provide consent to receive updates from our company.
Thank you! Your submission has been received!
Oops! Something went wrong while submitting the form.
Subscribe to receive the latest blog posts, updates, promotions, and announcements from Tridge.