INDUSTRY TRENDS

Frozen Potato Sourcing Intelligence That Actually Changes Procurement Decisions (Cost, Allocation, and Cold-Chain Reality)

Author
Team Tridge
DATE
March 18, 2026
10 min read
frozen-potato Cover
Tridge Eye Data Intelligence Solution

This report is powered by Tridge Eye Data Intelligence.

Every data point, price signal, and supply risk insight in this analysis comes from the same platform that procurement and sourcing leaders worldwide rely on daily. As you read, consider what this level of market intelligence could do for your sourcing decisions.

Explore Tridge Eye →

Frozen potato sourcing looks like a simple “commodity buy” until you try to switch suppliers mid-quarter and discover your real constraints: contracted acreage, processing capacity allocation, packaging/artwork lead times, and cold-chain lane reliability. This guide translates frozen-potato supply chain realities into procurement actions—how to benchmark suppliers on cost-to-serve, design volatility-aligned contracts, pre-qualify switch-ready alternates, and govern performance with trigger-based escalation.

Executive Summary

  • Category reality: Frozen potato behaves like contracted agriculture + high-capex processing + cold chain, so supply is often allocated, not “available on demand.”
  • Switching friction: Specs (cut, fry color, coating, pack format) and packaging/artwork lead times routinely turn “backup suppliers” into non-usable options in a disruption.
  • Cost stack (not just raw potato): Delivered cost is materially influenced by processing energy, edible oil, packaging, and reefer logistics—even when farmgate potato prices look stable.
  • Storage quality is supply: Cold storage can push reducing sugars up (cold-induced sweetening), driving darker fry color and shrinking usable fry-grade supply. [1]
  • Capacity can change quickly: Processor network decisions (curtailments/closures) can reset negotiating leverage and lead times; e.g., Lamb Weston’s FY25 restructuring plan included permanent closure of Connell, WA and production curtailments (announced Oct 1, 2024). [2]
  • Global trade concentration: Belgium and the Netherlands are repeatedly cited as a dominant frozen processed potato export cluster (commonly referenced around ~50% of global exports in industry materials), increasing correlated risk. [3]

Key Insights

(Analyzed at: Mar, 2026)

  • Strategy: Hold
  • Reliability: Medium
  • Potential Saving: 3% ~ 8%
  • Insight: For most North American buyers in Mar 2026, the best near-term value is less about “timing the market” and more about capturing avoidable cost-to-serve leakage: renegotiate freight/service terms using lane-level OTIF/claims evidence, tighten allocation language, and pre-approve at least one alternate spec/pack pathway for your top 20% volume SKUs. This typically yields mid-single-digit savings (or avoided cost) without taking the supply-continuity risk of aggressive re-sourcing during capacity-constrained periods.

1) What You’re Really Buying: The Frozen-Potato Supply Chain (Ground Truth)

Frozen potato looks like a “simple” commodity until you try to switch suppliers mid-quarter.

The category behaves like a contracted-agriculture + high-capex manufacturing + cold-chain logistics business. That combination creates three procurement realities:

A value chain flowchart showing frozen potato from growers/contracted acreage through storage (sugar management/fry color), processing (wash/peel/cut → blanch → par-fry → freeze), packaging & QA, cold storage & distribution, reefer transport, and end markets (QSR/foodservice, retail private label, industrial), with callouts for allocation, spec tightness, packaging lead times, and cold-chain lane reliability.
  • Supply is planned, not found. Processors lock in contracted acreage and storage plans months ahead. When the market tightens, you don’t “buy more,” you negotiate allocation.
  • Specs are a hidden single-source lever. Cut accuracy, fry color, solids, coating, seasoning, oil constraints, and pack formats can quietly reduce your qualified pool from “many” to “two.”
  • Cold chain converts small disruptions into service failures. A missed reefer appointment or cold-store bottleneck becomes OTIF misses, temperature excursions, claims, and customer penalties.

Frozen-potato value chain flow (typical)

  1. Growers / contracted acreage (processing varieties; agronomy + yield/quality risk)
  2. Storage (months-long; sugar management and fry color stability are critical)
  3. Processing (wash/peel/cut → blanch → par-fry (often) → freeze)
  4. Packaging & QA (case configs, retail artwork, metal detection, defect control)
  5. Cold storage & distribution (frozen inventory holding cost is non-trivial)
  6. Reefer transport (domestic lanes or ocean reefer; equipment and port risk)
  7. End markets (QSR/foodservice, retail private label, industrial)

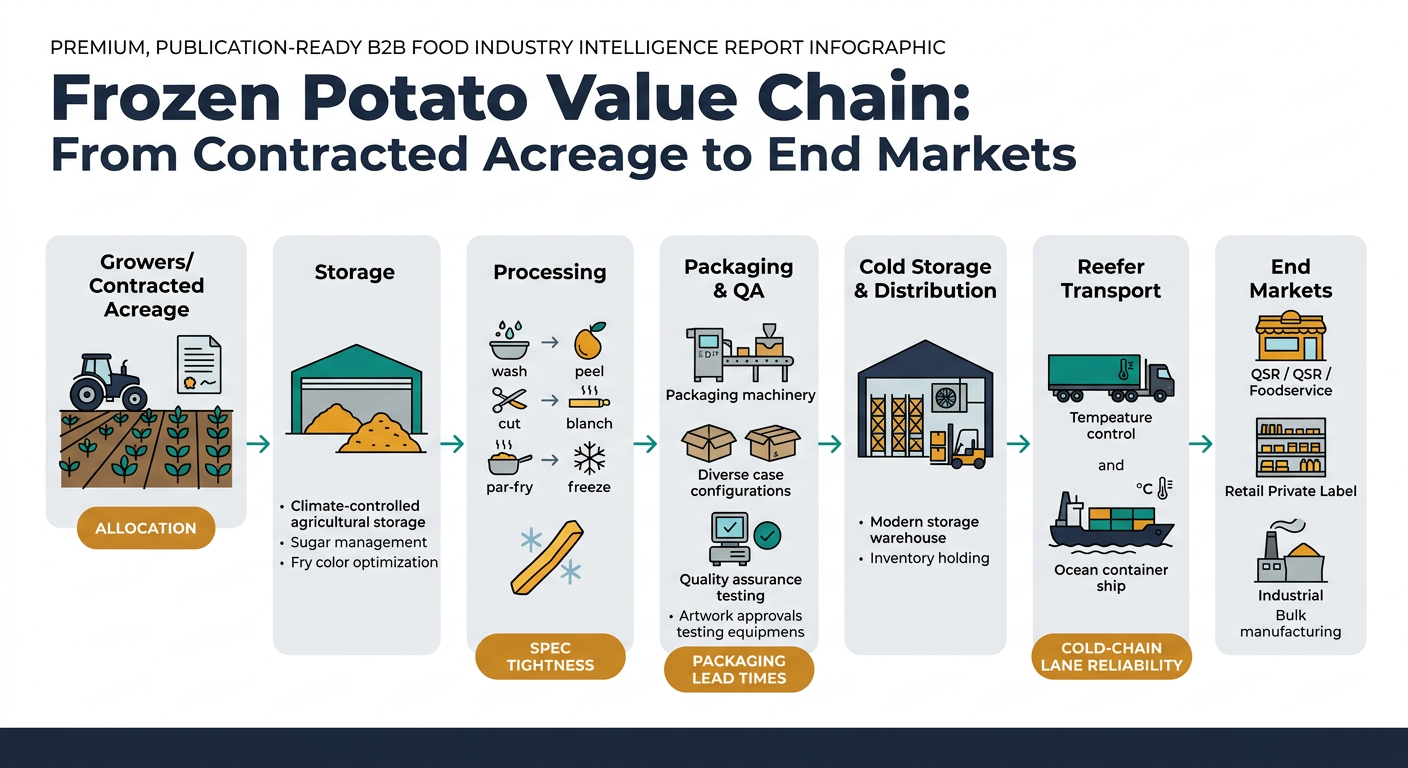
Key frozen-potato nuance non-experts miss: even if raw potato tonnage is “fine,” storage quality can degrade (e.g., cold-induced sweetening → higher reducing sugars → darker fry color), shrinking usable supply for fry-grade output and tightening certain SKUs. [1]

2) Where the Money Actually Goes: Cost & Margin by Node (and Why It Moves)

Key insight: Frozen potato is not raw-potato-cost-driven alone. The delivered cost is a layered stack where conversion energy, edible oil exposure, packaging, and cold-chain logistics can swing the outcome even when farmgate prices are stable.

Below is a procurement-oriented walkthrough of cost build-up by node—what drives it, what signals matter, and what tends to surprise teams.

2.1 Upstream: Contracted Potatoes (Grower + Field Economics)

What happens here

  • Processors contract acreage and varieties designed for fries (high solids/dry matter; size profile).
  • Yield and quality risk are dominated by weather, disease pressure, irrigation constraints, and harvest conditions.

Cost drivers procurement should care about

  • Yield & size distribution: small tubers increase peel/trim loss and reduce fry-length yield.
  • Input inflation: seed, fertilizer, crop protection, land rent, irrigation energy.
  • Contract structure: fixed per-ton vs. formulas; bonuses/penalties for solids/defects.

Signals that matter

  • Regional crop condition shifts (heat/drought, excess rain at harvest).
  • Acreage changes and processor contracting behavior.

2.2 Storage: The “Invisible Factory” That Can Tighten Supply

What happens here

  • Potatoes sit in controlled storage for months to feed plants year-round.
  • Storage is not just holding inventory; it’s managing sugars and fry color.

Cost drivers

  • Shrink and rot losses (especially after wet harvests).
  • Energy & ventilation control (temperature/humidity/CO₂ management).
  • Quality drift risk: cold-induced sweetening increases reducing sugars, driving darker fry color and higher defect rates (a well-documented phenomenon in potato storage and frying-quality literature). [1]

Signals that matter

  • Energy price shocks (storage + cold chain).
  • Quality complaints trending up (color, bitter notes, excessive browning).

2.3 Processing: Where Capacity and Allocation Are Made

What happens here

  • High-throughput plants convert bulky raw potatoes into exportable frozen product.
  • Typical steps: wash/peel/cut → blanch → par-fry (often) → IQF/tunnel freezing.

Cost drivers

  • Energy intensity: blanching, frying, freezing.
  • Edible oil exposure: par-fry oil is a major variable cost for many SKUs.
  • Line efficiency: downtime, changeovers, yield losses from peel/trim.
  • Capacity constraints: when plants are full, buyers feel it as allocation and longer lead times.

Market reality example (capacity action): Lamb Weston’s FY25 restructuring plan (announced Oct 1, 2024) included permanent closure of its Connell, Washington facility and temporary curtailments across its North American network—an example of how processor network decisions can quickly change supply availability and negotiating leverage. [2]

2.4 Packaging & QA: The Spec and Artwork Trap

What happens here

  • Foodservice: polybags in cartons, case counts, pallet patterns.
  • Retail/private label: film specs, print lead times, artwork approvals.

Cost drivers

  • Cartons, film, liners, pallet wrap.
  • QA intensity: defect tolerances, metal detection, microbiological programs, customer audits.

Procurement pitfall

Teams negotiate price but ignore that packaging changeovers + artwork lead times can make “switching suppliers” a 8–16 week process in practice.

2.5 Cold Storage & Distribution: Working Capital with a Utility Bill

What happens here

  • Frozen inventory sits in cold stores and DCs; holding costs are real.

Cost drivers

  • Cold-store rates (highly sensitive to electricity and capacity).
  • Inventory days (forecast error becomes cash + space).

2.6 Reefer Transport (Domestic + Ocean): The Reliability Multiplier

What happens here

  • Frozen potato requires continuous temperature control, making lane reliability and equipment availability core to service.

Cost drivers

  • Reefer trucking/rail, ocean reefer freight, port handling.
  • Temperature monitoring and claims.

Signals that matter

  • Port congestion, reefer equipment tightness, lane lead-time drift.

Product-level cost breakdown (illustrative, procurement-friendly model)

These ratios are modeled to show where cost concentrates by product form. Actual splits vary by region, contract terms, energy/oil cycles, pack formats, and customer service requirements.
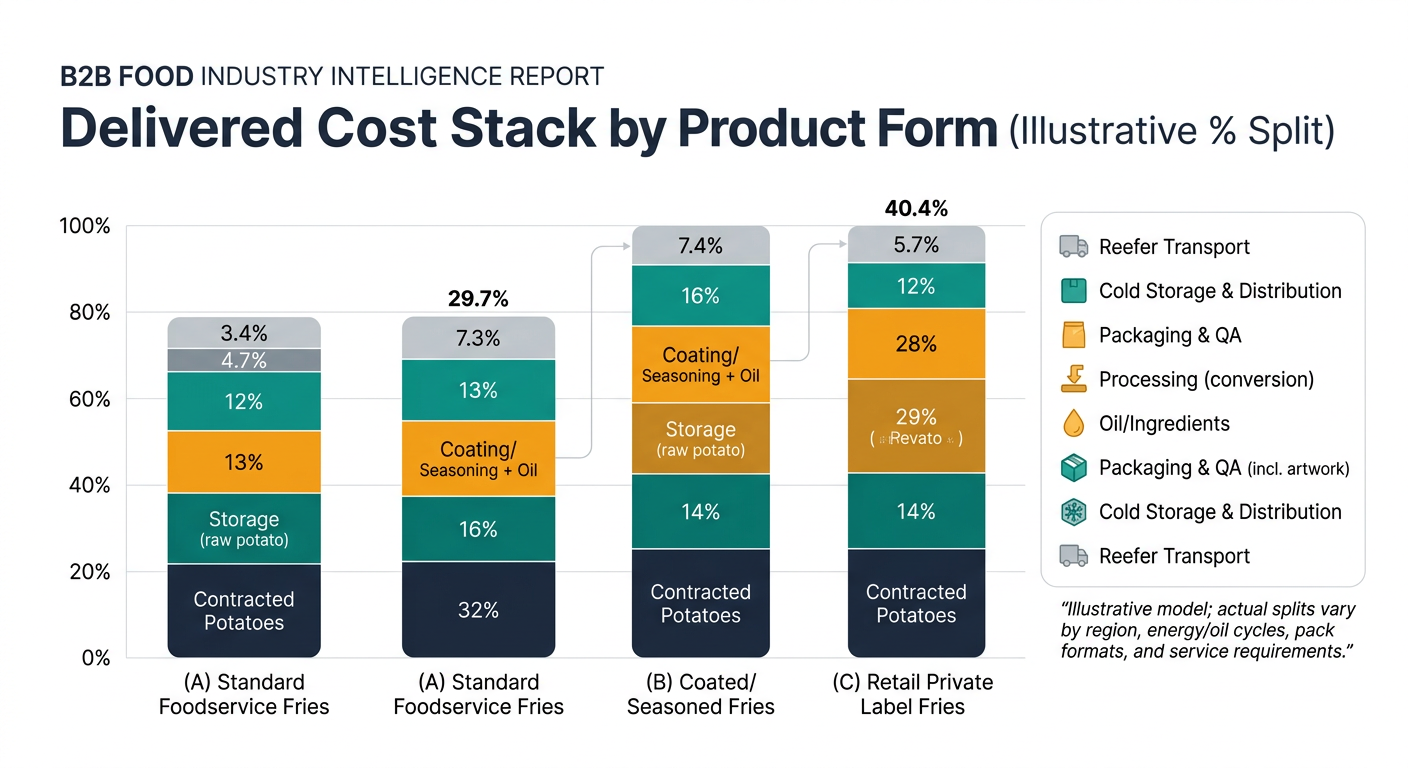
A stacked bar chart showing illustrative delivered cost percentage splits for (A) Standard Foodservice Fries, (B) Coated/Seasoned Fries, and (C) Retail Private Label Fries, divided into seven labeled segments matching the tables: Contracted Potatoes (raw), Storage (raw potato), Processing (conversion), Oil/Ingredients (or Coating/Seasoning + Oil for B), Packaging & QA (incl. artwork for C), Cold Storage & Distribution, and Reefer Transport, with a legend and note that actual splits vary by region, energy/oil cycles, pack formats, and service requirements.

A) Standard Foodservice Fries (e.g., 3/8" straight cut, uncoated)

Supply Chain Node Cost Ratio (% of delivered cost) What drives variance
Contracted potatoes (raw) 25% crop size/quality, contract terms
Storage (raw potato) 6% shrink, energy, quality drift
Processing (conversion) 30% energy, labor, yield, throughput
Oil / ingredients 7% oil price and usage rate
Packaging & QA 8% cartons/film, QA intensity
Cold storage & distribution 10% electricity, capacity, dwell
Reefer transport 14% lane rates, equipment, accessorials

B) Coated/Seasoned Fries (higher value-add, more inputs)

Supply Chain Node Cost Ratio (% of delivered cost) What drives variance
Contracted potatoes (raw) 20% crop size/quality
Storage (raw potato) 5% shrink, energy
Processing (conversion) 28% line efficiency, changeovers
Coating/seasoning + oil 15% ingredient inflation, formulation
Packaging & QA 9% tighter QA, labeling
Cold storage & distribution 10% dwell, electricity
Reefer transport 13% lane volatility

C) Retail Private Label Fries (artwork + service complexity)

Supply Chain Node Cost Ratio (% of delivered cost) What drives variance
Contracted potatoes (raw) 22% crop and contract
Storage (raw potato) 5% energy, shrink
Processing (conversion) 27% throughput, downtime
Oil / ingredients 8% oil cycle
Packaging & QA (incl. artwork) 12% film, print lead times, compliance
Cold storage & distribution 11% inventory days, DC fees
Reefer transport 15% retail delivery constraints

3) Structural Facts That Drive Negotiating Power (Even When Prices Look Calm)

Structural fact #1: Export supply is geographically concentrated. Belgium and the Netherlands are repeatedly cited as a dominant export cluster for frozen processed potato products; industry materials referencing Rabobank-style framing commonly place them at roughly ~50% of global frozen processed potato exports. [3]

Why procurement should care

  • Concentration increases correlated risk: weather, energy regulation, or logistics issues in one cluster ripple globally.

Structural fact #2: In the U.S., processing is the majority use, and frozen is the largest processing outlet. USDA reporting and synthesis literature show >60% of the U.S. crop typically goes to processing, and within processing, frozen fries/other frozen products are the largest share (one 2023 synthesis cites ~62% of processing allocated to frozen). [4]

Why it matters

  • When processing potatoes tighten, frozen categories are the first place you feel it (allocation, longer lead times, spec enforcement).

4) The Critical Insight: Why Raw Potato Conditions Don’t Translate Linearly to Your Delivered Price

Procurement teams often expect a simple relationship:

  • “Potato crop up → fries price down”

In practice, the relationship breaks because the delivered cost is dominated by conversion + cold chain + spec-driven yield.

The three most common “disconnect mechanisms”

  1. Quality-adjusted yield swings
  2. A crop can be large but not fry-grade (size distribution, defects, sugar levels). That reduces effective output.
  3. Energy and cold-chain costs can offset raw relief
  4. Even if raw contracts soften, a spike in electricity/gas can raise conversion and cold-storage costs.
  5. Capacity decisions create price floors
  6. When a processor curtails lines or closes capacity, the market may stay tight even if farm conditions improve (capacity is slower to rebuild than acreage).

Procurement takeaway: You need to separate:

  • Market-wide drivers (regional crop quality, energy, freight)
  • vs.
  • Supplier-specific execution (line efficiency, claims, OTIF, site disruptions)

5) Where Procurement Teams Typically Misread Frozen Potato (and Pay for It)

  1. Treating it like a simple annual bid category
  2. Annual RFQs ignore in-year volatility from energy/freight and the reality of allocation.
  3. Underestimating spec tightness as a cost lever
  4. Tight fry color/defect tolerances and narrow cut specs reduce supplier optionality and raise risk premiums.
  5. Confusing “backup supplier on paper” with switch-ready supply
  6. Without QA trials, pack approvals, and lane validation, the backup is not operational.
  7. Negotiating unit price instead of landed cost-to-serve
  8. Claims, temperature excursions, expedited freight, and chronic shorts can erase “savings.”
  9. No trigger-based governance
  10. Teams react late because they don’t tie signals (crop, energy, plant events, lane reliability) to predefined actions.

6) What Changes When You Run Frozen-Potato Procurement Like an Intelligence Problem

This isn’t about “more data.” It’s about linking signals to decisions with an audit trail.

Decision shift #1: From supplier price to supplier cost-to-serve

  • Signals to watch: lane lead-time drift, claims rate, chronic shorts, temperature excursions, energy/freight indices.
  • Capability used: supplier benchmarking (cost, service, capability)
  • Action: negotiate on the full equation (price + freight + service penalties), not the invoice line.
  • Trade-off: requires cross-functional alignment (ops/QA/logistics) and clean performance data.

Decision shift #2: From “dual-source intent” to “dual-source readiness”

  • Signals to watch: site concentration risk, capacity curtailments, regional weather stress.
  • Capability used: alternative supplier identification under disruption + qualification support
  • Action: pre-qualify alternates by SKU/spec, run trials, validate packaging lead times, and lock a small “keep-warm” volume.
  • Trade-off: you may pay a resilience premium (smaller volumes, slightly higher price) to avoid emergency buys.

Decision shift #3: From static contracts to volatility-aligned contracts

  • Signals to watch: structural volatility in energy/oil/freight vs. stable raw contracts.
  • Capability used: price intelligence & trend monitoring
  • Action: choose fixed vs. indexed vs. reopeners by cost driver (e.g., energy/freight pass-through with guardrails).
  • Trade-off: indexing reduces surprises but can reduce your ability to “lock in” during favorable periods.

Decision shift #4: From anecdotal QBRs to threshold-based governance

  • Signals to watch: OTIF by lane, defect/claim trends by SKU, recurring holds.
  • Capability used: procurement performance & governance analytics
  • Action: trigger CAPA, probation, or volume reallocation based on thresholds.
  • Trade-off: suppliers may push back unless metrics are transparent and jointly defined.

7) Strategic Use Cases (Practical Plays Procurement Can Run)

Use Case A: Stabilize cost without increasing stockout risk

  • Decision context: high-volume core fries for foodservice (service level critical)
  • Signals: crop quality + energy + reefer lane capacity
  • Action: split volume across 2 suppliers, use indexed mechanisms for energy/freight with caps, and hold a defined buffer inventory for peak periods
  • Measurable outcome: reduced landed-cost variance; fewer expedites; improved fill rate

Use Case B: Build a switch-ready contingency map for critical SKUs

  • Decision context: coated/seasoned SKUs with tight specs and limited suppliers
  • Signals: plant outages/curtailments, packaging lead-time risk, claims trend
  • Action: spec-relaxation scenarios (ops/QA-approved), pre-trial alternates, pre-approve pack formats
  • Measurable outcome: faster time-to-switch; reduced emergency premium spend

Use Case C: Turn service failures into negotiation leverage (without burning the relationship)

  • Decision context: incumbents missing OTIF or driving high claims
  • Signals: lane-level OTIF, chronic shorts, temperature excursions
  • Action: quantify cost of failures; renegotiate service credits, priority allocation, or lane changes; reallocate volume if thresholds persist
  • Measurable outcome: fewer repeat issues; auditable rationale for supplier actions

Use Case D: Private label expansion without quietly eroding resilience

  • Decision context: retail growth adds SKUs/pack sizes/artwork
  • Signals: changeover constraints, packaging dependency, capacity utilization
  • Action: standardize pack formats where possible; dual-source top SKUs; rationalize long-tail SKUs
  • Measurable outcome: higher fill rates during promotions; lower complexity-driven costs

8) Why This Intelligence Approach Transfers to Other Categories You Likely Manage

Frozen potato is a clean example of a broader procurement pattern: the biggest risks sit in the “in-between” layers (conversion constraints, logistics, and spec-driven optionality), not just raw input price.

Examples procurement leaders commonly own alongside frozen potato:

  • Frozen vegetables: similar cold-chain dependence and packaging/artwork constraints; weather-driven supply variability.
  • Edible oils (canola/soy/sunflower): price volatility can dominate conversion economics for fried/par-fried categories.
  • Corrugate/cartons and flexible packaging: often treated as indirect, but can become a bottleneck that blocks supplier switching.
  • Reefer logistics as a service buy: lane capacity and accessorials can swing landed cost and service more than supplier unit price.

The transferable lesson: intelligence is most valuable when it ties signals to actions (contract structure, dual-source readiness, spec governance, inventory policy) and creates an auditable decision record.

9) Why Frozen Potato Is a High-Impact Proof Point for Procurement Intelligence

Frozen potato procurement forces discipline because the category punishes “price-only” thinking quickly.

It’s powerful as an example because:

  • Specs are measurable (color, solids, cut tolerances, coating performance), so you can explicitly model trade-offs.
  • Disruptions are operationally obvious (allocation, OTIF misses, claims), making governance metrics meaningful.
  • The supply base is concentrated (export clusters and processor networks), so risk mapping is not optional.
  • Switching costs are real (QA approvals, packaging, lanes), so readiness beats intent.

If you can operationalize intelligence here—benchmarking cost-to-serve, building switch-ready alternates, and running trigger-based governance—you typically can replicate the operating model across other volatile, spec-driven, logistics-sensitive categories.

Tridge Eye Data Intelligence Solution

Make Faster, Data-Driven Sourcing Decisions

The insights in this report are just the starting point. Tridge Eye is the data intelligence solution that gives procurement and sourcing leaders real-time market signals, price benchmarks, and supply risk alerts — so you can act before the market moves.

Explore Tridge Eye →

References

  1. link.springer.com
  2. sec.gov
  3. potatocongress.org
  4. esmis.nal.usda.gov
Subscribe
By subscribing you agree to with our Privacy Policy and provide consent to receive updates from our company.
Thank you! Your submission has been received!
Oops! Something went wrong while submitting the form.
Subscribe to receive the latest blog posts, updates, promotions, and announcements from Tridge.