Frozen plantain looks like a simple frozen commodity, but procurement outcomes are usually decided by three physical realities: how fast mature-green fruit reaches a processor, how much usable yield survives peeling/cutting, and whether the product’s temperature history stays stable through ports and 3PLs. This map explains where cost and risk get “locked in,” and what to govern in sourcing and contracting.
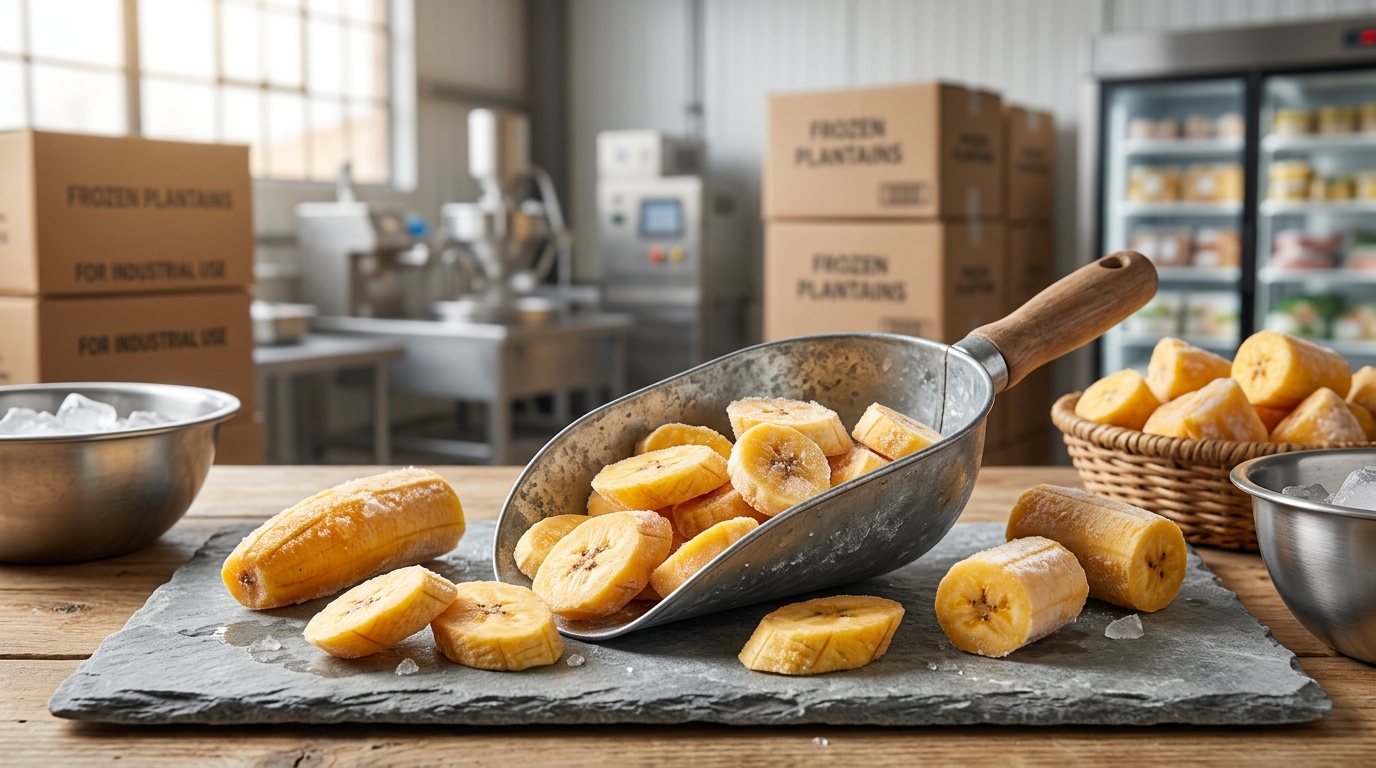
Frozen plantain is built around one non-negotiable reality: you’re converting a bruising-prone, fast-aging tropical crop into a frozen format that only holds value if the cold chain stays intact end-to-end. Most cost is “locked in” early (raw fruit quality + yield) and then amplified by labor-intensive prep, energy-intensive freezing, and cold logistics.
Physical flow (simplified):
Farm harvest (mature-green) → collection/packing → factory receiving & grading → peel/cut (high labor) → anti-browning / blanch or par-fry (SKU-dependent) → IQF or block freezing → glazing/pack → frozen storage → reefer export → import cold store → DC/foodservice/retail freezer.

Insight: Frozen plantain landed cost is structurally dominated by (1) yield loss from raw fruit defects and trimming, (2) labor for peeling/cutting/sorting, (3) energy + throughput at freezing, and (4) cold-chain logistics and inventory carrying in frozen storage.

| Supply Chain Node | Cost Ratio (% of Final Cost) | Notes |
|---|---|---|
| Raw Material (fresh plantain) | 22% | Highly sensitive to defects/size uniformity (yield). |
| Primary Processing (peel/cut/sort) | 24% | Labor + trim loss; biggest driver of unit-to-unit consistency. |
| Secondary Processing (blanch + freezing) | 16% | Energy + water; freezing throughput and cold-store load. |
| Packaging & QA | 10% | Film barrier + seals; metal detection and rework cost. |
| Cold Storage + Reefer + Inland Frozen Distribution | 18% | Reefer ocean freight + port dwell + frozen warehousing. |
| Importer/Distributor Margin | 10% | Handling, working capital, shrink. |
| Supply Chain Node | Cost Ratio (% of Final Cost) | Notes |
|---|---|---|
| Raw Material (fresh plantain) | 18% | Mature-green uniformity matters for frying performance. |
| Primary Processing (peel/cut/form) | 22% | Added forming step; breakage control becomes critical. |
| Secondary Processing (par-fry + freezing) | 24% | Oil + energy + filtration losses; oxidation control. |
| Packaging & QA | 10% | Grease migration + seal integrity; label accuracy (allergens/shared lines). |
| Cold Storage + Reefer + Inland Frozen Distribution | 16% | Similar cold-chain cost base; higher claim risk if temperature cycles. |
| Importer/Distributor Margin | 10% | Working capital and shrink. |
| Supply Chain Node | Cost Ratio (% of Final Cost) | Notes |
|---|---|---|
| Raw Material (ripened plantain input) | 20% | Ripeness management increases sorting losses and handling sensitivity. |
| Primary Processing (peel/cut/sort) | 20% | Softer fruit increases breakage and fines. |
| Secondary Processing (par-fry + freezing) | 26% | Oil uptake control is a core quality/cost variable. |
| Packaging & QA | 10% | Stickiness + clumping risk; pack-out integrity matters. |
| Cold Storage + Reefer + Inland Frozen Distribution | 14% | Slightly less weight on logistics in ratio terms, not in absolute dollars. |
| Importer/Distributor Margin | 10% | Handling + shrink. |
(Analyzed at: Apr, 2026) In 2026, longer and less predictable reefer routings and congestion knock-ons from ongoing Middle East/Red Sea disruptions have made “in-transit time + temperature visibility” a real cost variable, not a nice-to-have. [2]
Put one requirement in your next frozen-plantain contract: shipment-level temperature recording (not just set-point) tied to a clear credit/claim mechanism, and pair it with a minimum packaging barrier/seal spec to reduce dehydration risk. This works because your biggest avoidable losses come from temperature cycling and moisture migration after the factory gate—exactly where procurement normally has the least data.
The stakes are practical: one compromised container can trigger rework, credits, and expedited cover buys that often dwarf any 1–3% unit-price win.


