INDUSTRY TRENDS

Frozen Pineapple Sourcing Intelligence That Improves Landed Cost, Continuity, and Auditability

Author
Team Tridge
DATE
March 19, 2026
9 min read
frozen-pineapple Cover
Tridge Eye Data Intelligence Solution

This report is powered by Tridge Eye Data Intelligence.

Every data point, price signal, and supply risk insight in this analysis comes from the same platform that procurement and sourcing leaders worldwide rely on daily. As you read, consider what this level of market intelligence could do for your sourcing decisions.

Explore Tridge Eye →

Frozen pineapple looks like a simple commodity (chunks in a bag), but procurement outcomes are determined upstream—by harvest maturity, processing yield, qualified capacity, and cold-chain integrity. This guide is written for procurement and sourcing leaders who are experienced category managers but newer to frozen pineapple: it explains what actually drives cost and risk, what to watch, and how to convert market/supplier signals into concrete sourcing actions you can defend internally.

Executive Summary

  • What you’re really buying: a yield- and cold-chain-sensitive supply chain; the same “FOB price” can produce very different landed cost + claims outcomes.
  • MD2 (“Golden/Extra Sweet”) matters: It remains the dominant export cultivar in major export programs (especially Costa Rica), which influences spec expectations and supplier pools. [1]
  • Qualified capacity is the constraint: Many sites can freeze pineapple; fewer can consistently hit your Brix/defect/foreign-matter/traceability requirements at scale.
  • Food safety scrutiny is real in frozen fruit: Recent U.S. actions include a June 2023 FDA recall of specific frozen fruit products linked to pineapple due to potential Listeria monocytogenes contamination, reinforcing why buyers push harder on preventive controls, testing, and traceability. [2]
  • Cost stacks (not single drivers) explain price moves: yield loss + labor + energy + reefer logistics + QA cost-to-serve typically move together.
  • Governance is a sourcing deliverable: audit-ready rationale, KPIs, and risk acceptance records reduce friction with QA/ops/leadership.

Key Insights

Analyzed at: Mar, 2026

  • Strategy: Hold
  • Reliability: Medium
  • Potential Saving: 3% ~ 8%
  • Insight: In Mar 2026, the best near-term value is typically not “chasing the lowest FOB,” but tightening total-landed-cost control:
  • re-baseline your pineapple IQF should-cost using yield/claims and cold-chain performance by supplier,
  • re-qualify at least one backup source by spec family (retail-grade chunks vs industrial-grade chunks vs tidbits/puree), and
  • upgrade food-safety/traceability requirements in line with the post-2023 frozen-fruit scrutiny (e.g., mock recall speed, environmental monitoring expectations).
  • These steps commonly unlock mid-single-digit savings by reducing rejects/chargebacks and preventing premium-priced spot buys during disruptions, while improving continuity and auditability. [2]

1) What you’re really buying: the frozen‑pineapple supply chain, end‑to‑end (ground truth)

Frozen pineapple looks like a simple commodity (chunks in a bag), but procurement outcomes are determined upstream—by harvest maturity, processing yield, and cold‑chain integrity.

A left-to-right flow diagram showing the frozen pineapple supply chain with 6 labeled nodes: (1) Farms/Grower Networks (maturity window, MD2 dominance), (2) Primary Processing (wash/sort/peel/core/cut; yield loss), (3) Secondary Processing (IQF vs block; freezing speed/temperature control), (4) Packaging + QA (foreign-matter control, micro testing, COAs, traceability docs), (5) Ocean Reefer + Destination Cold Storage + Distribution (temperature excursions, port dwell), (6) End Markets (retail/foodservice/industrial spec divergence). Add small callouts under each node for the key procurement risk/cost lever (yield, labor, energy/capacity, QA cost-to-serve, cold-chain integrity, spec family). Use neutral icons (farm, knife/gear, snowflake, checklist, container/truck, storefront) and avoid any dashboard UI styling.

Typical flow (what matters at each node)

  1. Farms / Grower networks (raw fruit)
  2. Pineapple is harvested to a target maturity window (sweetness/acid balance). Harvest too early = lower Brix; too late = softer texture after freezing.
  3. Commercial export programs are heavily anchored on MD2 (“Golden/Extra Sweet”) for consistency and sweetness, especially in Costa Rica-led export supply. [1]
  4. Primary processing (wash/sort/peel/core/cut)
  5. This is where cost is “created” via yield loss (trim) and defect removal.
  6. Cut choice (chunks vs tidbits vs spears) changes yield and labor intensity.
  7. Secondary processing (freezing: IQF or block)
  8. IQF capacity, energy cost, and freezer uptime are common constraints.
  9. Product texture outcomes depend on freezing speed, piece size, and temperature control; IQF is designed to freeze pieces quickly and keep pieces separated, generally improving texture vs block freezing. [3]
  10. Packaging + QA (spec compliance + audit readiness)
  11. Packaging is not just film/cartons—it’s also foreign‑matter control, micro testing, traceability, and customer/audit requirements.
  12. Ocean reefer + destination cold storage + distribution
  13. The product can be “made right” and still fail due to temperature excursions, port dwell, or weak last‑mile freezer handling.
  14. End markets (retail/foodservice/industrial)
  15. Specs diverge: industrial often tolerates different size distribution than retail; foodservice may prioritize price and availability.

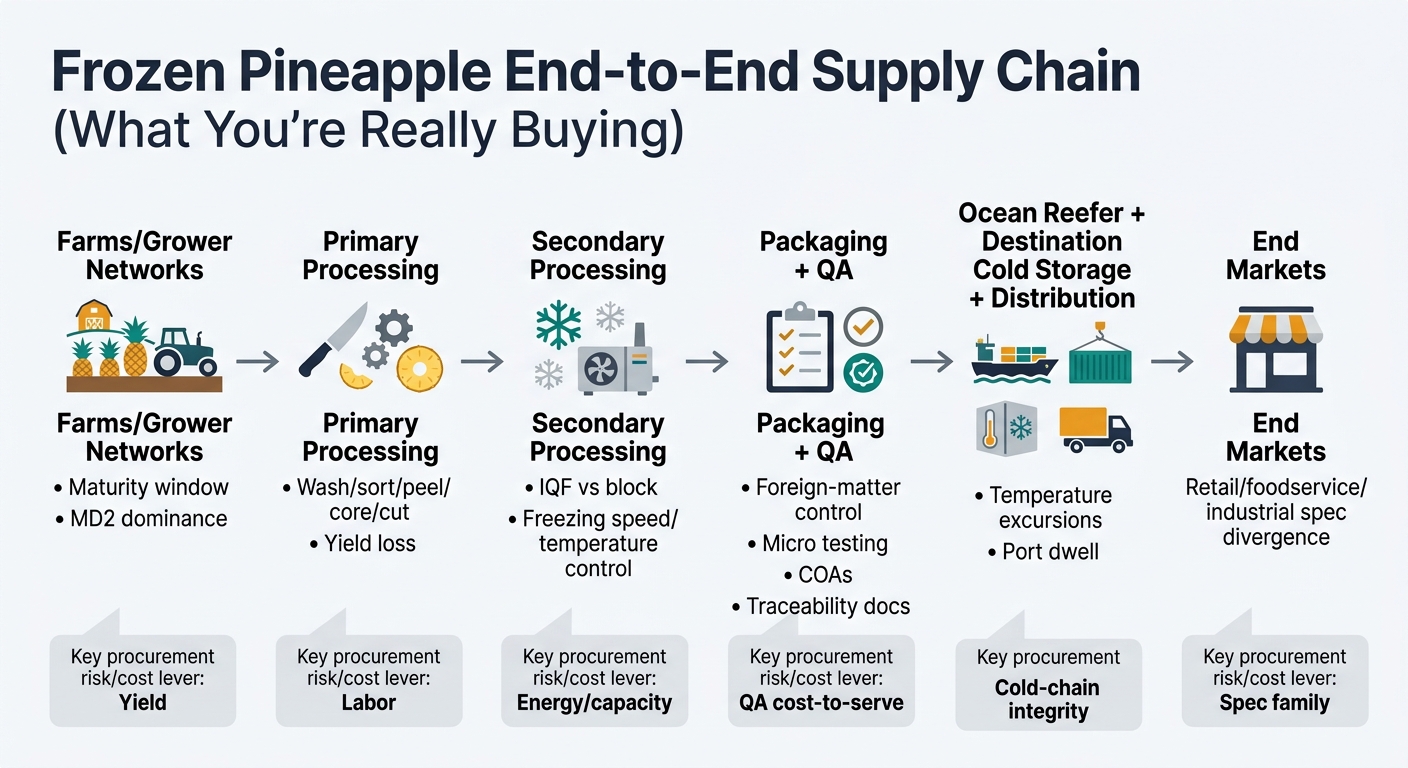
Procurement implication: Your biggest levers are usually portfolio design (origin/supplier mix), spec discipline, and contract structure, not just unit price.

2) Where the money accumulates: cost & margin build‑up by node (and why it surprises teams)

Key insight: Frozen pineapple cost is yield‑sensitive and logistics‑sensitive. Two suppliers can quote the same FOB but deliver different landed cost after factoring yield loss, claims, and cold‑chain failures.

2.1 Upstream / Raw material (fruit economics)

What drives cost here

  • Farmgate fruit price (competing channels like fresh export and juice/puree)
  • Yield risk (weather, pest pressure) → more rejects downstream
  • Variety & maturity discipline (MD2 programs tend to be more standardized in export channels) [1]

What procurement should watch

  • Signals of tighter fruit supply: weather anomalies, disease pressure, or rapid shifts into higher‑value channels.

2.2 Primary processing (peel/core/cut = yield loss + labor)

What drives cost here

  • Labor intensity (manual trimming and defect removal)
  • Cut spec tightness (uniform chunks and low fines = more trim loss)
  • Defect tolerance (browning, translucency, bruising) → higher rejects

Procurement watch‑outs

  • “Spec creep” (QA tightening specs mid‑contract) can silently raise processing cost and reduce supplier willingness to commit volume.

2.3 Secondary processing (freezing + energy + capacity)

What drives cost here

  • Energy for freezing and cold storage
  • IQF tunnel capacity (bottleneck risk during demand spikes)
  • Glaze targets (moisture protection vs “value perception” disputes)

Procurement watch‑outs

  • If a supplier is running multiple tropical fruits on the same line, pineapple throughput can be deprioritized when other SKUs are more profitable.

2.4 Packaging & QA (hidden cost center)

What drives cost here

  • Film/cartons/palletization
  • Metal detection/X‑ray, micro testing, COAs, traceability documentation
  • Audit and certification upkeep

Procurement watch‑outs

  • The cheapest quote often underestimates the true cost of customer‑specific QA and documentation.

2.5 Logistics & distribution (reefer + dwell time + working capital)

What drives cost here

  • Ocean reefer rates and availability
  • Port congestion → longer dwell → higher cold storage and demurrage risk
  • Destination freezer space and inventory holding cost

Procurement watch‑outs

  • When ports slow down, the cost impact is not only freight—it’s inventory timing, service risk, and claims.

2.6 Wholesale/retail/brand margin (where price becomes political)

What drives cost here

  • Distributor margin, retailer markup, promo calendars
  • Penalties/chargebacks for OTIF failures (especially retail)

Procurement watch‑outs

  • Internal stakeholders see shelf price and assume supplier margin expansion; in reality, cost may be accumulating in logistics and QA.
A stacked bar chart with three bars (A) IQF Chunks, (B) IQF Tidbits, (C) Puree. Each bar segmented by the same cost nodes used in the article tables: Raw fruit, Primary processing, Freezing/Secondary processing, Packaging & QA, Logistics & cold storage, Supplier/exporter + downstream margin. Use the exact illustrative percentages shown: Chunks (28/22/12/10/18/10), Tidbits (26/26/11/10/17/10), Puree (32/14/18/12/14/10). Include a clear legend, and a footnote label 'Illustrative modeled split; varies by origin/spec/terms' to match the article tone. Keep styling clean and data-forward; no product UI elements.

Product-level cost breakdown (illustrative, modeled)

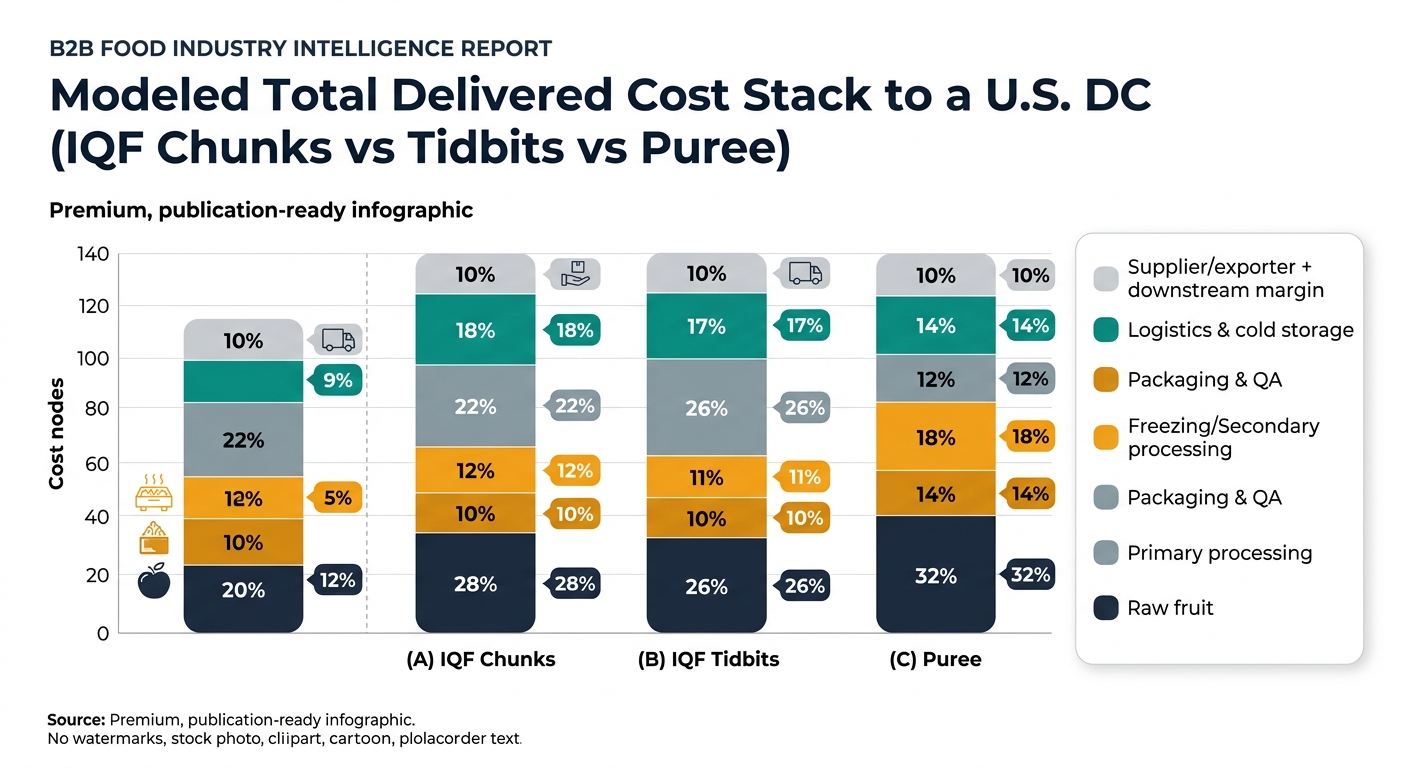
Modeled % of final delivered cost to a U.S. buyer DC. These are directional to show where cost concentrates; actual splits vary by origin, contract terms, seasonality, and spec.

A) IQF Pineapple Chunks (retail/foodservice, 10–20 kg industrial cartons or retail bags)

Supply chain node Cost ratio (% of final delivered cost) What moves it most
Raw fruit 28% Farmgate price, yield risk
Primary processing 22% Labor + trim loss from cut/spec
Freezing (IQF/block) 12% Energy + line utilization
Packaging & QA 10% Packaging inflation + testing/audit load
Logistics & cold storage 18% Reefer rates, port dwell, inventory time
Supplier/exporter + downstream margin 10% Financing, risk premium, channel power

B) IQF Pineapple Tidbits (more cutting steps, higher fines risk)

Supply chain node Cost ratio (% of final delivered cost) What moves it most
Raw fruit 26% Fruit size mix
Primary processing 26% Higher labor + yield loss
Freezing 11% Throughput constraints
Packaging & QA 10% Foreign-matter controls
Logistics & cold storage 17% Reefer + storage
Supplier/exporter + downstream margin 10% Risk premium

C) Pineapple Puree (frozen or aseptic adjacent input; different economics)

Supply chain node Cost ratio (% of final delivered cost) What moves it most
Raw fruit 32% Competing demand (juice/puree)
Primary processing 14% Less cut precision, more bulk handling
Secondary processing 18% Thermal/processing + QA
Packaging & QA 12% Drums/totes, aseptic controls
Logistics & storage 14% Bulk freight + storage
Supplier/exporter + downstream margin 10% Financing + risk

3) The structural fact that shapes your supplier options: “qualified capacity” is narrower than it looks

Key structural fact: In frozen pineapple, the constraint is often qualified processing capacity for your exact spec, not global pineapple production.

Why this matters

  • Many processors can freeze pineapple, but fewer can consistently hit:
  • Brix range (sweetness consistency)
  • piece size distribution with low fines
  • defect tolerances (browning/translucency)
  • foreign-matter controls at your standard
  • traceability depth and audit readiness
  • Major export supply is concentrated in a few origin clusters; Costa Rica’s export system is strongly associated with MD2 programs. [1]

Procurement consequence: Over‑tight specs can unintentionally force single‑sourcing, increasing continuity risk.

4) The critical insight: why supplier price moves often don’t match your “market view”

Critical insight: Frozen pineapple pricing can disconnect from “pineapple market” headlines because the traded product is a bundle of yield + processing capacity + cold-chain logistics + QA risk.

Common disconnect drivers

  1. Yield shocks show up as processing cost, not just fruit price
  2. If fruit size/defect rates worsen, processors lose more to trim and sorting. That hits cost even if farmgate price looks stable.
  3. Cold-chain risk gets priced in during disruption periods
  4. When ports congest or reefer availability tightens, suppliers add a risk premium (or reduce willingness to hold price).
  5. QA and recall exposure changes the “true cost”
  6. Frozen fruit has had high-impact events that increase buyer scrutiny and supplier cost-to-serve. Examples include:
  7. FDA’s Feb 2023 investigation into hepatitis A infections linked to frozen organic strawberries imported from Mexico. [4]
  8. FDA’s June 2023 recall of specific frozen fruit products linked to pineapple due to potential Listeria monocytogenes contamination. [2]

Procurement takeaway: A “market-justified increase” is rarely explained by one variable. It’s usually a stack (yield + labor + energy + freight + QA).

5) Where procurement teams typically get frozen pineapple wrong (patterns that drive avoidable cost)

  1. Treating all IQF pineapple as interchangeable
  2. Then discovering the hard way that texture, drip loss, and defect rates vary materially by supplier and origin.
  3. Negotiating on FOB only (ignoring landed cost + claims)
  4. A 2–3% cheaper price is quickly erased by:
  5. higher fines/size variability
  6. more rejections
  7. temperature excursion claims
  8. Single‑sourcing because “it’s just fruit”
  9. Qualification lead times (QA, trials, documentation) mean switching late becomes expensive.
  10. Over‑tight specs without quantifying business value
  11. Example: tightening cut uniformity can raise trim loss and reduce eligible supplier pool; if the end product is blended (smoothies/yogurt), the value may be limited.
  12. No governance narrative
  13. When a disruption hits, teams scramble without a defensible record of why risk was accepted.

6) What an intelligence-driven approach changes (and the measurable outcomes it targets)

This is not about “more data.” It’s about turning signals into sourcing actions that improve cost, continuity, and auditability.

Capability mapping (decision → intelligence → action)

  1. Decision: “Do we accept this increase or push back?”
  2. Use: Price intelligence & cost-driver decomposition
  3. Action: Build a fact-based should-cost view (fruit/yield proxies, energy, freight, packaging, FX) and define negotiation guardrails:
  4. what you’ll accept as pass-through
  5. what you’ll treat as supplier-specific margin expansion
  6. Outcome: Fewer surprise increases; stronger internal alignment.
  7. Decision: “Where are we exposed next quarter?”
  8. Use: Origin & supply chain risk monitoring
  9. Action: Map your spend/volume by origin + port lane + supplier site; trigger pre-emptive steps when thresholds hit:
  10. earlier bookings
  11. safety stock adjustments
  12. QA trials for alternates
  13. Outcome: Reduced expedite freight and fewer service failures.
  14. Decision: “Who should be strategic vs tactical in our portfolio?”
  15. Use: Supplier benchmarking & qualification support
  16. Action: Score suppliers on:
  17. audit readiness and traceability
  18. cold-chain handling practices
  19. pack format flexibility
  20. OTIF + claims history
  21. Outcome: Clearer supplier segmentation; better SRM focus.
  22. Decision: “If Supplier A fails, what’s the least-bad plan?”
  23. Use: Alternative sourcing scenario building
  24. Action: Model origin shifts, pack-format swaps, and temporary spec relaxation with quantified trade-offs (cost, lead time, QA risk).
  25. Outcome: Faster recovery with fewer quality surprises.
  26. Decision: “Can we defend this in an audit or leadership review?”
  27. Use: Procurement performance & governance reporting
  28. Action: Maintain an auditable decision trail: risk accepted, mitigation steps, KPIs, and supplier corrective actions.
  29. Outcome: Reduced governance friction; faster cross-functional approvals.

7) Strategic use cases procurement leaders actually run in frozen pineapple

  1. Dual-source design by “spec families,” not by SKU name
  2. Build alternates for:
  3. IQF chunks (retail grade)
  4. IQF chunks (industrial grade)
  5. tidbits/spears
  6. puree
  7. Benefit: continuity without forcing every supplier to meet the tightest spec.
  8. Contracting playbook: split volume by risk appetite
  9. Example structure:
  10. 60–70% on indexed or semi-fixed with defined reopeners
  11. 30–40% flexible for opportunistic buys or backup
  12. Benefit: reduced volatility while preserving optionality.
  13. Spec optimization workshops with QA + R&D
  14. Convert “preferences” into quantified tolerances:
  15. acceptable fines %
  16. acceptable size distribution
  17. Brix bands aligned to finished product needs
  18. Benefit: expands qualified supplier pool and reduces cost-to-serve.
  19. Cold-chain risk control as a sourcing KPI
  20. Add measurable controls:
  21. temperature recorder compliance
  22. excursion thresholds and claims process
  23. port dwell time monitoring
  24. Benefit: fewer texture failures and chargebacks.
  25. Recall-readiness and traceability stress tests
  26. Given frozen fruit’s history of high-impact recalls, validate:
  27. lot coding integrity
  28. mock recall capability (time-to-trace and time-to-communicate)
  29. segregation practices for organic vs conventional
  30. Benefit: reduced brand risk and faster incident response. [2]

8) Why this matters beyond pineapple (adjacent categories you likely also source)

Frozen pineapple is a clean example of a broader procurement truth: the “unit price” is the least stable part of the decision.

Adjacent categories where the same intelligence approach pays off

  • Frozen strawberries / berry blends
  • Food safety events can rapidly reshape buyer requirements, testing intensity, and approved-supplier lists. [4]
  • Frozen mango
  • Similar yield sensitivity (cut spec drives trim loss) and similar cold-chain texture risks.
  • Frozen avocado
  • Strong exposure to origin concentration and quality variability; high claims risk if cold chain fails.
  • Orange juice / tropical purees
  • Pricing can disconnect from “crop headlines” because processing capacity, inventory, and logistics dominate near-term availability.

The transferable procurement capability is the same:

  • separate market moves from supplier moves
  • pre-qualify alternates before disruption
  • document decisions for governance

9) Why this example is persuasive for procurement leaders evaluating intelligence-led sourcing

Frozen pineapple is an ideal “proof category” because it forces clarity on what procurement is accountable for:

  • Cost control: Not just negotiating price, but reducing total landed cost volatility (yield + claims + freight).
  • Continuity: Avoiding single points of failure in qualified capacity.
  • Risk mitigation: Managing food safety and cold-chain exposure with measurable controls.
  • Governance: Creating an audit-ready narrative that survives staff turnover.

If you can run frozen pineapple with disciplined intelligence—spec governance, portfolio resilience, and cost-driver negotiation—you can replicate the operating model across most frozen fruit and adjacent ingredients.

Tridge Eye Data Intelligence Solution

Make Faster, Data-Driven Sourcing Decisions

The insights in this report are just the starting point. Tridge Eye is the data intelligence solution that gives procurement and sourcing leaders real-time market signals, price benchmarks, and supply risk alerts — so you can act before the market moves.

Explore Tridge Eye →

References

  1. cbi.eu
  2. fda.gov (June 2023 frozen fruit recall notice)
  3. crestwoodglobal.com
  4. fda.gov (Feb 2023 outbreak investigation)
Subscribe
By subscribing you agree to with our Privacy Policy and provide consent to receive updates from our company.
Thank you! Your submission has been received!
Oops! Something went wrong while submitting the form.
Subscribe to receive the latest blog posts, updates, promotions, and announcements from Tridge.