INDUSTRY TRENDS

Frozen Pear Sourcing (Mar 2026): Managing Cost Volatility, Continuity Risk, and Spec Governance in a Pack-Window Category

Author
Team Tridge
DATE
March 9, 2026
10 min read
frozen-pear Cover
Tridge — Trusted Global Food Sourcing

This report is powered by Tridge market intelligence.

Every data point, price signal, and supply chain insight in this analysis is drawn from the same engine that procurement teams worldwide rely on daily. As you read, consider what this level of visibility could do for your category.

See how Tridge Eye works →

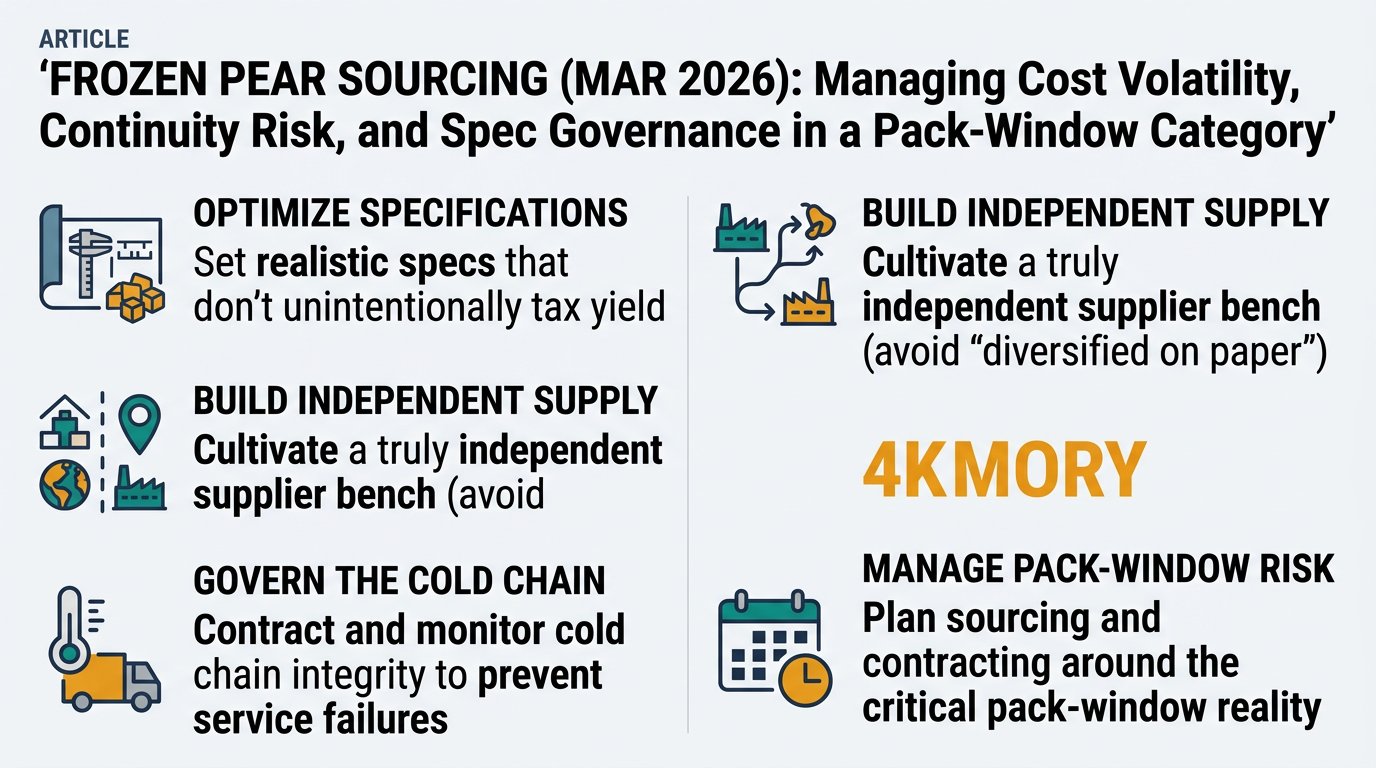
This guide is written for Purchase – Product & Category Management teams who are strong procurement practitioners but newer to frozen pears. The goal is to translate frozen-pear market and supply-chain realities into practical category actions: how to set specs that don’t unintentionally tax yield, how to build a supplier bench that is truly independent (not “diversified on paper”), and how to contract and govern the cold chain so claims and service failures don’t erase unit-price wins.

Executive Summary

  • Pack-window reality: Frozen pears are a “make-the-year” category; late RFPs often become allocation conversations rather than true competitions.
  • China concentration is real: USDA FAS data implies China is ~75–80% of global fresh pear production (e.g., 2024/25: ~20.2M tons China out of ~25.9M global). [1]
  • Price moves even when “crop looks fine”: Delivered frozen cost is driven by conversion economics (yield/spec) and cold-chain cost-to-serve (energy + storage + reefer reliability), not just fruit.
  • Cold chain is a structural cost driver: Refrigeration is energy-intensive at the system level; credible industry bodies (IIR) estimate refrigeration is a large share of global electricity use (~20% in their framing). [2]
  • Audit/cert language needs tightening: It’s correct to reference “GFSI-recognized schemes,” but cite GFSI directly (BRCGS, FSSC 22000, SQF are recognized certification programme owners). [3]
  • Tariffs/trade: Treat China-origin frozen fruit as potentially subject to MFN + Section 301 duties, verified by HTS code using USTR/USITC tools.

Key Insights (Analyzed at: Mar, 2026)

  • Strategy: Hold
  • Reliability: Medium
  • Potential Saving: 4% ~ 9%
  • Insight: For North America IQF pears, the best near-term value is rarely “chasing the lowest FOB.” Instead, run a controlled Hold posture: (1) lock a base volume early enough to secure pack-window allocation, (2) negotiate driver-based clauses for energy/cold-storage and reefer cost-to-serve (with documentation expectations), and (3) qualify at least one truly independent secondary source (different freezer/packer and different export cold-store/port node). This typically delivers mid-single-digit landed-cost stability and reduces the probability of spot buys that can erase annual savings.

1) What you’re really buying: the frozen-pear supply chain in plain terms (ground truth)

Frozen pears look simple on a bid sheet (IQF slices/dices, puree, or a blend component). In reality, the category is governed by three hard constraints:

  1. Pack windows are narrow (you “make the year” during harvest/processing season).
  2. Yield is spec-sensitive (tight color/defect/size specs change usable output and cost).
  3. Cold chain is non-negotiable (energy + storage + reefer reliability drive both cost and claims).

Below is the practical flow most buyers are exposed to (even if you don’t see all of it contractually):

A left-to-right flowchart showing the end-to-end frozen pear supply chain: upstream raw pears → primary processing (sort/peel/core/cut + anti-browning; optional blanch) → secondary processing (IQF freezing or puree pulping + thermal step + freezing) → packaging & QA (lot coding/traceability, foreign material controls, testing; governance checkpoint noted as GFSI-recognized scheme) → origin cold store → reefer ocean/frozen trucking → destination cold store/DC → customer plant/end-use, with callouts for narrow pack window, spec-sensitive yield, and cold chain non-negotiable, plus risk icons for temperature excursions, dwell time, and port handoffs.
  • Upstream / Raw fruit: processing-grade pears (often diverted from fresh-market channels based on grade and market conditions).
  • Primary processing: sorting, peeling/coring, cutting, anti-browning treatment (ascorbic/citric), optional blanching.
  • Secondary processing: IQF freezing (tunnel/spiral), screening for piece-size distribution, removal of fines, metal detection; or puree (pulping + thermal step as specified) then frozen.
  • Packaging & QA: food safety system (GFSI-recognized certification programmes are common; examples of GFSI-recognized programme owners include BRCGS, FSSC 22000, and SQF), lot coding/traceability, micro/residue/foreign material controls. [3]
  • Logistics & distribution: cold store at origin, reefer ocean container or domestic frozen trucking, destination cold store, then customer DC/plant.
  • End-use: retail bags, foodservice packs, industrial ingredient (yogurt inclusions, bakery fillings, fruit prep).

Default assumption used in this report (state yours if different): IQF pear dices/slices for foodservice/industrial in North America, with a spec that is texture- and browning-sensitive (typical for inclusions).

2) Where the money goes: cost & margin build-up by node (and why your spec sits at the center)

Key insight

Frozen-pear cost is not “farm price + freight.” It’s a yield-managed manufacturing product where small spec choices (piece-size tolerance, defect limits, color/browning control, sugar addition rules) can shift:

  • labor minutes (trim/inspection)
  • pack-out yield (usable %)
  • rework/screening losses (fines/breakage)
  • claims exposure (temperature excursions → texture breakdown)

Below is a node-by-node view of what typically dominates cost and where margins accrue.

2.1 Upstream / raw pears (orchard + diversion economics)

What matters operationally

  • Processing supply is influenced by fresh-market pull: when fresh prices are attractive, processors compete harder for fruit or accept lower grades.
  • Variety and maturity affect Brix/texture and how much trimming is required.

Primary cost drivers

  • Harvest labor and orchard yield variability
  • Fresh-market diversion rate (availability of processing-grade fruit)
  • Quality distribution (defects, firmness) → downstream yield

Where procurement gets leverage

  • Align contracting timing to harvest calendars and pack windows (don’t negotiate “late” when pack decisions are already locked).

2.2 Primary processing (peel/core/cut + anti-browning)

What matters operationally

  • This is the most labor-sensitive step (peeling/coring/cutting + trimming).
  • Anti-browning treatment and optional blanching are not “minor additives”—they are a quality stabilization system.

Primary cost drivers

  • Labor availability and wage pressure
  • Water/wastewater costs
  • Yield loss from trim and defect removal

Where procurement gets leverage

  • Translate spec into yield: tighter defect limits can create a hidden “yield tax.”

2.3 Secondary processing (IQF freezing / puree manufacturing)

What matters operationally

  • IQF lines have capacity limits; when lines are tight, suppliers prioritize higher-margin or easier-to-run specs.
  • Refrigeration and freezing are energy intensive. Rather than quoting a generic “~30% of cost,” treat energy as a negotiable driver: ask each supplier for last-season kWh/ton benchmarks (or a proxy), energy index references, and evidence for any energy surcharge.

Primary cost drivers

  • Electricity/fuel for freezing and cold storage
  • Line efficiency (downtime, changeovers between cut sizes)
  • Screening losses (fines, breakage)

Where procurement gets leverage

  • Ask for a cost-driver decomposition: fruit vs labor vs energy vs packaging vs freight—then negotiate with evidence, not averages.

2.4 Packaging & QA (where governance becomes real)

What matters operationally

  • Packaging format (retail vs foodservice vs industrial) changes labor and materials.
  • QA is not only audits; it’s ongoing lot disposition, micro/residue testing, foreign material controls.

Primary cost drivers

  • Packaging materials (liners, cartons, labels)
  • QA/testing frequency and certification maintenance

Where procurement gets leverage

  • Make QA gates procurement-operable: pre-approved alternates, defined spec deltas, and documented release rules.

2.5 Logistics & distribution (cold-chain cost-to-serve)

What matters operationally

  • Cold chain failures show up as claims (browning, mushy texture, ice crystallization) and service failures.
  • Port congestion and reefer availability are “silent” continuity risks.

Primary cost drivers

  • Reefer ocean freight / frozen trucking
  • Destination cold storage + dwell time
  • Demurrage/detention risk

Where procurement gets leverage

  • Lane-level governance: monitor dwell times, temperature data availability, and claims by lane.

2.6 End-market margin (importer/distributor/customer economics)

What matters operationally

  • The last margin layer is often driven by service level expectations (fill rate, lead time, packaging customization) and credit/claims handling.

Primary cost drivers

  • Working capital (inventory months-on-hand)
  • Customer-specific handling and compliance

Product-level cost breakdown (illustrative, delivered cost basis)

Stacked bar chart visualizing illustrative delivered-cost ratios for IQF pear dices: upstream raw pears (30–45%), primary processing (15–25%), secondary processing/IQF (10–20%), packaging & QA (5–10%), logistics & distribution (10–20%), and channel margin (5–15%), labeled as illustrative ranges with notes that spec tightness shifts yield and energy/storage plus reefer reliability shift secondary and logistics shares.

These are modeled ranges to show where cost concentrates. Actual ratios vary by origin, supplier scale, energy prices, packaging, and Incoterms.

A) IQF Pear Dices (industrial/foodservice, 10–20 kg cartons)

Supply chain node Cost ratio (illustrative) What usually moves it
Upstream raw pears 30–45% crop size, fresh-market diversion, grade distribution
Primary processing 15–25% labor + yield loss from trim/defects
Secondary processing (IQF) 10–20% energy, line efficiency, screening losses
Packaging & QA 5–10% carton/liner costs, test frequency
Logistics & distribution 10–20% reefer rates, cold storage, dwell time
Channel margin (importer/distributor) 5–15% inventory risk, service levels, credit/claims

B) Frozen Pear Puree (ingredient)

Supply chain node Cost ratio (illustrative) What usually moves it
Upstream raw pears 25–40% fruit price + solids yield
Primary processing 10–20% receiving QC, trim, pulp yield
Secondary processing (puree + thermal step + freezing) 15–25% energy + processing inputs + throughput
Packaging & QA 5–12% pack style + testing
Logistics & distribution 10–20% cold chain + density/handling
Channel margin 5–15% contract coverage + inventory

C) Pear-in-blend component (e.g., berry/pear mix)

Supply chain node Cost ratio (illustrative) What usually moves it
Pear component cost (all upstream + processing) 20–40% pear spec + pear market
Other fruit components 30–60% berry markets are often more volatile
Co-pack/blending + packaging & QA 8–15% co-pack capacity, changeovers
Logistics & distribution 10–20% cold chain + SKU complexity
Channel margin 5–12% service levels + inventory

3) Structural fact you can’t negotiate away: pears are abundant globally, but exportable, spec-compliant frozen pears are not

Key insight

Global pear production is heavily concentrated in China. USDA FAS data for fresh pears indicates (example reference point) 2024/25 world production ~25.9M tons with China ~20.2M tons, implying ~78% share—directionally consistent with the “~three-quarters” shorthand. [1]

For frozen pears, the constraint is not “are pears grown?” but:

  • Do you have the right processing infrastructure (IQF/puree lines) at the right time?
  • Do you have consistent grade + spec compliance (color/texture/defects) at scale?
  • Can the cold chain deliver without temperature abuse?

This is why a buyer can see plenty of “supplier names,” yet still struggle to qualify alternates quickly.

4) The critical insight: why your frozen-pear price can move even when the pear crop looks fine

Key insight

Frozen-pear pricing often disconnects from “headline crop” narratives because it is driven by conversion economics and delivered cold-chain cost-to-serve.

Common disconnect mechanisms:

  1. Fresh-market pull changes processing availability
  2. A stable total crop can still mean less processing-grade fruit if fresh channels pay more.
  3. Spec-driven yield swing
  4. A tighter browning/defect spec can raise effective fruit requirement per finished kg.
  5. Energy and cold storage shocks transmit quickly
  6. Refrigeration is energy-intensive at a system level; credible cold-chain bodies estimate refrigeration is a large share of global electricity consumption, which is why energy shocks often show up quickly in cold storage and freezing economics. [2]
  7. Lane risk becomes a cost
  8. If a route has higher dwell time/temperature excursion risk, you pay through claims, shrink, or higher “risk premium” pricing.
  9. Trade and tariff uncertainty (especially China-linked exposure)
  10. Treat this as a governance requirement, not a general statement: for China-origin frozen fruit, confirm the exact HTS code and whether Section 301 duties apply using USTR/USITC tools; then decide whether to source China at all or only via distributors who carry duty risk.

What this means for category strategy: you can’t run frozen pears like a simple commodity buy. You need to manage it like a manufactured ingredient with constrained pack windows.

5) Where procurement teams typically get frozen pears wrong (and how it shows up in P&L)

5.1 Treating the spec as “QA-owned,” not “cost-and-continuity owned”

Symptom: bids look comparable on paper, but awards concentrate into one supplier because alternates fail texture/color after thaw.

P&L impact

  • higher claims/credits
  • emergency buys at spot premiums
  • plant line disruptions (rework, yield loss)

5.2 Sourcing too late in the pack cycle

Symptom: you run an RFP after suppliers have already allocated IQF capacity.

P&L impact

  • limited leverage
  • more “subject to availability” language
  • higher MOQ and less favorable delivery cadence

5.3 Over-optimizing unit price while under-pricing cold-chain risk

Symptom: cheapest lane wins; then temperature excursions drive mushy texture/browning claims.

P&L impact

  • hidden landed cost inflation via credits and customer penalties

5.4 Assuming “more suppliers” equals diversification

Symptom: multiple suppliers on paper, but they rely on the same packer/freezer or the same export cold store.

P&L impact

  • correlated failure during disruptions

6) How an intelligence-driven approach changes the outcome (decision → intelligence → category action)

This section is written from the buyer decision first (not tool-first).

Decision A: “Can I lock cost without breaking the spec?”

Intelligence you need (decision-grade)

  • Cost-driver decomposition: fruit vs labor vs energy vs packaging vs freight
  • Term benchmarks: surcharge patterns, indexation clauses, lead-time norms

Category actions

  • Build a should-cost narrative for negotiation (what moved, what didn’t)
  • Use pricing bands or index-linked clauses for energy/freight components instead of blanket surcharges

Measurable outcomes

  • lower price variance vs budget
  • fewer surprise surcharges

Decision B: “If my primary supplier fails, can I switch in weeks—not months?”

Intelligence you need

  • Supplier discovery by origin + pack style + capacity signals
  • Qualification benchmarks: audit status, spec adherence history, MOQ/lead times

Category actions

  • Create a tiered supplier bench (Primary / Secondary / Emergency)
  • Pre-approve spec deltas (e.g., piece-size tolerance widening) with defined QA gates

Measurable outcomes

  • reduced stockout probability
  • faster emergency sourcing cycle time

Decision C: “Are claims a supplier performance issue or a lane/spec issue?”

Intelligence you need

  • Claims and defects linked to supplier, lot, and logistics lane
  • Corrective action responsiveness benchmarks

Category actions

  • Procurement-owned scorecard: OTIF, defect rate, claims rate, CAPA cycle time
  • Contract language: claim thresholds, documentation standards, temperature data expectations

Measurable outcomes

  • lower claims rate
  • fewer repeat non-conformances

7) Strategic use cases you can operationalize in a frozen-pear category plan

Use case 1: “Spec-to-cost map” for IQF pears (what each tightening actually costs)

  • Build a one-page artifact that translates:
  • color/browning tolerance → treatment/process needs + yield impact
  • piece-size distribution → screening losses and line efficiency
  • defect limits (stem/seed/peel) → trim labor and rework
  • Use it in:
  • bid evaluation (apples-to-apples)
  • internal alignment with QA/ops

Use case 2: Lane-level cold-chain risk register (not just supplier risk)

  • Track by origin lane:
  • port congestion exposure
  • cold store handoffs
  • temperature data availability
  • historical dwell time/claims
  • Convert into actions:
  • adjust Incoterms and responsibilities
  • require temperature monitoring evidence for high-risk lanes

Use case 3: Panel design that avoids “hidden single points of failure”

Diversify across:

  • origins (to reduce weather/geopolitical correlation)
  • packers/freezers (to reduce plant outage correlation)
  • logistics nodes (ports/cold stores)

Use case 4: Pack-window playbook (calendar-driven sourcing)

  • Build a category calendar:
  • when key origins harvest and pack
  • when inventory is typically committed
  • when to run RFPs and lock volumes
  • Even for fresh pears, global seasonality is well documented (Northern vs Southern Hemisphere harvest timing); frozen availability is smoothed by inventory, but pack timing still determines what exists to buy.

8) Why this matters beyond frozen pears (adjacent categories you likely buy)

The same intelligence pattern applies to other frozen fruit categories where spec + cold chain + pack windows dominate outcomes.

Frozen peaches (closest analog)

  • Similar pain points: browning control, texture after thaw, slice integrity
  • Procurement lesson: spec-to-yield mapping prevents “cheap fruit, expensive claims.”

Frozen apples

  • Similar pain points: oxidation control, piece-size distribution, rework/fines
  • Procurement lesson: lane-level risk governance matters because texture defects often trace to temperature abuse.

Frozen berry blends

  • Different fruit, same structural trap: multi-ingredient dependency + co-pack capacity constraints
  • Procurement lesson: diversification must consider co-manufacturer capacity and ingredient correlation, not just supplier count.

9) Why frozen pears are a powerful example for procurement leaders evaluating intelligence-led sourcing

Frozen pears force clarity on what “good procurement” looks like in modern food categories:

  • Cost: You win by negotiating the drivers (yield, energy, freight, packaging), not just the price per kg.
  • Continuity: You win by having a pre-qualified bench and pack-window discipline, not by scrambling post-disruption.
  • Risk: You win by governing lanes and nodes (cold stores, ports, packers), not only supplier names.
  • Governance: You win when claims, OTIF, and CAPA responsiveness are procurement KPIs—visible in renewals and award decisions.

If you can run frozen pears well, you can usually run any spec-sensitive, cold-chain dependent ingredient category with fewer surprises.

What to validate next (practical checklist for your next sourcing cycle)

  • Spec criticals (write them down): Brix/solids target, piece size distribution, defect limits, anti-browning requirements, and thaw-performance acceptance criteria.
  • Pack-window timing: confirm when your key origins/suppliers pack IQF/puree and when capacity is typically allocated.
  • Cold-chain evidence: temperature monitoring expectations (who provides it, format, retention), lane handoffs, and claim documentation.
  • True diversification test: map whether “different suppliers” share the same freezer/packer, export cold store, or port.
  • Certification/audit status: verify GFSI-recognized certification programme status and audit scope (site + activity scope) rather than accepting a logo on a slide. [3]

Take Your Sourcing Intelligence to the Next Level

The insights in this report are just the starting point. Tridge Eye gives you real-time market signals, origin risk alerts, and price benchmarks — so you can act before the market moves.

Explore Tridge Eye →

References

  1. fas.usda.gov
  2. iifiir.org
  3. mygfsi.com
Subscribe
By subscribing you agree to with our Privacy Policy and provide consent to receive updates from our company.
Thank you! Your submission has been received!
Oops! Something went wrong while submitting the form.
Subscribe to receive the latest blog posts, updates, promotions, and announcements from Tridge.