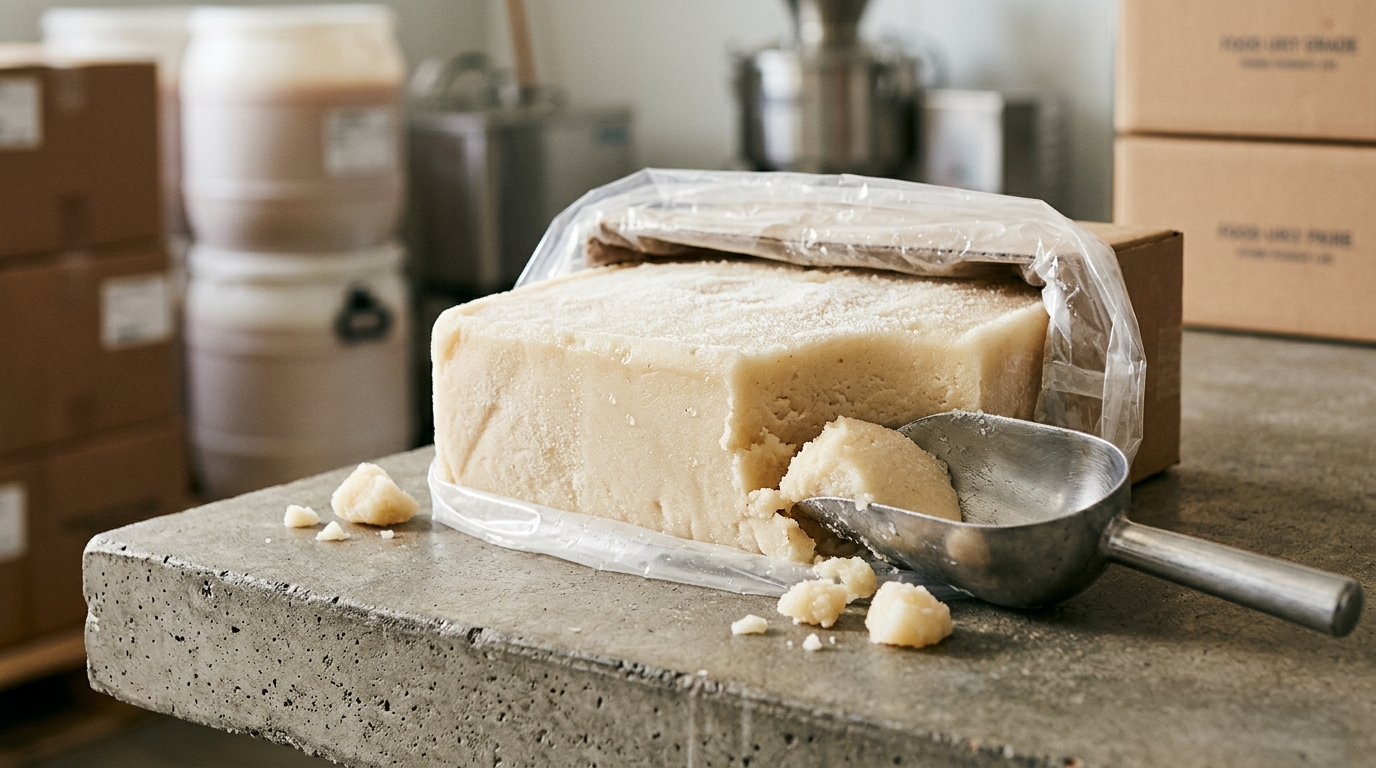
Frozen pear puree looks simple on paper (“pear puree, frozen”), but procurement outcomes are usually decided by three structural realities: processor yield, oxidation control after comminution, and cold-chain integrity across multiple handoffs. This guide maps the physical flow and where cost and risk truly lock in—so Purchase (Quality/Safety/Compliance) can write specs and contracts that reduce holds, rejects, and compliance surprises.
Frozen pear puree is a short, cold-chain-dependent supply chain where most cost is irreversibly “locked in” at two points: fruit yield at the processor (peel/core loss + sorting rejects) and energy + cold storage once the product is frozen. Unlike shelf-stable fruit ingredients, frozen puree carries a structural working-capital penalty because inventory sits in freezers to bridge seasonality.
The chain is built around turning variable, seasonal fruit into a standardized, frozen intermediate that can survive long-distance logistics without further cooking at the buyer.
Across U.S. public food-safety guidance, the freezer temperature anchor commonly cited is 0°F (-18°C). [1]
Your “map” should treat processor yield + freezing/cold storage + reefer dwell time as fixed structural cost drivers; most downstream cost is about protecting those sunk costs from oxidation, temperature abuse, and spec drift.
Orchards/packinghouse “seconds” → wash/sort → peel/core → comminution (pulping) → enzymatic texture control (optional) → deaeration (oxygen removal) → pasteurization/thermal treatment (often) → filling into liners (drums/pails/totes or block formers) → freezing (plate/blast) → frozen storage → reefer transport → importer/3PL freezer → buyer receiving → temper/thaw for use.

Frozen pear puree is a yield-and-energy business: raw fruit conversion efficiency and cold-chain intensity dominate cost, while QA and packaging protect against the most expensive failure modes (holds, disposal, and customer rejections).
Deaeration is widely referenced in fruit/juice processing as the step needed to remove dissolved oxygen (not just bubbles), reducing oxidation pressure after processing. [2]
Cost structure is predictable by node even when market prices move: (1) fruit losses and throughput at processing, (2) freezing + storage energy, (3) packaging that prevents taint/leaks and oxygen ingress, and (4) cold logistics reliability.
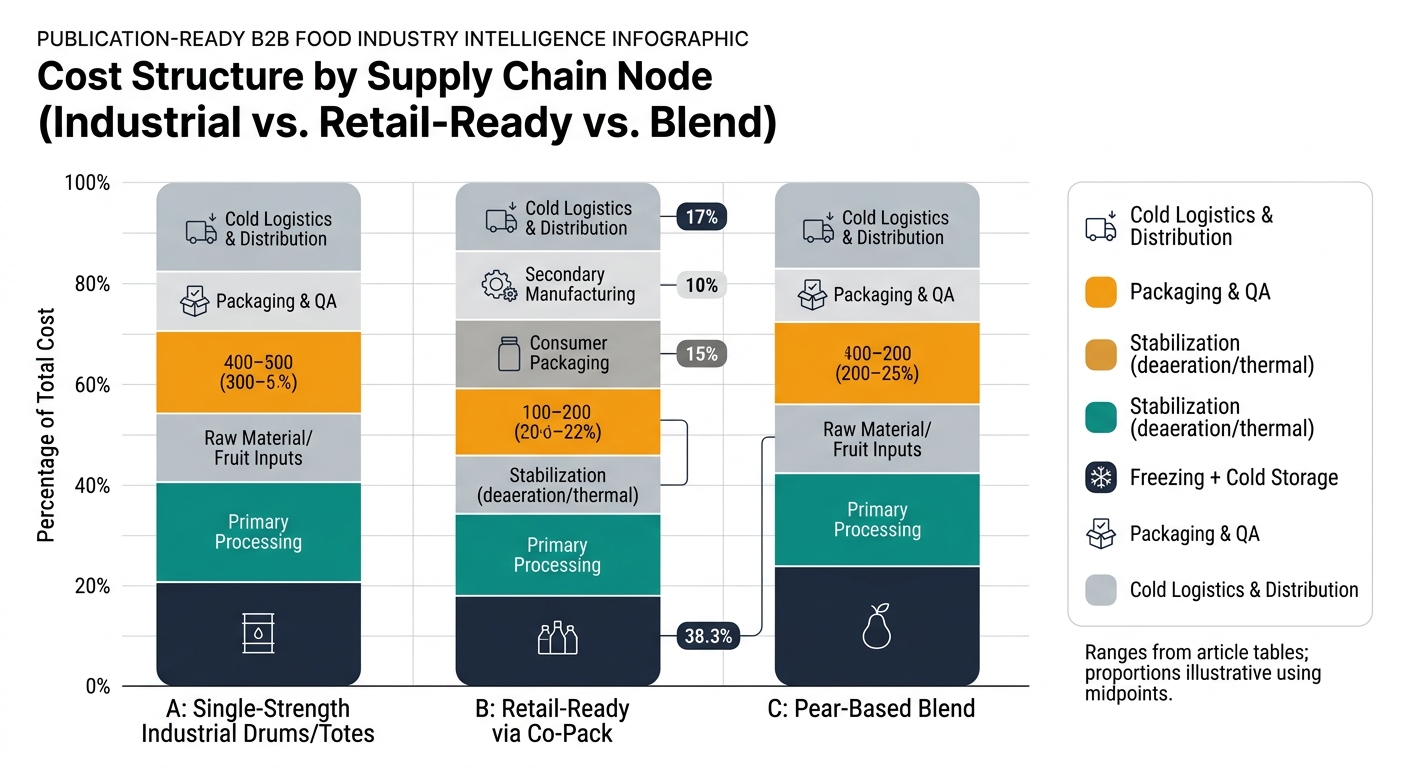
| Supply Chain Node | Cost Ratio (% of Final Cost) | Notes |
|---|---|---|
| Raw Material Cost (pears) | 35–50% | Driven by fruit availability, grade mix, and conversion yield (peel/core + rejects). |
| Primary Processing | 10–18% | Labor, water/wastewater, finisher/screening, foreign material controls. |
| Stabilization (deaeration/thermal) | 4–10% | Energy + equipment + validation; impacts color and flavor stability. |
| Freezing + Cold Storage | 10–18% | Freezing energy + freezer space + handling; structural working-capital load. |
| Packaging & QA | 6–12% | Liners/drums/totes, palletization, lab testing, COA release. |
| Cold Logistics & Distribution | 10–20% | Reefer freight, port/terminal dwell, 3PL freezer storage, claims risk. |
| Supply Chain Node | Cost Ratio (% of Final Cost) | Notes |
|---|---|---|
| Frozen Puree Input (from industrial chain) | 30–45% | Base ingredient cost imported from the industrial stream. |
| Secondary Manufacturing (fill/pack) | 10–18% | Thaw/temper, blending, re-pasteurization (if used), filling line efficiency. |
| Packaging (consumer) | 15–30% | High packaging-to-product ratio (pouch/cup, caps, labels, cartons). |
| QA & Compliance | 4–10% | Finished-goods micro, allergens/cross-contact controls, shelf-life validation. |
| Distribution (frozen retail) | 10–20% | Frozen DCs, retail freezer constraints, higher damage/returns exposure. |
| Supply Chain Node | Cost Ratio (% of Final Cost) | Notes |
|---|---|---|
| Fruit Inputs (pear + other fruit) | 35–55% | Blend design can reduce pear variability but adds multi-origin complexity. |
| Processing + Standardization | 12–22% | More blending/standardization steps; higher tank time and cleaning load. |
| Freezing + Cold Storage | 10–18% | Similar cold-chain intensity; sometimes higher handling due to batch splits. |
| Packaging & QA | 6–12% | More label/traceability complexity; COA may expand by customer requirement. |
| Cold Logistics & Distribution | 10–18% | Similar reefer profile; more lots to manage across ingredients. |
Frozen pear puree has a few non-negotiable physical realities that shape availability, quality consistency, and total delivered cost regardless of supplier.
The frozen chain is anchored to 0°F / -18°C freezer setpoints in widely used U.S. guidance, and fruit processing commonly uses deaeration to limit oxidation pressure—both are structural, not optional “nice-to-haves.” [1]
These realities explain why two “equivalent” purees can behave differently in your plant even when paperwork looks similar.
In frozen pear puree, the most meaningful spec language maps directly to physical control points: oxidation control, finishing/particle definition, and frozen integrity.
Storage at 0°F (-18°C) or lower is a widely referenced freezer target in U.S. guidance; oxygen reduction via deaeration is a known stability lever in fruit processing references. [1]
When you review a spec sheet or COA, you’re really checking whether the supplier’s process can repeatedly protect three things: (1) color/aroma (oxidation), (2) texture/flow (finishing + freeze/thaw behavior), and (3) safety/acceptability (validated thermal + hygienic handling).
The processor node locks in yield cost; stabilization locks in sensory stability; freezing locks in energy and working capital; packaging and logistics protect (or destroy) the value already paid for.
(Analyzed at: Sep, 2026)
Write contracts that treat cold chain as a measurable control, not a generic requirement: mandate continuous temperature evidence (carrier/3PL logs or device data) tied to the 0°F / -18°C anchor, and add a lane-specific dwell-time escalation clause for ports/terminals and cross-docks. This works because 2026 reefer markets are showing constrained effective capacity and higher disruption risk (congestion, imbalances, weather), which increases the probability of temperature abuse at handoffs even when transit times look “normal.” [3]
The stake is usually not a small freight delta—it’s avoiding a single temperature-driven hold or disposal event that can quietly wipe out the margin on multiple loads once you account for quarantine space, re-testing, and production downtime.