INDUSTRY TRENDS

Frozen Lingonberries: Where Cost, Risk, and Specs Actually Move (and How Category Managers Should Source in 2026)

Author
Team Tridge
DATE
March 6, 2026
9 min read
frozen-lingonberry Cover
Tridge — Trusted Global Food Sourcing

This report is powered by Tridge market intelligence.

Every data point, price signal, and supply chain insight in this analysis is drawn from the same engine that procurement teams worldwide rely on daily. As you read, consider what this level of visibility could do for your category.

See how Tridge Eye works →

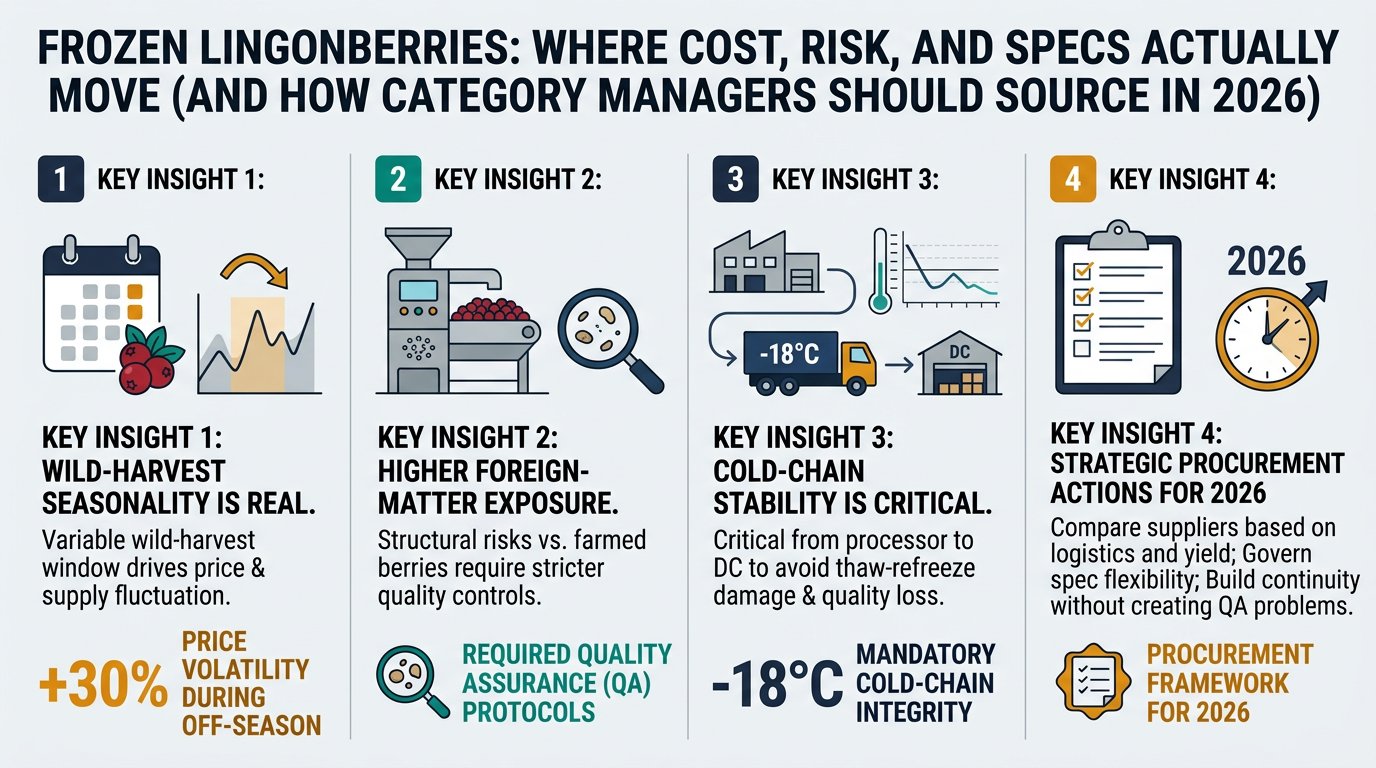
Frozen lingonberries look like a simple frozen fruit SKU, but the buying decision is really about controlling three things that drive total cost-to-serve: (1) a short, variable wild-harvest window, (2) structurally higher foreign-matter exposure vs. farmed berries, and (3) cold-chain stability from processor to your DC. This guide translates those realities into practical procurement actions—how to compare suppliers, govern spec flexibility, and build continuity without creating QA or claims problems.

Executive Summary

  • Wild-harvest seasonality is real: In Finland/Sweden-type supply, lingonberry picking typically peaks late August through September and can run into early October, which forces seasonal inventory build and allocation behavior in tight years. [1]
  • Cold-chain expectations anchor around -18°C: Quick-frozen codes of practice and standards emphasize minimizing any rise above -18°C during distribution/handling—so lane discipline and temperature evidence belong in your contracts, not just QA SOPs. [2]
  • EU trade hubs matter: For frozen berries broadly, Belgium and the Netherlands are commonly referenced as trade/re-export hubs, which affects traceability, lead times, and who actually controls processing. [3]
  • Food safety scrutiny for frozen berries is rising (class risk): FDA’s FY2019–FY2023 surveillance detected HAV and norovirus signals in frozen berries (strawberries/raspberries/blackberries), reinforcing why supplier controls, lot traceability, and verification plans matter even if lingonberries are not the specific commodity tested. [4]
  • Biggest procurement mistake: treating “IQF lingonberry” as a commodity spec. The fastest “savings” lever is often claims + rejects reduction, not just $/kg.

Key Insights

(Analyzed at: Mar, 2026)

  • Strategy: Buy
  • Reliability: Medium
  • Potential Saving: 4% ~ 10%
  • Insight: If you are contracting for the 2026/27 season, use the post-harvest window (Q4–Q1) to lock allocations with spec-anchored pricing and temperature/traceability evidence requirements. Lingonberries are typically harvested late Aug–Sep (into early Oct) in Nordic wild supply, so suppliers are building inventory and setting allocation rules soon after. Pair one premium IQF pathway with a pre-qualified industrial backup (block/blend) under governed substitution rules to reduce spot buys, claims, and expedite freight exposure. [1]

1) What You’re Actually Buying: The Ground Truth Supply Flow (and where it breaks)

A left-to-right supply chain flow diagram showing wild collection and aggregation, primary processing and freezing (wash, de-stem, optical/manual sorting, metal detection, IQF vs block decision), frozen storage and export packing (seasonal inventory build), import/re-pack/distribution via EU trade hubs (Belgium/Netherlands), and end use (retail, foodservice, industrial), with risk callouts for seasonality/allocation (late Aug–Sep into early Oct), foreign matter exposure, and cold-chain stability around -18°C.

Frozen lingonberries look like a simple SKU (IQF berry in a bag). In reality, you’re buying the outcome of a short, variable wild-harvest window, plus a foreign-matter-intensive intake stream, plus a cold-chain that must stay stable around -18°C end-to-end to preserve quality and prevent claims. [1]

The real supply chain flow (typical Nordics/Baltics/Eastern Europe → EU/UK/US buyers)

  1. Wild collection & aggregation
  2. Many small pickers/foragers deliver to buying stations.
  3. Quality variability starts here (ripeness mix, leaves/stems, stones, field debris).
  4. Primary processing & freezing (processor)
  5. Wash, de-stem, optical/manual sorting, foreign matter controls.
  6. Freeze as IQF (premium) or block (lower cost / industrial).
  7. Frozen storage & export packing
  8. Inventory is built seasonally and sold year-round; working capital is real.
  9. Import / re-pack / distribution (often via EU hubs)
  10. Belgium and the Netherlands are frequently referenced as trade and re-export hubs for frozen berries (category-wide), which can add nodes between processor and you. [3]
  11. End use
  12. Retail bags, foodservice, or industrial ingredients (bakery fillings, sauces, dairy inclusions).

Where procurement pain typically shows up

  • Spec drift: “lingonberry IQF” can still vary widely in berry size distribution, clumping, defect tolerance, and foreign vegetable matter.
  • Foreign matter & claims: wild-harvest supply chains structurally carry higher foreign matter risk; buyers pay for sorting capability and QA discipline.
  • Cold-chain variability: temperature abuse shows up as clumping, juice leakage, freezer burn, and texture loss—often discovered late (at receiving or in production). (The key is that many standards/guidance anchor quick-frozen distribution around minimizing rises above -18°C, so evidence and accountability matter.) [2]

2) Where the Money Actually Goes: Cost & Margin Build-Up by Node (IQF vs. block vs. value-added)

Key insight: In frozen lingonberries, raw berry economics and pack-out yield dominate upstream cost, while energy + cold storage + logistics + working capital dominate downstream cost. The “cheapest” quote often becomes expensive once you price in claims, yield loss, and service failures.

2.1 Upstream / Raw Material (wild berries at collection)

What’s happening

  • Wild supply is seasonal and variable; volumes can swing year-to-year.
  • Payment structures often include quality deductions (trash/foreign matter, underripe share) that affect delivered cost.

Cost drivers

  • Picker availability and competition for seasonal labor.
  • Remote collection logistics to buying stations.
  • Shrink from delayed chilling and early spoilage.

Margin reality

  • Fragmented upstream means limited bargaining power at picker level, but processors compete for volume in tight years.

2.2 Primary Processing (cleaning, sorting, freezing)

What’s happening

  • This is where suppliers differentiate: optical sorting, re-sorting loops, metal detection, foreign matter controls.
  • IQF requires tighter process control and often more sorting (premium appearance, less clumping).

Cost drivers

  • Labor for intake + rework.
  • Energy for freezing tunnels/spirals and frozen storage.
  • Yield loss: removal of leaves/stems/defects reduces sellable output.

Margin reality

  • In shortage years, processors protect margin by tightening specs or repricing IQF more aggressively than block.

2.3 Secondary processing (blends, sweetened packs, industrial prep)

What’s happening

  • Value-add can be a smart continuity lever (blend flexibility), but increases spec governance complexity.

Cost drivers

  • Additional handling (risk of temperature excursions).
  • Formulation inputs (sugar/syrup), mixing, re-freezing controls.

Margin reality

  • Value-added products carry higher margin but may reduce your functional risk if specs are clearly controlled.

2.4 Packaging & QA (where “cheap” suppliers often underinvest)

What’s happening

  • Industrial packs commonly include 10–25 kg cartons and octabins (often a few hundred kg up to ~1t depending on supplier), but pack style should be treated as a functional spec (handling, thaw profile, traceability). [5]
  • QA typically includes micro verification, residues (where applicable), and physical contamination controls.

Cost drivers

  • Packaging (cartons, liners, labeling).
  • Lab testing and lot traceability.

Margin reality

  • Under-testing doesn’t lower your true cost; it shifts cost into claims and recall exposure.

2.5 Logistics & distribution (cold chain + inventory carrying)

What’s happening

  • Frozen berries should be handled to minimize any rise above -18°C through storage and transport; this is embedded in quick-frozen handling norms/standards. [2]

Cost drivers

  • Reefer transport and cold storage.
  • Transit-time variability and port/warehouse dwell time.
  • Working capital: seasonal buy, year-round sell.

2.6 End-market margin (importer/wholesaler/retail)

What’s happening

  • Margin stacks with repack, private label compliance, and service level commitments.

Cost drivers

  • Repack labor and packaging.
  • Distributor and retail markup.

Product-level cost breakdown (illustrative ratios)

Modeled % of final delivered cost to your DC (not consumer retail price). These are directional to show where cost concentrates; actuals vary by origin, crop year, spec tightness, and lane. Use these as a negotiation framework, not as “market facts.”

Three 100% stacked bars comparing delivered cost-to-DC breakdown for IQF lingonberries, block-frozen lingonberries, and a lingonberry blend, with segments for upstream raw berries, primary processing and freezing, secondary processing (blend only), packaging and QA, cold storage and logistics, and importer/distributor margin, using the article’s illustrative ratios and noting they vary by crop year, spec, and lane.

A) IQF Lingonberries (premium retail/foodservice spec)

Supply Chain Node Cost Ratio (% of Final Cost) What moves it most
Upstream raw berries (wild collection) 35% crop size, picker costs, quality deductions
Primary processing & freezing 25% sorting intensity, energy, pack-out yield
Packaging & QA 10% testing plan, traceability, defect tolerances
Cold storage + logistics 20% reefer rates, dwell time, lane reliability
Importer/distributor margin 10% service levels, repack needs

B) Block-Frozen Lingonberries (industrial ingredient)

Supply Chain Node Cost Ratio (% of Final Cost) What moves it most
Upstream raw berries 40% raw price swings in short harvest window
Primary processing & freezing 18% less sorting vs IQF, freezing efficiency
Packaging & QA 7% simpler packs, sometimes lighter QA
Cold storage + logistics 22% same cold-chain realities still apply
Importer/distributor margin 13% consolidation, credit terms

C) Lingonberry Blend (e.g., lingonberry + blueberry/cranberry)

Supply Chain Node Cost Ratio (% of Final Cost) What moves it most
Raw fruit inputs (multiple) 30% relative pricing of component berries
Primary processing & freezing 15% component specs and yield
Secondary processing (blending/rework) 18% handling steps, clumping control
Packaging & QA 10% labeling governance, lot integrity
Cold storage + logistics 17% extra handling risk
Importer/distributor margin 10% private label requirements

3) Structural Fact You Need to Internalize: Lingonberries are a “wild-crop + processor-capacity” market

Key structural fact: Lingonberry supply behaves less like a farmed commodity and more like a wild-crop availability market. That means:

  • You can’t “plant more next quarter” to fix a shortage.
  • The real constraint in tight years is often intake + sorting capacity (how much can be cleaned and frozen fast enough), not just land availability.
  • Your continuity depends on having more than one qualified processor pathway, not just more brokers.

Implication for category managers: your leverage comes from pre-qualification, spec governance, and allocation strategy, not last-minute RFQ pressure.

4) The Critical Insight: Why Lingonberry Quotes Disconnect from Your True Cost-to-Serve

Frozen lingonberry pricing can diverge from your “expected” berry inflation because the biggest hidden drivers are:

  1. Pack-out yield (sellable IQF) vs. incoming raw volume
  2. A supplier with stronger sorting can deliver lower defect rates but may price higher.
  3. If you run a tight defect tolerance, cheaper product often becomes expensive via rejections and line stops.
  4. Foreign matter risk is a structural cost, not a one-off issue
  5. Wild-harvest intake streams naturally carry higher foreign material exposure (leaves/stems/stones). Your real lever is verifying the supplier’s process capability (sorting steps, detection, rework loops) and your own incoming inspection design.
  6. Cold-chain variance creates quality losses that look like “supplier quality problems”
  7. Temperature excursions show up as clumping and drip loss; disputes become hard because responsibility can sit anywhere from processor → forwarder → cold store → your DC.
  8. This is why quick-frozen norms emphasize maintaining product temperature around -18°C and minimizing rises above that threshold during distribution. [2]
  9. Food safety expectations are rising for frozen berries as a class
  10. FDA’s FY2019–FY2023 surveillance found HAV and norovirus detections in frozen berries tested (strawberries/raspberries/blackberries). Even though lingonberries are a different item, procurement should treat “frozen berries” as a scrutiny-prone class: require documented preventive controls, traceability, and verification testing logic aligned to your risk assessment. [4]

5) Where Procurement Teams Commonly Misfire (especially if you’re new to lingonberries)

  1. Treating “IQF lingonberry” as a commodity spec
  2. Result: false equivalence across suppliers; claims and rework spike.
  3. Over-optimizing unit price instead of delivered performance
  4. You save $/kg and then lose it on: rejects, downgrades, expedited freight, and production disruptions.
  5. Approving substitutions informally during shortages
  6. “Just take block this time” or “accept more clumps” without controlled sign-off creates audit gaps and repeat issues.
  7. Not separating supplier type (processor vs. trader vs. repacker)
  8. The party quoting you may not control intake, sorting, or freezing—yet those steps drive your risk.

6) What Intelligence-Driven Sourcing Changes (practically, week-to-week)

This is not about “more data.” It’s about making the next decision (renew/allocate/qualify/spec-change) with fewer blind spots.

A) Make suppliers comparable (so QA and Finance stop talking past each other)

Use supplier benchmarking to normalize:

  • Spec fit: defect tolerances, clump limits, foreign vegetable matter limits, berry size distribution.
  • Process controls: sorting tech, metal detection, rework loops.
  • Commercials: MOQ, lead time, allocation behavior in tight years.

Output you can actually use: a one-page comparability table that shows where “cheaper” product is likely to create downstream cost.

B) Govern spec changes instead of improvising them

Use substitution mapping + governance tracking to define:

  • What substitutions are allowed (IQF ↔ block, pack size changes, blend options).
  • Required sign-offs (QA, labeling, product).
  • Monitoring plan (incoming inspection intensity, claims threshold triggers).

C) Build a contingency bench before disruption

Use supplier discovery + risk watchlists to:

  • Longlist alternates by origin/processor type.
  • Pre-collect critical documents (traceability, audits, COAs, allergen statements).
  • Define “switch triggers” (crop shortfall signals, allocation notices, lane disruption).

7) Strategic Use Cases Category Managers Actually Run in Frozen Lingonberries

  1. Contract renewal with volatility protection (without spec compromise)
  2. Decide fixed vs indexed structure based on risk appetite.
  3. Tie price bands to clearly defined grade/spec (avoid silent downgrades).
  4. Dual-source design: one premium IQF + one industrial backup
  5. Premium supplier covers retail/visible inclusions.
  6. Backup supplier covers manufacturing where you can tolerate different pack style under controlled rules.
  7. Claims reduction program (the fastest “savings” lever in wild berries)
  8. Standardize defect taxonomy (foreign matter types, clumps, soft fruit).
  9. Track claims rate by lot/origin/lane to isolate whether issues are process- or logistics-driven.
  10. Lane-risk playbook for cold chain
  11. Define maximum dwell times, temperature recorder requirements, and rejection rules.
  12. Align Incoterms and responsibility for temperature excursions.

8) Why This Matters Beyond Lingonberries (examples you likely buy too)

The same intelligence pattern applies to other “looks-like-a-commodity” categories where spec + process controls drive true cost:

  • Frozen raspberries / strawberries (viral risk + recall exposure)
  • FDA surveillance for frozen berries found HAV and norovirus detections in tested commodities (strawberries/raspberries/blackberries), reinforcing why governance and supplier controls matter as much as price. [6]
  • Frozen blueberries (IQF quality, clumping, and size distribution)
  • Similar cold-chain and grade comparability issues; substitution without controls can break downstream performance.
  • Frozen cranberry and berry blends (functional substitution risk)
  • Blends can reduce single-berry dependency but increase labeling/spec complexity and lot integrity requirements.

The general rule: if a category has high seasonality, variable raw quality, and cold-chain dependence, procurement wins come from governed flexibility + qualified alternates, not just harder negotiation.

9) Why This Example Converts Skeptics: It Links Intelligence to Measurable Procurement Outcomes

Frozen lingonberries are a strong “proof category” because outcomes are visible quickly:

Cost outcomes (TCO)

  • Lower net cost after claims, rejects, and expedited freight.
  • Reduced price volatility impact via better contract timing and allocation strategy.

Service outcomes

  • Higher OTIF and fewer stockouts through pre-qualified backups.
  • Less emergency buying at spot premiums.

Quality & governance outcomes

  • Lower claims rate and clearer root-cause attribution (supplier vs lane vs handling).
  • Audit-ready approval trails for spec changes and substitutions.

Metrics to run your category like a controlled system

  • Claims rate: claims per 100 MT; $ value per MT
  • Reject / hold rate: % lots held for inspection; % rejected
  • Foreign matter incidents: count by type (leaf/stem/stone/metal)
  • OTIF: on-time, in-full by supplier and lane
  • Temperature excursion rate: % shipments with recorder breaches
  • Cost variance: vs contract baseline, separated into raw, processing, logistics components (where you can)

If you can’t measure at least claims + OTIF + hold rate by supplier, you’re negotiating blind—especially in wild-harvest berries.

Take Your Sourcing Intelligence to the Next Level

The insights in this report are just the starting point. Tridge Eye gives you real-time market signals, origin risk alerts, and price benchmarks — so you can act before the market moves.

Explore Tridge Eye →

References

  1. arktisetaromit.fi
  2. fao.org
  3. cbi.eu
  4. fda.gov (FY2019–FY2023 frozen berries surveillance)
  5. philmat.pl
  6. fda.gov (download)
Subscribe
By subscribing you agree to with our Privacy Policy and provide consent to receive updates from our company.
Thank you! Your submission has been received!
Oops! Something went wrong while submitting the form.
Subscribe to receive the latest blog posts, updates, promotions, and announcements from Tridge.