INDUSTRY TRENDS

Frozen Grape Sourcing (2026 Guide): The Cost, Risk, and Control Points Category Teams Commonly Miss

Author
Team Tridge
DATE
March 9, 2026
8 min read
frozen-grape Cover
Tridge — Trusted Global Food Sourcing

This report is powered by Tridge market intelligence.

Every data point, price signal, and supply chain insight in this analysis is drawn from the same engine that procurement teams worldwide rely on daily. As you read, consider what this level of visibility could do for your category.

See how Tridge Eye works →

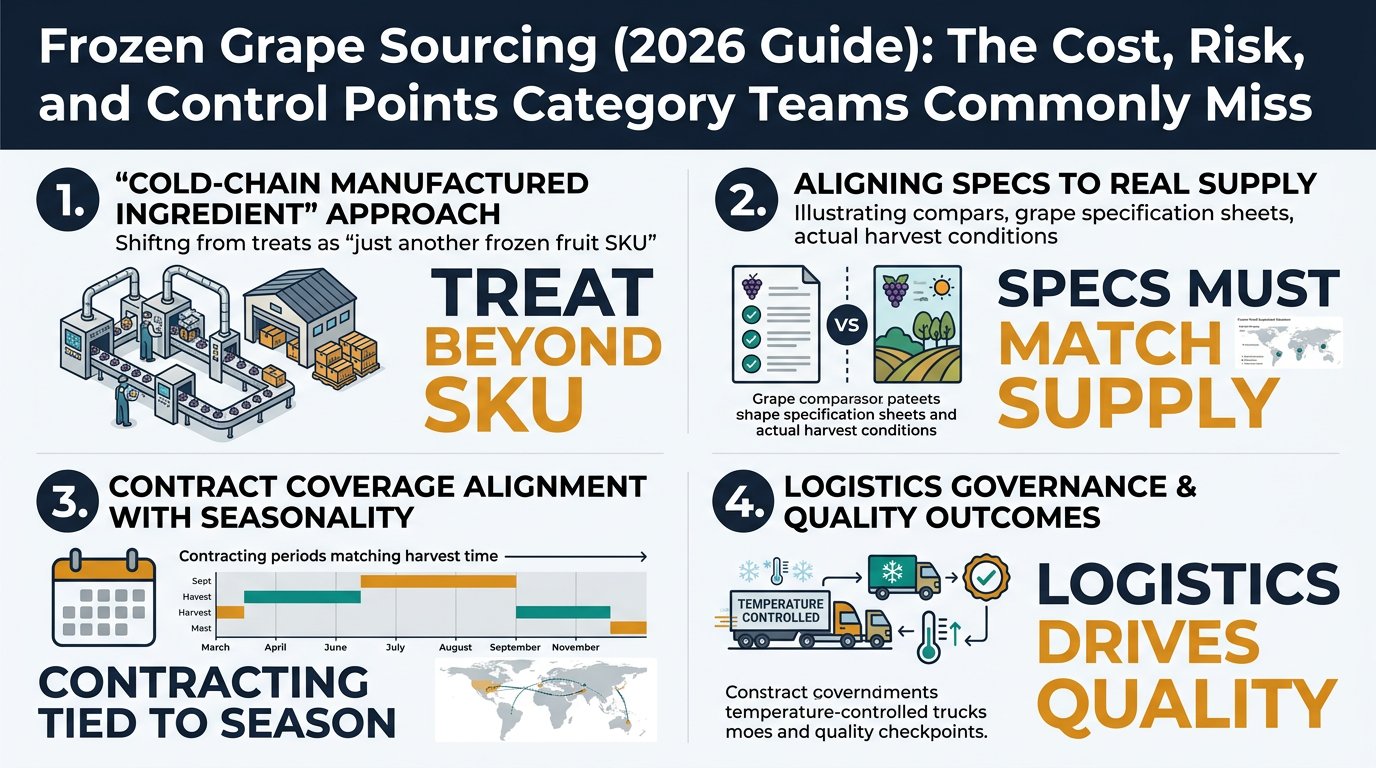
Frozen grapes are easy to treat like “just another frozen fruit SKU,” but buyers who win this category manage it more like a cold-chain manufactured ingredient: they align specs to real supply, contract coverage to seasonality, and logistics governance to quality outcomes. This guide translates frozen-grape supply chain mechanics into the procurement decisions you actually own—supplier portfolio design, contracting/coverage, spec governance, lane strategy, and contingency planning.

Executive Summary

  • Frozen is built at harvest, sold all year: availability and pricing are heavily influenced by inventory positions and freezer capacity, not just spot fruit.
  • Cold chain is a quality spec: many industry and procurement standards reference ≤ -18°C (0°F) for frozen product handling/storage; excursions often show up later as texture/clumping/drip-loss claims. [1]
  • Food safety governance is non-optional: FDA has documented outbreaks tied to frozen fruit (not grapes every time, but the category exposure is real), increasing documentation, supplier controls, and traceability expectations. [2]
  • Quotes aren’t comparable without a driver view: raw grapes (linked to fresh table-grape economics), energy/freezing throughput, packaging, and reefer lanes can move in different directions—so a “cheaper” quote can be higher total cost-to-serve.
  • Spec tightness is a commercial lever: tighter berry-size/defect tolerances shrink the supplier pool and can force spot buys; spec-flex options (pre-agreed) are a resilience tool.

Key Insights (Analyzed at: Mar, 2026)

  • Strategy: Hold
  • Reliability: Medium
  • Potential Saving: 6% ~ 12%
  • Insight: Treat frozen grapes as a coverage-and-lane governed category, not a once-a-year bid. For 2026 contracting, prioritize (1) 70–90% coverage on your top-volume SKUs before peak demand periods, (2) a pre-approved spec-flex matrix (berry size band + allowable cultivar list + pack fallback), and (3) lane-level cold-chain controls (temperature evidence, claims workflow). This typically reduces expediting, credits, and emergency spot buys enough to deliver mid–single-digit to low–double-digit savings, even when unit prices don’t move.

1) What you’re really buying: the frozen-grape flow (ground truth)

Frozen grapes look like a simple commodity, but the supply chain behaves like a cold-chain manufactured ingredient with a farm input.

End-to-end flow (what physically happens):

  1. Upstream fruit supply
  2. Mostly seedless table grapes for whole IQF (retail/foodservice).
  3. Off-grade/diverted fruit from fresh packing is a common feedstock (especially when cosmetic specs fail), but diversion availability can tighten quickly when fresh demand/prices are strong (important for your risk model).
  4. Primary processing (pre-freeze)
  5. Destem → wash/sanitize → sort defects (rot/mold/split berries) → pre-cool.
  6. This is where defect rates and stem/foreign material control are “baked in.”
  7. Secondary processing (freezing / manufacturing)
  8. IQF whole grapes (often fluidized-bed or tunnel freezing), or halves/slices, or puree for industrial users.
  9. Energy intensity is high; throughput depends on freezer capacity and pre-cooling discipline.
  10. Packaging & QA release
  11. Retail bags or bulk lined cartons; foreign material programs (e.g., metal detection where applicable), residue and micro testing.
  12. Frozen logistics & distribution
  13. Continuous frozen chain to protect texture and prevent clumping/drip loss.
  14. Typical buyer expectation: product at ≤ -18°C (0°F); many cold-chain handling/storage references treat this as a key threshold for frozen foods. [1]
A left-to-right process flow showing the physical frozen grapes journey from upstream fruit supply through primary processing, secondary IQF freezing, packaging and QA release, frozen logistics, and buyer DC/customer, with callouts for spec governance, cold-chain setpoint ≤ -18°C / 0°F, and claims workflow/temperature evidence.

Why this matters for category teams:

  • Frozen grapes are inventory-heavy (built at harvest, sold over months). Your “price” is often a function of who owns inventory risk and who controls cold-chain execution, not just farmgate fruit.
  • Your spec (brix/size/cultivar/defects) directly controls yield loss in sorting and supplier eligibility—often more than buyers expect.

2) Where margin is made or lost: cost build-up by node (and why quotes aren’t comparable)

Below is a practical cost-and-margin view you can use to sanity-check supplier quotes and to frame negotiations around real drivers.

2.1 Upstream / Raw grapes (farm + diversion economics)

Key insight: Frozen-grape input cost is anchored to the fresh table grape market more than most buyers model.

What drives cost here:

  • Fresh market pull: when fresh export demand is strong, processors pay more (or get less volume diverted).
  • Yield and defect variability: rain near harvest and fungal pressure (e.g., Botrytis) increase sorting losses and reduce usable volume—raising effective cost per finished kg. Botrytis can materially impact yield and quality when conditions favor the disease. [3]
  • Variety/cultivar effects: seedless varieties with better freezing texture command premiums; tight berry size specs reduce usable supply.

Procurement implication:

  • A “low” raw fruit quote can be a red flag if it assumes high diversion availability that disappears when fresh prices rise.

2.2 Primary processing (destem/wash/sort/pre-cool)

Key insight: This node determines your true yield and your foreign material/defect risk.

Cost drivers:

  • Sorting labor and equipment time (defect removal, stem control)
  • Water, sanitation chemistry, wastewater handling
  • Pre-cooling capacity (protects texture; reduces downstream clumping risk)

Where margin hides:

  • Suppliers with stronger inbound QC can quote lower—but may be passing risk back through higher defect allowances or weaker claim responsiveness.

2.3 Secondary processing (IQF freezing / manufacturing)

Key insight: Frozen grapes are not “just frozen fruit”—they’re a throughput-constrained, energy-intensive manufactured output.

Cost drivers:

  • Electricity and refrigeration load (freezers + cold rooms)
  • Capacity utilization (freezer hours are the bottleneck in tight seasons)
  • Breakage and dehydration losses

Procurement implication:

When energy costs spike or capacity tightens, suppliers protect margin by:

  • pushing longer lead times,
  • restricting pack formats,
  • or repricing mid-season.

2.4 Packaging & QA release

Key insight: Packaging is often the second-largest controllable cost after raw fruit for retail formats.

Cost drivers:

  • Freezer-grade film/bags, lined cartons, labels
  • QA testing cadence (residue, micro, foreign material verification)
  • Documentation burden (spec sheets, COAs, traceability)

Procurement implication:

  • Pack-size decisions change total cost-to-serve: retail-ready packs reduce your internal labor but increase supplier packaging cost and MOQ constraints.

2.5 Frozen logistics & distribution (cold chain)

Key insight: Logistics is where “cheap product” becomes expensive through temperature risk, demurrage, and inventory carrying cost.

Cost drivers:

  • Reefer ocean freight + inland refrigerated trucking
  • Cold storage at origin and destination
  • Temperature monitoring and claims handling

Control point:

  • Many cold-chain references treat -18°C (0°F) as the key frozen threshold; operationally, reefers are designed to maintain temperature, not rapidly pull down warm product—so pre-cooling and load discipline matter. [1]

2.6 End-market margins (importer/distributor/retail or ingredient channel)

Key insight: The downstream margin stack is strongly influenced by who holds:

  • inventory,
  • quality-claim risk,
  • and service-level penalties.
A grouped stacked bar chart comparing delivered cost-to-serve breakdown across three formats (retail IQF whole grapes, bulk IQF whole grapes, and frozen grape puree), segmented by raw grapes, primary processing, secondary processing, packaging and QA, and logistics and cold storage, with annotations highlighting key movers by format.

Product-level cost breakdown (illustrative)

Modeled % of final delivered cost to your DC (not shelf price). Ratios vary by origin, pack format, contract terms, and freight market.

A) IQF Whole Grapes (Retail bag program)

Supply chain node Cost ratio (% of delivered cost) What moves it most
Raw grapes 35% fresh market pull; defect/yield variability
Primary processing 12% sorting intensity; stem/defect removal
Secondary processing (IQF) 18% energy; freezer capacity utilization
Packaging & QA 15% film/carton costs; testing cadence
Logistics & cold storage 20% reefer rates; cold-store days; demurrage

B) IQF Whole Grapes (Bulk 10–20 kg lined cartons, ingredient/foodservice)

Supply chain node Cost ratio (% of delivered cost) What moves it most
Raw grapes 40% fruit price and diversion availability
Primary processing 14% defect rate; sorting yield
Secondary processing (IQF) 20% energy and throughput
Packaging & QA 6% liners/cartons; fewer retail materials
Logistics & cold storage 20% lane selection; cold-store time

C) Frozen Grape Puree (industrial)

Supply chain node Cost ratio (% of delivered cost) What moves it most
Raw grapes 30% ability to use lower-grade fruit
Primary processing 10% wash/sort requirements
Secondary processing (crush/pasteurize/freeze) 25% energy + processing inputs
Packaging & QA (pails/drums) 10% packaging spec; aseptic/frozen handling
Logistics & cold storage 25% weight/handling; cold-store dwell

3) Structural facts that govern the category (the “rules of the game”)

  1. Frozen grapes are made at harvest, sold all year: pricing and availability reflect inventory positions and freezer capacity more than spot fruit.
  2. Spec tightness shrinks your supplier pool: brix/berry size uniformity/defect tolerances determine who can bid.
  3. Cold-chain is a quality spec, not just logistics: temperature excursions show up later as clumping, drip loss, and texture complaints.
  4. Food safety scrutiny is real for frozen fruit: frozen fruit has been implicated in outbreaks/recalls (not grapes specifically every time, but the category is exposed), increasing documentation and supplier-governance expectations. [2]

4) The critical insight: why farm signals and frozen prices disconnect

Frozen-grape pricing often lags farm conditions—until it doesn’t.

Mechanics behind the disconnect:

  • Processors buy fruit and build frozen inventory during harvest.
  • Buyers see stable quotes until inventory tightness becomes visible.
  • When a short crop or quality issue hits (e.g., higher defect rates from weather/disease), the market can shift quickly because:
  • usable IQF-grade volume is lower,
  • freezer capacity is already booked,
  • and switching origins/varieties is constrained by spec and labeling.

What to watch (practical triggers):

  • Rising defect/yield complaints from multiple suppliers (sorting loss up)
  • Longer lead times or reduced format availability (capacity tight)
  • Freight/cold-store congestion on key lanes (service risk)

5) Where procurement teams typically get it wrong (and why)

  1. They treat frozen grapes like a simple commodity bid
  2. Result: lowest unit price wins, but total cost-to-serve rises via claims, expedites, and service failures.
  3. They over-spec early and then scramble for supply
  4. Tight berry size + tight defect tolerances can eliminate otherwise viable suppliers.
  5. They don’t separate “supplier price” from “category inflation”
  6. Without cost-driver decomposition, negotiations become opinion-based.
  7. They qualify backups on paper, not in formats/lane reality
  8. Backup fails because it can’t hit pack format, documentation, or lead time.

6) How an intelligence-driven service changes the outcome (without pretending to replace QA)

Below are two high-leverage capability pairings that map to real buyer decisions.

6.1 Decision: “Do we lock coverage now, or wait?”

Use capabilities:

  • Price intelligence & cost drivers (separate fruit vs. energy vs. packaging vs. freight)
  • Origin seasonality & capacity signals (harvest timing, tightness indicators)

How decisions shift:

  • You set a coverage target by SKU (e.g., 70–90% contracted) and define triggers for topping up.
  • You negotiate using a driver-based discussion (e.g., packaging index changes, freight lane shifts) rather than blanket % asks.

What it cannot do:

  • It won’t guarantee future prices; it improves timing and leverage by clarifying which drivers are moving.

6.2 Decision: “Can we dual-source without breaking the spec?”

Use capabilities:

  • Supplier discovery & shortlisting (format/certification/capability fit)
  • Alternative supplier & substitution mapping (spec-flex scenarios)

How decisions shift:

  • You build a bench of 2–3 alternates per critical SKU and pre-agree spec-flex options (e.g., berry size band, allowable cultivar list, pack-size fallback).
  • You reduce time-to-switch during disruption and improve OTIF resilience.

What it cannot do:

  • It does not replace audits, sensory validation, or pilot orders.

7) Strategic use cases category leaders actually fund

  1. Reduce cost volatility without sacrificing fill rate
  2. KPI targets: unit cost vs budget, MoM variance, contract coverage %, OTIF.
  3. Build a resilient supplier portfolio by format (not just by name)
  4. KPI targets: top-1/top-3 concentration, qualified backup count per SKU, lead time variability.
  5. Spec governance that expands supply (without quality drift)
  6. KPI targets: claim rate, credit value, rejection rate, spec exceptions tracked.
  7. Lane risk heatmap for frozen logistics
  8. KPI targets: temperature excursion incidents, demurrage exposure, on-time delivery by lane.

8) Why this matters beyond frozen grapes (adjacent categories you likely manage)

Frozen grapes behave like other categories where processing capacity + cold chain + specs create hidden constraints:

  • Frozen berries: similar IQF capacity bottlenecks and food-safety scrutiny; documented outbreak investigations in frozen fruit reinforce governance expectations. [4]
  • Frozen mango/pineapple: pack format and cutting yield drive cost; substitution is limited by texture and brix specs.
  • Seafood (frozen): temperature setpoints, reefer performance, and lane discipline determine claims and quality—similar cold-chain control logic applies.

The transferable lesson: category performance is a system outcome, not a unit-price outcome.

9) Why this frozen-grape example is powerful for prospective customers

Frozen grapes compress multiple procurement challenges into one category:

  • Agricultural volatility (yield/quality swings)
  • Manufacturing constraints (freezer throughput and energy exposure)
  • High cost-to-serve sensitivity (cold storage, reefer lanes)
  • Spec-governed substitutability (tight specs reduce optionality)
  • Governance pressure (traceability and frozen-fruit safety expectations) [4]

If you can run frozen grapes with driver-based pricing, lane-aware service control, and spec-flex governance, you can typically apply the same operating model across a broad set of frozen and refrigerated categories.

Take Your Sourcing Intelligence to the Next Level

The insights in this report are just the starting point. Tridge Eye gives you real-time market signals, origin risk alerts, and price benchmarks — so you can act before the market moves.

Explore Tridge Eye →

References

  1. gcca.org
  2. fda.gov (Outbreak Investigation: Hepatitis A Virus Infections: Frozen Strawberries - February 2023)
  3. fas.usda.gov
  4. fda.gov (FDA Strategy Summary: Prevent Norovirus and Hepatitis Outbreaks Associated with Fresh and Frozen)
Subscribe
By subscribing you agree to with our Privacy Policy and provide consent to receive updates from our company.
Thank you! Your submission has been received!
Oops! Something went wrong while submitting the form.
Subscribe to receive the latest blog posts, updates, promotions, and announcements from Tridge.