INDUSTRY TRENDS

Frozen Dates Sourcing (2026 Guide): Landed Cost, Cold-Chain Risk, and Supplier Portfolio Strategy

Author
Team Tridge
DATE
March 25, 2026
10 min read
frozen-date Cover
Tridge Eye Data Intelligence Solution

This report is powered by Tridge Eye Data Intelligence.

Every data point, price signal, and supply risk insight in this analysis comes from the same platform that procurement and sourcing leaders worldwide rely on daily. As you read, consider what this level of market intelligence could do for your sourcing decisions.

Explore Tridge Eye →

Procurement teams don’t win frozen-date sourcing by “beating up unit price.” They win by controlling two variables that create most surprises: usable yield (defects, pit fragments, moisture/texture) and cold-chain integrity (temperature stability from plant to your dock). This guide translates those realities into procurement artifacts—spec sheets, scorecards, portfolio splits, and contract clauses—so you can reduce landed-cost variance, shorten disruption response time, and make supplier awards more defensible with QA/Ops/Finance.

Executive Summary

  • Category physics: Frozen dates are a yield + cold-chain category; the right KPI is typically $ per usable kg plus OTIF/claims.
  • Cold-chain standard: Frozen foods are commonly handled at 0°F / -18°C or colder across storage/transport; write excursion handling and evidence requirements into contracts [1].
  • Reefer reality: Reefers are designed to maintain set temperature—not to rapidly cool warm product—so pre-cooling and loading discipline are procurement-relevant controls [2].
  • Seasonality risk window: Date demand often spikes around Ramadan, and many markets stockpile weeks ahead; expect tighter availability and lane volatility if you buy close to the peak [3].
  • Cost structure sanity check: The illustrative cost tables are directionally plausible, but node ranges can sum >100% when you pick the high end of each range—treat them as independent ranges, not a single simultaneous scenario.

Key Insights

(Analyzed at: Mar, 2026)

  • Strategy: Hold
  • Reliability: Medium
  • Potential Saving: 4% ~ 9%
  • Insight: In March 2026, the best “sure” savings lever is usually not re-bidding on headline price; it’s tightening governance on (a) usable-yield definitions (defect/pit-fragment/moisture specs + how rejects are measured), and (b) cold-chain evidence (data logger expectations + excursion workflow). These two controls reduce claims, rework, and expedite events—often the largest avoidable variance drivers in frozen-date landed cost [1]. Maintain current sourcing posture unless you have (i) >60–70% concentration in one supplier/origin/lane or (ii) repeated temperature/quality holds; in those cases, shift to a planned dual-source portfolio and pull forward qualification before the next seasonal demand peak.

1) What you’re really buying: the frozen-date supply chain, end-to-end (ground truth)

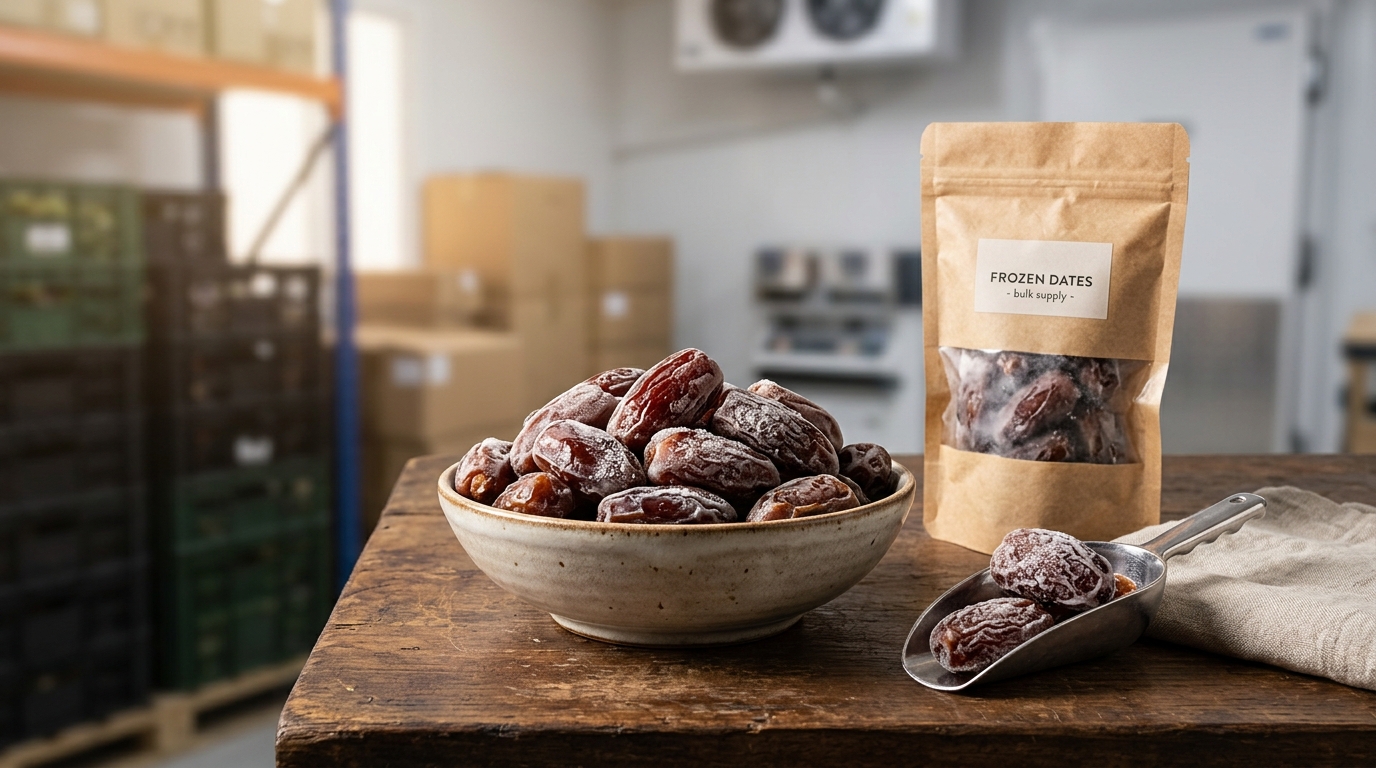
Frozen dates are not “just another dried fruit.” They sit between a highly seasonal orchard crop and a cold-chain-dependent ingredient. That means procurement outcomes are driven as much by pack-out yield, processing capability, and cold-chain discipline as by farmgate price.

Typical frozen-date flow (what happens in reality):

  1. Upstream / Raw dates (orchard + harvest)
  2. Dates are harvested seasonally; timing varies by origin and variety. Many producing regions harvest in a late-summer to autumn window (often Aug–Nov in multiple producing countries), and packers smooth supply with storage/freezing [4].
  3. Primary processing (cleaning, sorting, grading, moisture conditioning/cure)
  4. This is where usable yield is made or lost: defect removal, size grading, insect/mold management, and moisture control.
  5. Secondary processing (pitting/dicing/paste + freezing)
  6. Frozen formats include IQF whole, IQF pitted, diced, paste/pulp, and blocks.
  7. Freezing is energy-intensive and capacity-constrained (tunnels/IQF lines), so it behaves like a “manufacturing bottleneck.”
  8. Packaging & QA (food safety + defect controls)
  9. Frozen dates for industrial use typically require tight foreign-material controls, pit-fragment controls (pitted SKUs), and stable moisture/texture.
  10. Logistics & distribution (reefer + cold storage)
  11. Frozen foods are commonly handled at 0°F / -18°C or colder across storage and delivery [1].
  12. The reefer’s job is to maintain temperature; it is not a blast freezer—so pre-cooling and disciplined loading matter [2].

Frozen-date-specific constraints and risks (what trips buyers up):

  • Pack-out yield risk: small shifts in defect rate or moisture translate into big swings in usable yield and claims.
  • Cold-chain integrity risk: temperature excursions can create texture breakdown, condensation issues, and downstream rejects.
  • Capacity & allocation risk: pitting/IQF/freezing capacity is not unlimited; peak demand windows tighten availability.
  • Spec ambiguity risk: “dates” can mean different varieties, moisture ranges, pitting tolerances, and pack formats—making quotes non-comparable.
A left-to-right (or top-to-bottom) process flow showing the typical frozen-date journey with clearly labeled stages: (1) Orchard/Harvest (seasonal crop) → (2) Primary Processing (cleaning/sorting/grading/moisture conditioning; highlight 'Yield Gate') → (3) Secondary Processing (pitting/dicing/paste + IQF/block freezing; highlight 'Capacity Bottleneck') → (4) Packaging & QA (foreign material + pit-fragment controls; certifications callout) → (5) Cold-Chain Logistics (reefer + cold storage; highlight '0°F / -18°C set point' and 'excursion risk') → (6) Importer/Distributor/Buyer Dock, with overlays for 'Usable Yield' risk at primary and secondary processing and 'Cold-Chain Integrity' risk from post-freeze through delivery, using procurement-friendly icons and callouts for pit fragments, moisture/texture, and temperature excursions.

2) Where the money really goes: cost & margin by node (and why unit price lies)

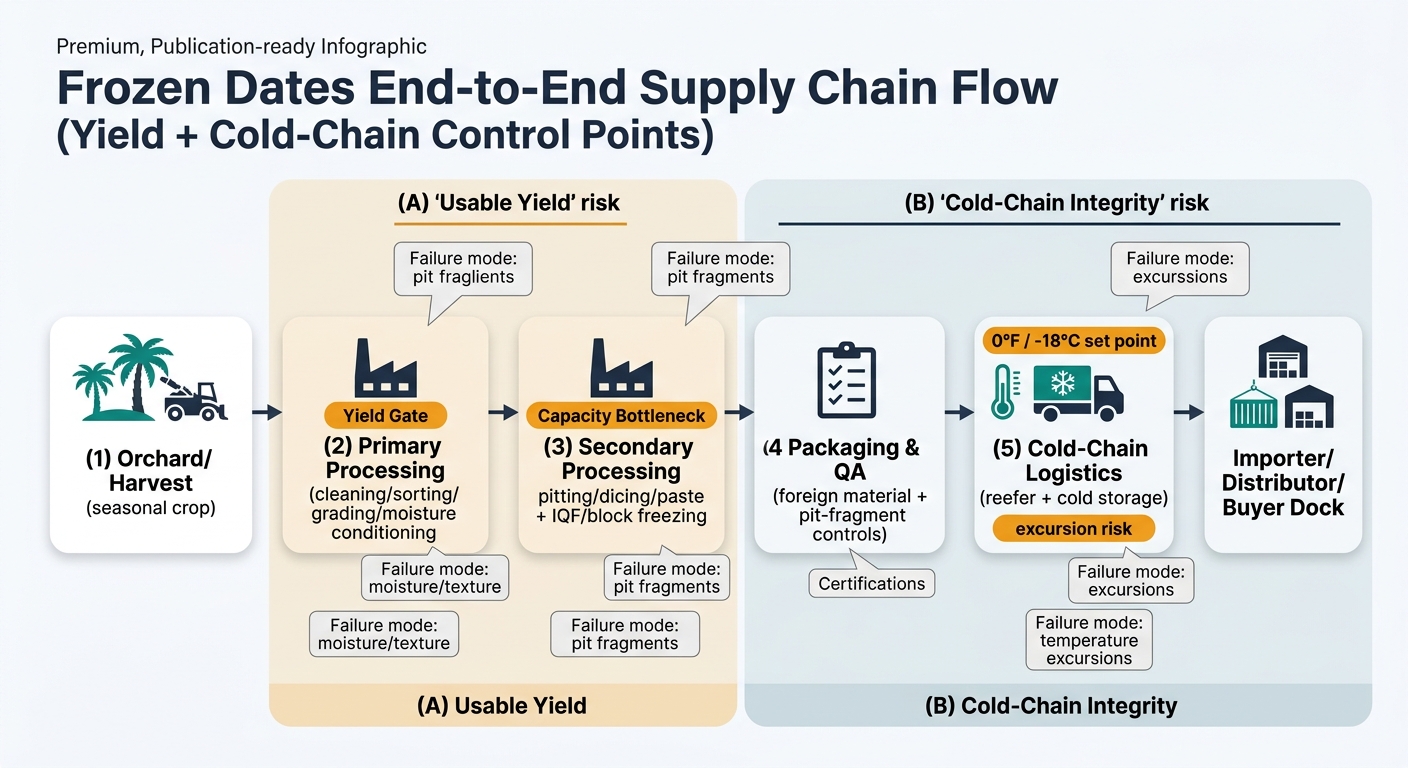
Key insight: In frozen dates, the biggest procurement mistake is treating quotes as if they reflect only raw material. In practice, sorting losses + processing + cold chain can be the difference between a stable contract and a year of claims/expedites.

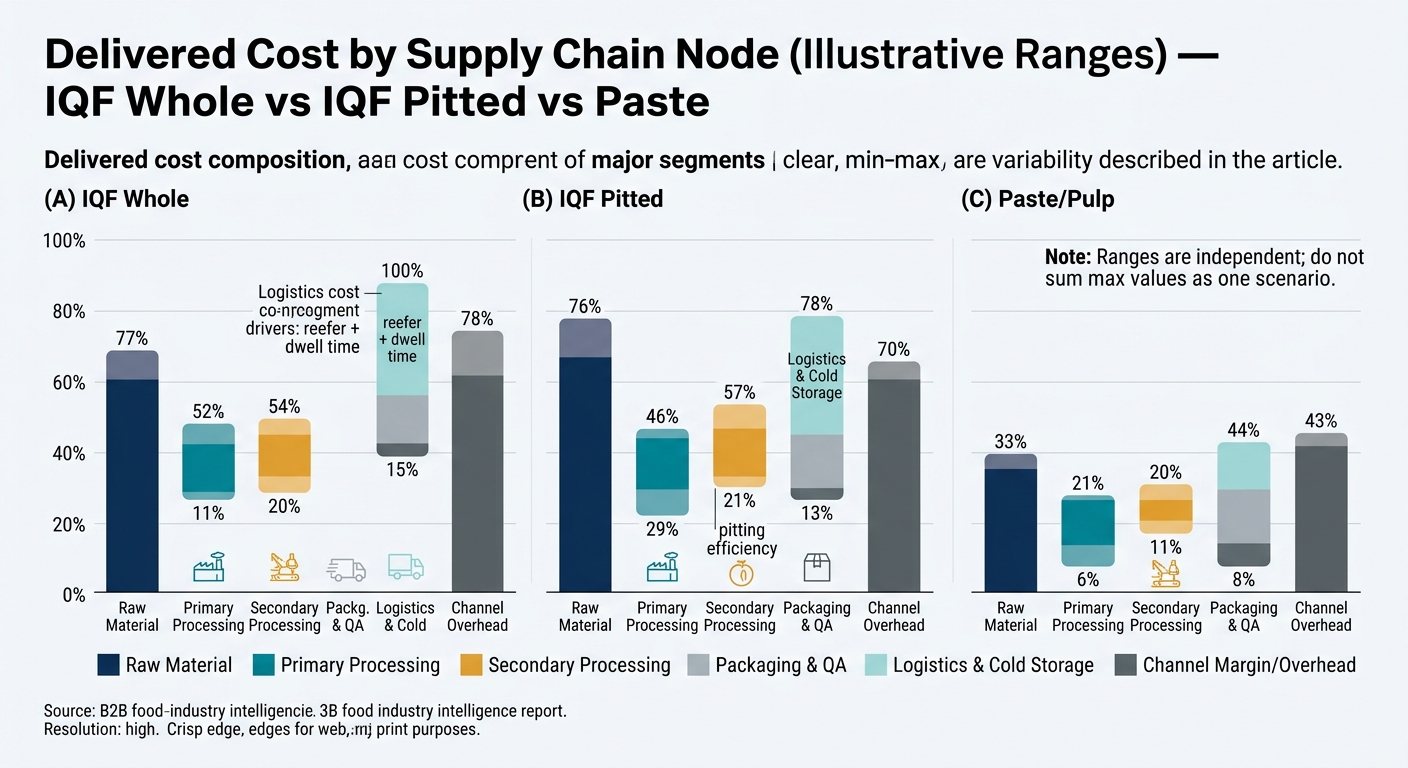
Below is a practical cost-and-margin walkthrough by node. Percentages are illustrative ranges to show where cost concentrates; actuals vary by origin, spec tightness, certifications, and Incoterms.

2.1 Upstream / Raw material (orchard + harvest)

What’s happening

  • Seasonal harvest and variable fruit quality drive the initial cost baseline.
  • Heat/water stress can reduce size and increase defects; defects amplify downstream sorting losses.

Cost drivers you’ll see in quotes (directly or indirectly)

  • Harvest labor and orchard inputs
  • Farmgate price swings after harvest assessments

Procurement implication

  • If you buy tight specs (size, moisture, low defects), you are effectively buying a higher pack-out—and you should expect a premium.

2.2 Primary processing (cleaning, sorting, grading, moisture conditioning)

What’s happening

  • This is the “yield gate.” Defect removal (insects, mold, fermentation, skin separation) determines how much becomes usable input.

Cost drivers

  • Sorting/grading labor and equipment
  • Yield loss (rejects) that must be recovered in price

Procurement implication

  • Two suppliers can quote the same price but deliver different effective cost per usable kg due to yield and defect performance.

2.3 Secondary processing (pitting/dicing/paste + freezing)

What’s happening

  • Value-add steps (pitting/dicing/paste) plus freezing (IQF or block) introduce energy, throughput, and QA complexity.

Cost drivers

  • Pitting/dicing line efficiency and pit-fragment control
  • Energy for freezing + throughput constraints
  • Rework and scrap if texture/moisture is inconsistent

Procurement implication

  • Product form changes your cost structure:
  • IQF usually commands a premium for piece separation and handling advantages.
  • Paste/blocks can be cheaper per kg but may create dosing/handling constraints for operations.

2.4 Packaging & QA

What’s happening

  • Frozen packaging must protect against moisture migration/freezer burn and survive cold-chain handling.

Cost drivers

  • Barrier liners/films, cartons, labeling
  • QA testing (micro, foreign material), metal detection/X-ray
  • Certifications: many industrial buyers expect a GFSI-recognized scheme (e.g., BRCGS, FSSC 22000) as a baseline for processed food suppliers.

Procurement implication

  • Packaging and QA are where suppliers can preserve margin when raw material prices soften (downward stickiness).

2.5 Logistics & distribution (reefer ocean/truck + cold storage)

What’s happening

  • Frozen dates behave like frozen fruit: you’re paying for temperature stability and time.

Cost drivers

  • Reefer container availability, plug/electricity, port dwell time
  • Destination cold storage and accessorials
  • Temperature monitoring and claims handling

Procurement implication

  • Incoterms matter more than usual. A cheap FOB can become expensive if you absorb cold storage demurrage risk.

2.6 Wholesale/Importer + buyer-side overhead

What’s happening

  • Importers/distributors add margin for financing inventory and carrying cold storage risk.

Cost drivers

  • Working capital (frozen inventory turns slower than shelf-stable)
  • Service level commitments (OTIF, safety stock)

Procurement implication

  • If you need short lead times, you are often paying someone to hold inventory risk.

Product-level cost breakdown (illustrative)

Modeled to show relative cost concentration by product form. Use this as a negotiation and should-cost structure, not as a price forecast.

A comparative visualization of delivered cost composition across three product forms: (A) IQF Whole, (B) IQF Pitted, (C) Paste/Pulp, shown as three stacked bars with consistent node colors (Raw Material, Primary Processing, Secondary Processing, Packaging & QA, Logistics & Cold Storage, Channel Margin/Overhead). Each segment is depicted as a min–max band to reflect percent ranges, with a note that ranges are independent and should not be summed at max as one scenario, plus short annotations for key drivers like reefer + dwell time and pitting efficiency.

How to use these tables correctly (important):

  • The ranges below are node-by-node plausible bands.
  • Do not add the maximum of every row and expect a single “max scenario.” For a single scenario, set a point estimate per row so totals equal 100%.

A) IQF Frozen Whole Dates

Supply Chain Node Cost Ratio (% of delivered cost) What moves it most
Raw material 35–50% crop quality, variety, size/defect spec
Primary processing 10–18% sorting intensity, yield loss
Secondary processing (freezing) 12–20% energy, tunnel/IQF capacity
Packaging & QA 6–10% barrier materials, foreign-material controls
Logistics & cold storage 12–22% reefer rates, port dwell, cold storage
Channel margin/overhead 8–15% inventory carry, service level

B) IQF Frozen Pitted Dates

Supply Chain Node Cost Ratio (% of delivered cost) What moves it most
Raw material 30–45% pack-out and pitting suitability
Primary processing 10–18% defect removal, moisture conditioning
Secondary processing (pitting + freezing) 18–28% pitting efficiency, pit-fragment rejects
Packaging & QA 6–12% pit-fragment controls, QA testing
Logistics & cold storage 10–20% reefer/cold storage volatility
Channel margin/overhead 8–15% inventory financing

C) Frozen Date Paste / Pulp (cartons or pails)

Supply Chain Node Cost Ratio (% of delivered cost) What moves it most
Raw material 25–40% input grade, sweetness/moisture targets
Primary processing 8–15% cleaning, defect removal
Secondary processing (milling/blending + freezing) 20–35% throughput, energy, formulation consistency
Packaging & QA 6–12% pails/cartons, micro specs
Logistics & cold storage 10–18% reefer + destination storage
Channel margin/overhead 8–15% service model

3) The structural fact you must design around: frozen dates are a “yield + cold-chain” category

Key structural fact: Your true cost is driven by effective yield delivered to your line and temperature stability, not by the supplier’s ex-works price.

What this means in procurement terms:

  • The right KPI is often “$ per usable kg” (after rejects, trim loss, pit fragments, and QA holds), plus OTIF and claims rate.
  • A supplier with a slightly higher unit price but tighter process control can reduce total cost by lowering:
  • QA holds
  • rework
  • expedited freight
  • production downtime

Operational constraint to acknowledge

Many buyers cannot “flex” specs quickly because QA approvals and customer labels lock parameters (moisture, cut size, variety claims, organic/halal).

4) The critical insight: why raw-date prices and frozen-date prices disconnect

Critical insight: Frozen-date pricing can lag or diverge from raw-date market moves because processing capacity, energy, and cold-chain costs behave like separate markets.

Common disconnect mechanisms

  • Inventory smoothing: Freezing enables suppliers to carry inventory; contracts may be priced off earlier buys, delaying pass-through.
  • Pack-out amplification: In a tight crop year, defect rates rise → usable yield drops → processed frozen SKUs inflate more than raw material.
  • Energy and cold storage shocks: Even if farmgate softens, freezing and cold storage costs can keep delivered prices elevated.
  • Logistics volatility: Reefer availability and port dwell can swing landed cost independently of raw input.

So the buyer decision is not “is the crop up or down?” It’s “what’s happening to yield + freezing + reefer lanes + inventory positions?”

5) Where procurement teams typically misstep (and how it shows up later)

Procurement teams coming from shelf-stable categories often make predictable errors:

  1. RFQ compares non-comparable specs
  2. “Pitted frozen dates” without pit-fragment tolerance, moisture range, piece size distribution, or thaw performance.
  3. Supplier approval is treated as a checkbox
  4. But frozen dates need validated cold-chain SOPs, excursion handling, and robust foreign-material controls.
  5. Single-source bias due to qualification friction
  6. Switching costs (QA approval, trials, label updates) push teams into over-dependence.
  7. Incoterms and lane risk ignored
  8. A cheap quote becomes expensive when buyer absorbs demurrage/cold storage/temperature excursion risk.

Downstream symptoms

  • Rising claims, inbound holds, and OTIF misses
  • Emergency spot buys at premiums
  • Stakeholder escalations (QA and Ops lose confidence in procurement awards)

6) What an intelligence-driven approach changes (without pretending it eliminates risk)

Buyer decision (one sentence): “How do I award and contract frozen dates so I reduce landed-cost variance and disruption exposure while staying within QA and operational constraints?”

Frozen-date constraints to keep in view (2–4)

  • Frozen foods are typically specified/handled at -18°C (0°F) or colder; define what counts as an excursion and what evidence is required [1].
  • Specs drive supplier pool size (tight specs reduce alternates).
  • Processing capacity (pitting/IQF) can be the real bottleneck.
  • Seasonal demand peaks (often around Ramadan in many markets) can tighten availability and logistics; many supply chains stockpile weeks ahead [3].

The 2 service capabilities that matter most here

  1. Supplier benchmarking & scorecards
  2. Compare suppliers on what predicts total cost: lead time variance, claims rate, cold-chain controls, certifications, and actual spec conformance.
  3. Supply-risk monitoring + constrained alternative identification
  4. Monitor origin/lane risk signals and keep a “real” bench of alternates that are spec-fit and pre-qualified (not a broker list).

Practical decision path (steps + artifacts)

  1. Lock the spec in procurement language (so quotes are comparable)
  2. Artifact: Frozen-date spec sheet with must-haves:
  3. form (IQF whole / IQF pitted / diced / paste / blocks)
  4. variety (if required), moisture range, size/cut distribution
  5. pit-fragment tolerance (pitted), foreign-material limits
  6. packaging (liner/barrier), pallet pattern, labeling
  7. cold-chain requirements (set point, data logger expectations)
  8. Build a scorecard that reflects total cost and resilience
  9. Artifact: Supplier scorecard (weighting example):
  10. Quality/food safety (GFSI scheme, CAPA discipline)
  11. Cold-chain capability (trip reports, excursion policy)
  12. Service (OTIF, lead time variance, MOQ flexibility)
  13. Commercials (Incoterms clarity, price structure)
  14. Design a portfolio, not a winner-take-all award
  15. Artifact: Portfolio split model (e.g., 70/30 or 60/25/15)
  16. Primary: best total-cost + performance
  17. Secondary: different lane/origin or different processor footprint
  18. Tertiary (optional): spec-adjacent backup for emergencies
  19. Contract for volatility explicitly
  20. Artifact: Contracting posture decision tree
  21. When to use fixed vs indexed components (raw input vs energy/logistics)
  22. Explicit temperature excursion/claims workflow
  23. Volume bands + allocation language during peak periods
  24. Govern with leading indicators, not just complaints
  25. Artifact: QBR agenda tied to:
  26. claims rate, rejects/holds, OTIF
  27. temperature report compliance
  28. corrective actions and closure time

Outcomes you can expect (directional)

  • Lower landed-cost variance (fewer expediting and surprise accessorials)
  • Faster response when disruptions occur (pre-qualified alternates)
  • Better auditability of supplier awards (defensible scorecards)

Trade-off to acknowledge

Dual-sourcing and tighter governance add overhead (trials, MOQ test orders, more supplier management), but reduce expected disruption cost.

Inputs needed to be precise

  • Product form + must-have specs
  • Annual volume by region
  • Current Incoterms
  • Target lead time/MOQ limits
  • Current supplier performance (OTIF, claims, holds)

7) Strategic use cases procurement leaders actually run (frozen-date specific)

  1. Reduce landed-cost volatility without sacrificing service
  2. Trigger: reefer/cold storage volatility or repeated expedite events.
  3. Move: re-structure contracts with indexed components and lane-specific risk buffers.
  4. Build disruption-ready dual sourcing
  5. Trigger: >60–70% volume in one supplier/origin/lane.
  6. Move: pre-qualify a second processor footprint and run planned MOQ test orders.
  7. Spec flexibility to expand the supplier pool (when QA allows)
  8. Trigger: repeated allocation risk or long lead times.
  9. Move: identify “spec-adjacent” options (pack size, cut size distribution, form change from IQF to paste) and run controlled trials.
  10. Supplier development for yield and defect reduction
  11. Trigger: high rejects/holds or inconsistent moisture/texture.
  12. Move: joint CAPA plan focused on sorting, pit-fragment control, and moisture conditioning.

8) Why this approach matters beyond frozen dates (categories you likely also buy)

The same intelligence pattern (yield + processing bottlenecks + logistics constraints) shows up in other procurement-managed ingredients:

  • Frozen berries (IQF strawberries/blueberries): quality and cold-chain stability determine claims and usable yield; certifications and foreign-material controls are decisive for supplier approval.
  • Frozen mango/pineapple inclusions: cut-size distribution and thaw performance can drive line stoppages more than unit price.
  • Nut pastes and fruit purees: raw input price can move differently from processed paste pricing because capacity, energy, and QA constraints dominate.

If your organization is building a procurement intelligence muscle, frozen dates are a strong “training ground” because they force cross-functional alignment between Procurement, QA, Ops, and Logistics.

9) Why frozen dates make a powerful sourcing example for procurement teams

  • They reveal the difference between unit price and decision-ready total cost.
  • They make risk tangible: a single temperature excursion or pit-fragment issue becomes a measurable cost event.
  • They reward portfolio design: resilience comes from balancing supplier + lane + spec flexibility, not from negotiating harder with one incumbent.

If you want, share four inputs—(1) form (IQF/paste/blocks), (2) must-have specs, (3) top two origins/lane split %, (4) biggest pain (cost variance vs stockout vs quality holds)—and I can translate this into a one-page award recommendation template (scorecard + portfolio split + contract posture).

Tridge Eye Data Intelligence Solution

Make Faster, Data-Driven Sourcing Decisions

The insights in this report are just the starting point. Tridge Eye is the data intelligence solution that gives procurement and sourcing leaders real-time market signals, price benchmarks, and supply risk alerts — so you can act before the market moves.

Explore Tridge Eye →

References

  1. cold.org.gr
  2. us.one-line.com
  3. gulfbusiness.com
  4. scienceagri.com
Subscribe
By subscribing you agree to with our Privacy Policy and provide consent to receive updates from our company.
Thank you! Your submission has been received!
Oops! Something went wrong while submitting the form.
Subscribe to receive the latest blog posts, updates, promotions, and announcements from Tridge.