
This report is powered by Tridge market intelligence.
Every data point, price signal, and supply chain insight in this analysis is drawn from the same engine that procurement teams worldwide rely on daily. As you read, consider what this level of visibility could do for your category.
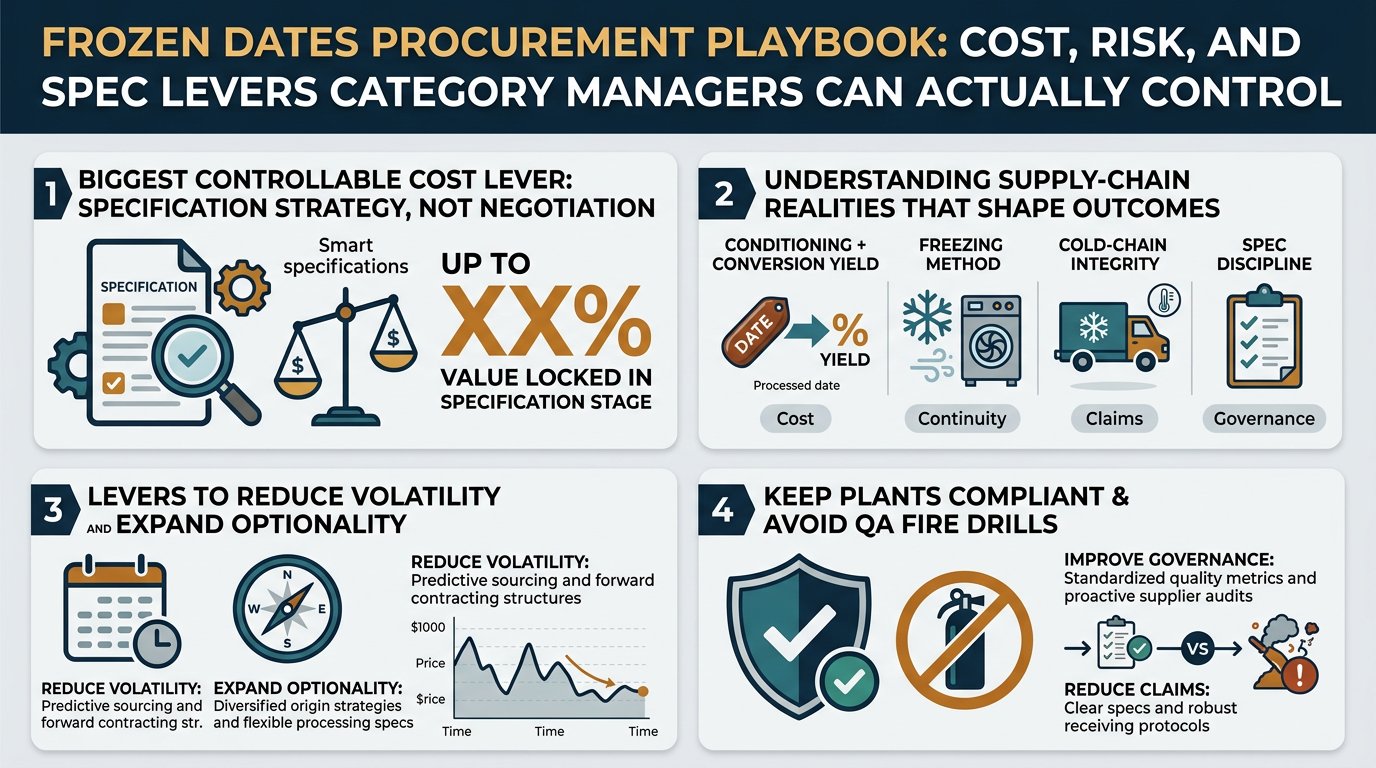
Procurement teams often treat frozen dates as a simple “fruit ingredient” line item. In practice, your outcomes (cost, continuity, claims, and governance) are shaped by conditioning + conversion yield + freezing method + cold-chain integrity + spec discipline. This guide translates those supply-chain realities into the specific levers a Purchase – Product & Category Manager can use to reduce volatility, expand optionality, and keep plants compliant—without turning every buy into a QA fire drill.
Frozen dates look simple—“just fruit, frozen”—but procurement outcomes are driven by how the fruit is conditioned, processed, frozen, and protected through the cold chain.

Upstream / Raw material (orchards + harvest + first grading)
Primary processing (cleaning, conditioning, pitting, sorting)
Secondary processing (cutting/dicing, paste/purée, freezing method)
Packaging & QA (foreign material controls + spec governance)
Logistics & distribution (cold storage + reefer transport + temperature integrity)
End markets (food manufacturing + foodservice + retail)
Below is the practical procurement view: which node dominates your delivered cost depends on whether you buy whole/pitted, diced, or paste.
Key insight: For frozen dates, upstream cost is less about “yield per hectare” and more about grade yield (premium vs industrial) and moisture/defect variability.
Cost drivers you can actually pressure-test
Key insight: This node is the hidden “tax” on tight specs. If you tighten pit tolerance, foreign material thresholds, or moisture bands, you’re effectively asking the supplier to sort harder and throw away more.
Cost drivers
Key insight: The more you move from whole → diced → paste, the more cost shifts from “fruit value” to conversion yield + energy + QA controls.
Cost drivers
Key insight: Packaging is not a rounding error in frozen—especially when you need moisture barriers, strong liners, and pallet stability.
Cost drivers
Key insight: Procurement often negotiates ex-works price and then gets surprised by cold-chain cost-to-serve—storage dwell, demurrage risk, reefer availability, and lane volatility.
Cost drivers
Key insight: If you buy through importers/distributors, margin is partly paying for working capital + consolidation + QA buffer stock. That can be rational—if it reduces your expedite risk.
Modeled % of final delivered cost to a U.S. industrial buyer. Actuals vary by origin, contract terms, certification, lane, season, and your spec tightness. Treat these as planning ratios to structure a should-cost conversation—not as market facts. Validate by collecting: (1) conversion yields, (2) packaging BOM, (3) freezer/storage dwell assumptions, (4) lane quotes, and (5) claims/OTIF history.

| Supply chain node | Cost ratio (% of delivered cost) | What moves it most |
|---|---|---|
| Upstream raw material | 40–55% | Grade yield, moisture, variety |
| Primary processing | 10–20% | Sorting intensity, pitting yield |
| Secondary processing | 5–12% | Freezing method, throughput |
| Packaging & QA | 8–14% | Liner/carton strength, inspection |
| Logistics & distribution | 8–18% | Reefer lane + storage dwell |
| Channel margin (if via distributor) | 0–12% | Working capital + consolidation |
| Supply chain node | Cost ratio (% of delivered cost) | What moves it most |
|---|---|---|
| Upstream raw material | 25–40% | Feedstock grade + availability |
| Primary processing | 12–22% | Pit/defect removal before cutting |
| Secondary processing | 14–26% | Dicing yield, screens, freezing energy |
| Packaging & QA | 10–16% | Foreign material controls, rework |
| Logistics & distribution | 8–18% | Cold chain + storage |
| Channel margin (if via distributor) | 0–12% | Service level + buffer |
| Supply chain node | Cost ratio (% of delivered cost) | What moves it most |
|---|---|---|
| Upstream raw material | 18–30% | Industrial-grade feedstock cost |
| Primary processing | 12–22% | Conditioning + defect removal |
| Secondary processing | 18–30% | Milling/extrusion, moisture/Brix standardization, freezing |
| Packaging & QA | 12–20% | Heavy liners, block handling, testing |
| Logistics & distribution | 8–18% | Weight density + cold storage |
| Channel margin (if via distributor) | 0–12% | Inventory + service |
Important structural fact: The countries that produce the most dates are not always the ones that dominate exportable, spec-compliant, traceable supply.
Procurement implication: A “top producing country” is not automatically a “safe alternate” for your frozen diced/paste spec—especially when approvals, documentation, and defect tolerances are tight.
In frozen dates, format pricing disconnects happen for structural reasons:
Different feedstock economics
Pack-out yield and reject routing create a “shadow market”
Energy and cold storage costs hit processed formats harder
Spec tightness amplifies conversion loss
Decision takeaway: Don’t assume you can index paste to whole-date price (or vice versa). Build a format-specific should-cost that separates fruit value from conversion + cold-chain cost.
An intelligence-driven approach changes which decisions you can make early—before you’re forced into expensive options.
Use intelligence to build a comparable set by:
Decision it improves: whether you can credibly dual-source without relaxing specs too far.
Instead of “last year +%,” build a narrative tied to:
Decision it improves: when to lock vs keep optionality, by format.
Pre-map what’s substitutable without breaking product performance:
Decision it improves: what you can relax under governance—without opening the door to uncontrolled quality drift.
Set thresholds tied to actions:
Decision it improves: moving from reactive expediting to planned resilience.
Procurement metrics: variance to budget, expedite spend, OTIF.
Procurement metrics: time-to-switch supplier, downtime risk exposure.
Procurement metrics: supplier count per spec, claims rate, cost per MT.
Procurement metrics: off-contract rate, audit readiness, corrective action closure time.
Frozen dates are a clean example of a broader procurement truth: format + processing + logistics can dominate the cost and risk—not just the commodity itself.
Comparable categories where the same intelligence logic applies:
Procurement takeaway: intelligence is most valuable where spec governance and conversion economics create price disconnects and hidden risk.
Frozen dates force clarity on the four things category managers are measured on:
Because the category sits at the intersection of agriculture + processing yield + energy/cold chain + spec discipline, it’s an unusually good test of whether your sourcing approach is quote-driven or decision-driven.
Take Your Sourcing Intelligence to the Next Level
The insights in this report are just the starting point. Tridge Eye gives you real-time market signals, origin risk alerts, and price benchmarks — so you can act before the market moves.