INDUSTRY TRENDS

Frozen Bone-In Pork Cuts: Sourcing Intelligence That Prevents Surprises (and Protects Service Levels)

Author
Team Tridge
DATE
March 30, 2026
10 min read
frozen-bone-in-pork-cut Cover
Tridge Eye Data Intelligence Solution

This report is powered by Tridge Eye Data Intelligence.

Every data point, price signal, and supply risk insight in this analysis comes from the same platform that procurement and sourcing leaders worldwide rely on daily. As you read, consider what this level of market intelligence could do for your sourcing decisions.

Explore Tridge Eye →

Frozen bone-in pork can look like a straightforward commodity buy, but procurement outcomes are usually driven by a few repeatable “gotchas”: spec non-comparability (bone/trim/pack), plant & market eligibility, and cold-chain execution (dwell time, reefer availability, temperature integrity). This guide translates those realities into decision-ready actions—how to structure specs, build backup coverage, time/shape contracts, and govern supplier concentration so you avoid expensive surprises.

Executive Summary

  • Most quote variance is self-inflicted: the #1 driver of “market vs my offer” gaps is non-comparable specs (cut style, trim/fat cover, skin-on/off, carton weight, labeling/documentation).
  • Whole-carcass economics matters: pork is valued through primal/cutout dynamics; your cut price can move even when your local demand is flat because the carcass clears globally across primals. [1]
  • Cold-chain is a cost amplifier: refrigerated storage is structurally energy-intensive; small disruptions (dwell time, plug congestion, temperature excursions) can swing landed cost and claims risk. [2]
  • Trade policy can re-route flows quickly: China’s final anti-dumping duties on EU pork were reported in the ~4.9%–19.8% range, effective December 17, 2025 for five years, incentivizing volume redirection and basis volatility in alternative markets. [3]
  • Governance is measurable: manage resilience with KPIs like % volume with qualified backup within X weeks, and concentration limits by plant/origin for critical SKUs.

Key Insights

(Analyzed at: Mar, 2026)

  • Strategy: Hold
  • Reliability: Medium
  • Potential Saving: 3% ~ 8%
  • Insight: Use the current window to tighten spec normalization and expand qualified backup coverage rather than chasing headline “market down” narratives. With ongoing trade-flow distortions (e.g., EU pork facing China duties effective Dec 17, 2025 for five years) and persistent cold-chain cost volatility (energy-intensive refrigerated storage), the most reliable near-term savings typically come from reducing claims/holds, improving cube & dwell time, and preventing emergency spot buys via pre-qualified alternates—not from trying to time a single price bottom. [3]

1) What You’re Actually Buying: The Real Flow Behind Frozen Bone-In Pork

Frozen bone-in pork looks like a simple commodity SKU. In practice, it’s a cold-chain, plant-eligible, spec-sensitive product where small mismatches (cut style, trim, pack, labeling, eligibility) create big differences in yield, claims risk, lead time, and true landed cost.

Here’s the ground-truth flow most procurement teams are implicitly relying on:

  1. Upstream (Farm → Hog economics)
  2. Feed (corn/soy), health/biosecurity, and herd productivity set the hog cost base.
  3. Disease risk (notably ASF) is a constant “tail risk” that can re-route trade flows and availability.
  4. Primary processing (Slaughter → Chilling → Fabrication into primals/subprimals)
  5. Carcass is broken into primals. In U.S. regulatory/industry framing you’ll often see primals such as ham/leg, loin, belly/side, and shoulder (with shoulder commonly split into butt/Boston butt and picnic in commercial cutout/pricing). [4]
  6. Plant throughput, labor, and export eligibility (market approvals) determine what can ship where.
  7. Secondary processing (Freezing + packing)
  8. Frozen format is typically cartonized, often ~10–25 kg export cartons (program-dependent); freezing method and handling discipline drive temperature integrity and drip loss.
  9. Packaging & QA (spec + documentation + traceability)
  10. Customer spec (bone-in style, skin-on/off, fat cover, defect tolerances) and export documentation are as important as price.
  11. Logistics & distribution (cold stores + reefer ocean + destination cold chain)
  12. Bone-in cuts are lower value per cubic meter than premium boneless items, so reefer utilization, dwell time, and cold-store fees matter disproportionately.
  13. End market execution (foodservice/retail/industrial)
  14. The “real” cost is what happens after receipt: trim loss, cooking performance variance, claims, and service-level impact.

Key buyer reality: your biggest controllable levers are usually (a) spec discipline, (b) plant/origin optionality, (c) contract structure + timing, (d) logistics design, not just supplier unit price.

Left-to-right flowchart of frozen bone-in pork from farm and hog economics through slaughter/chilling, fabrication into primals (with butt+picnic callout), freezing and cartonization, packaging/QA and documentation eligibility gates, cold storage and reefer logistics checkpoints, destination cold store/distributor, and end use; includes callouts for spec non-comparability, plant/market eligibility, dwell time/demurrage, temperature excursions/claims, and reefer availability.

2) Where Money Is Made (and Lost): Cost & Margin by Node

2.1 Upstream / Raw Material (Hog + carcass economics)

Key insight: Hog/carcass cost moves with feed and herd economics, but cut prices don’t move evenly—they move based on whole-carcass balancing and demand for each primal.

  • Cost drivers
  • Feed costs (corn/soy) → hog price baseline
  • Herd productivity and disease pressure
  • Regional supply/demand balance
  • Margin reality
  • Upstream margins are often thin; volatility is pushed downstream into cut prices.

2.2 Primary Processing (Slaughter + fabrication into primals)

Key insight: A “bone-in ham” is not just one thing—cut style + trim + bone content changes yield, carton count, and downstream labor.

  • Cost drivers
  • Labor and line speed
  • Yield loss driven by trim/spec
  • Compliance/inspection and export program costs

Market structure signal you can use: USDA’s pork cutout methodology aggregates values from major primal components (e.g., belly, butt, ham, loin, picnic, rib) into a carcass cutout view; those component shares and values can shift quickly with demand. [1]

2.3 Secondary Processing (Freezing, portioning, packing)

Key insight: Freezing is not “just a step”—it’s a working-capital and quality step. Longer freeze-to-ship cycles increase inventory financing and exposure to temperature excursions.

  • Cost drivers
  • Freezing energy + cold-room handling
  • Portioning (if required) and rework
  • Cartonization + pallet configuration

2.4 Packaging & QA (spec compliance + auditability)

Key insight: In frozen bone-in pork, documentation failures (labeling, eligibility, traceability gaps) can be as costly as quality failures because they create holds, re-export, or forced discounting.

  • Cost drivers
  • Packaging materials (liners, cartons)
  • QA sampling/testing, customer inspection protocols
  • Traceability and export documentation

2.5 Logistics & Distribution (reefer + cold stores + demurrage risk)

Key insight: Cold chain is a cost amplifier. Refrigerated warehousing is structurally energy-intensive; refrigeration frequently represents the majority share of cold storage electricity/energy cost, which helps explain why landed logistics can stay “sticky” even when raw material eases. [5]

  • Cost drivers
  • Inland refrigerated trucking + port cold storage
  • Reefer ocean freight + plug availability
  • Destination cold-store fees + dwell time + demurrage

2.6 End-market margin stack (importer/distributor + your internal cost-to-serve)

Key insight: The “cheapest” supplier can become the most expensive when you add claims, trim variance, and service failures—especially for bone-in cuts where spec variance is common.

  • Cost drivers
  • Distributor margin and financing
  • Your internal handling, QA holds, production disruptions
Grouped stacked bar chart showing delivered cost concentration by supply-chain node for three programs: (A) Commodity Frozen Bone-In Ham, (B) Spec-Tight Loin/Ribs Program, and (C) Value-Focused Shoulder (Butt/Picnic). Each bar is segmented into Upstream, Primary Processing, Secondary Processing, Packaging & QA, Logistics & Distribution, and Downstream Margin/Cost-to-Serve, with annotations noting higher logistics sensitivity on low value density cuts and higher processing share with tighter spec/portioning.

Cost breakdown tables (illustrative ratios)

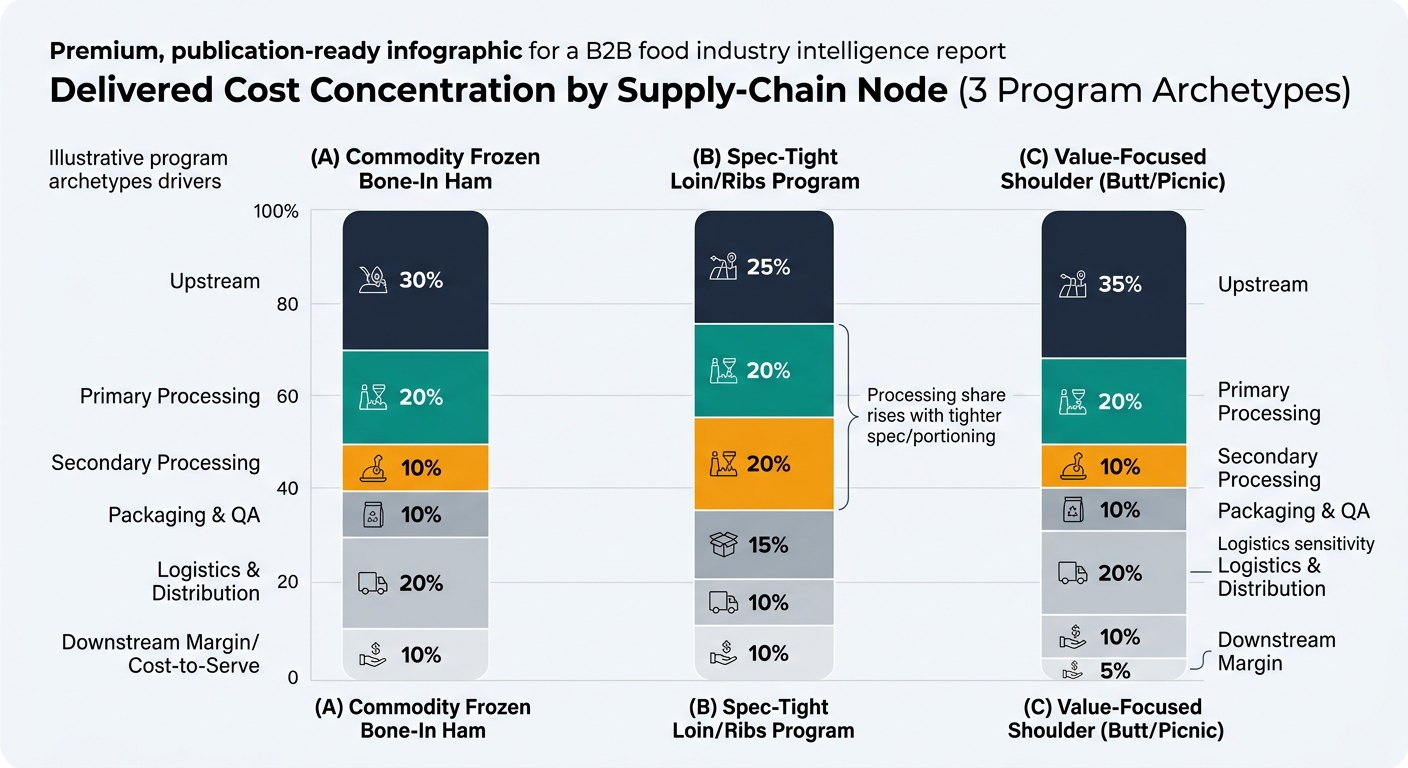
Modeled to show where cost tends to concentrate for frozen bone-in pork programs. Actual ratios vary by origin, incoterms, freight market, and spec.

A) Commodity frozen bone-in ham (carton, block-frozen)

Supply chain node Cost ratio (% of delivered cost) What moves it most
Upstream (hog/carcass) 50% feed + hog cycle
Primary processing 18% labor + yield vs spec
Secondary processing 7% freezing energy + handling
Packaging & QA 5% pack style + inspection
Logistics & distribution 12% reefer rates + cold-store dwell
Downstream margin/cost-to-serve 8% distributor terms + claims

B) Spec-tight frozen bone-in loin/ribs program (portion control, tighter defect tolerance)

Supply chain node Cost ratio (% of delivered cost) What moves it most
Upstream (hog/carcass) 45% carcass value + primal demand
Primary processing 22% tighter trim/yield loss
Secondary processing 10% portioning + rework
Packaging & QA 7% QC intensity + labeling
Logistics & distribution 10% cube efficiency + lane risk
Downstream margin/cost-to-serve 6% service level + rejects

C) Value-focused frozen bone-in shoulder (butt/picnic) for price-sensitive channels

Supply chain node Cost ratio (% of delivered cost) What moves it most
Upstream (hog/carcass) 53% hog price baseline
Primary processing 16% plant efficiency
Secondary processing 6% freezing + handling
Packaging & QA 4% basic spec
Logistics & distribution 14% low value density → freight sensitivity
Downstream margin/cost-to-serve 7% inventory turns

3) One Structural Fact That Explains Most “Unexpected” Outcomes

Frozen bone-in pork is priced and allocated through a whole-carcass system, not a SKU system.

That means:

  • A disruption (disease, export restriction, plant slowdown) doesn’t just change supply; it changes where the carcass clears and which markets absorb which primals.
  • Buyers who treat bone-in cuts like isolated commodities miss the fact that byproduct and primal demand elsewhere can reprice your cut even when your local demand is flat.

USDA’s cutout framework explicitly reflects this “composite primal” view of carcass value, which is why primal-level monitoring is often more decision-useful than a single SKU quote history. [1]

4) The Critical Insight: Why Your Supplier Quote Can Diverge From “Market Price”

Procurement teams often ask: “Why is the market down but my bone-in ham offer isn’t?”

The most common reasons are structural:

  1. Spec non-comparability (the #1 cause)
  2. Bone-in style (e.g., shank-on/off), skin-on/off, fat cover, defect tolerance, carton weight → changes yield and rework.
  3. Cold-chain constraint is a hidden basis
  4. Reefer availability, plug congestion, cold-store dwell time, and energy-driven operating costs can keep offers elevated even if raw material eases.
  5. Eligibility and market-access “optionalities” are priced in
  6. Plants with broader approvals (or cleaner compliance track record) can command a premium because they reduce the buyer’s probability of holds and delistings.
  7. Trade actions can re-route EU/US/Brazil volumes quickly
  8. Example: China’s final anti-dumping duties on EU pork were reported in the ~4.9%–19.8% range, effective December 17, 2025 for five years, creating incentives to redirect EU volumes to alternative markets and changing pricing dynamics outside China. [3]

5) Where Procurement Teams Typically Get This Wrong (and Pay for It)

  1. Treating “bone-in” as a single spec band
  2. Result: non-comparable bids, surprise yield loss, higher claims.
  3. Over-concentrating on one origin or one plant group
  4. Result: a single event (disease, audit failure, logistics choke point) becomes a service-level crisis.
  5. Buying on headline price, not landed cost-to-serve
  6. Result: low unit price but higher demurrage, higher QA holds, slower turns.
  7. Waiting for disruption to qualify backups
  8. Result: QA and ops become the bottleneck when you most need speed.
  9. Using generic market commentary instead of primal-linked signals
  10. Result: poor contract timing and weak negotiation posture.

6) What Changes When You Run Sourcing With Intelligence (Not Spreadsheets)

Below is how an intelligence service improves decisions without “feature-dumping”—capability → decision impact → governance action.

A) Supplier discovery & qualification support → expands your feasible supplier set

Decision it improves: build a short-list of suppliers that can actually meet your spec and eligibility needs.

  • Practical outputs procurement can act on:
  • Longlist by origin + plant capability + export program fit
  • Qualification checklist inputs (certs, audit cadence signals, cold-chain footprint)

Governance action: define an “approved-capable” pool by spec tier (commodity vs spec-tight) so buyers don’t improvise during shortages.

B) Supplier benchmarking & should-cost context → makes quotes comparable

Decision it improves: select suppliers and negotiate terms based on total landed cost and reliability.

  • Practical outputs:
  • Spec-normalized comparison (incoterms, pack, MOQ, lead time)
  • Cost drivers view: processing intensity, cold-store reliance, lane risk

Governance action: require a normalized bid sheet before award—no award on non-comparable specs.

C) Price intelligence & trend monitoring → improves contract timing and structure

Decision it improves: when to lock, how much to lock, and what clause to use.

  • Practical outputs:
  • Primal-linked price narrative (e.g., ham vs belly dynamics)
  • Driver separation: raw material vs logistics vs spec

Governance action: adopt a layered-buy or index-linked approach only when driver signals justify it (and document why).

D) Supply chain risk monitoring → turns events into procurement moves

Decision it improves: reallocate volume, increase safety stock, or switch origin before service breaks.

  • Practical outputs:
  • Event-to-exposure translation (which plants/origins/lanes are in your portfolio)
  • Mitigation play suggestions: pre-book reefer, shift to alternates, spec relaxation bands

Example risk signal: ASF remains a material tail risk in pork supply chains; separately, trade policy actions like China’s EU pork duties (effective Dec 17, 2025 for five years) can compound volatility by re-routing volumes and changing regional basis relationships. [3]

E) Procurement performance & governance reporting → prevents silent concentration

Decision it improves: portfolio design and auditability.

  • Practical outputs:
  • Concentration metrics (by plant, origin, lane)
  • Contract coverage vs spot exposure; exception logs

Governance action: add a quarterly “resilience coverage” KPI (e.g., % of volume with a qualified backup within X weeks lead time).

7) Strategic Use Cases You Can Operationalize in 30–90 Days

Use case 1: Build disruption-ready coverage (primary emphasis)

Objective: ensure you can switch supply within a defined lead time without breaking spec or compliance.

  • Actions:
  • Segment SKUs into spec tiers (A: tight; B: standard; C: emergency substitute band).
  • Map current buys to plant/origin dependency and identify single points of failure.
  • Pre-qualify alternates in at least two distinct supply regions (e.g., EU complex + Americas), aligned to your destination eligibility.
  • Run a “time-to-switch” drill: approval steps, documentation lead time, cold-store routing.
  • What to validate:
  • QA approval requirements, labeling rules, and import eligibility by destination.

Use case 2: Stop paying for spec ambiguity

Objective: reduce claims and hidden yield loss.

  • Actions:
  • Create a one-page spec lock (cut description + photo guide + defect tolerances + pack).
  • Force bid normalization: same incoterms, carton weight, and trim basis.
  • Track supplier performance: temperature compliance, defect rate, and variance to spec.
  • What to validate:
  • Receiving data quality (temp logs, inspection records) so you can prove variance.

Use case 3: Contract structure that matches volatility

Objective: reduce cost volatility without sacrificing service.

  • Actions:
  • Separate drivers: hog/carcass vs processing vs logistics.
  • Use layered buys when market is uncertain; use fixed when supply risk is dominant.
  • Add clauses that matter operationally: substitution bands, lead time commitments, claim resolution SLA.
  • What to validate:
  • Internal appetite for index exposure and finance alignment.

Use case 4: Governance and auditability (secondary emphasis)

Objective: make supplier choices explainable and repeatable.

  • Actions:
  • Standardize award rationale: cost, risk, service, compliance.
  • Create a concentration threshold policy (e.g., no single plant >X% of a critical SKU).
  • Maintain an “approved alternates” register with last-audit and last-quote dates.

8) Why This Intelligence Approach Matters Beyond Pork (Examples You’ll Recognize)

Frozen bone-in pork is a clean example of a broader procurement truth: price is rarely the only variable that matters.

Other categories where the same intelligence logic pays off:

  • Frozen shrimp (aquaculture + cold-chain + compliance): disease events and farm-level variability; spec (size counts, glazing) drives comparability.
  • Beef trimmings (whole-carcass balancing): downstream burger demand and primal values create disconnects between “market narrative” and your specific trim.
  • Dairy powders (trade + inventory + energy): energy and drying capacity change cost curves; policy shifts redirect volumes.
  • Coffee (origin concentration + logistics): weather shocks and port constraints move availability; contract timing and differential management matter.

In each case, the winning teams do three things consistently:

  1. Normalize specs so bids are comparable.
  2. Monitor risk signals tied to their own portfolio exposure.
  3. Design supplier portfolios for resilience, not just savings.

9) Why Frozen Bone-In Pork Is a Powerful “Proof Category” for Procurement Leaders

This category makes intelligence value visible because:

  • Spec variance creates immediate operational cost (yield loss, claims, rework).
  • Cold-chain amplifies small disruptions into big landed-cost swings (dwell time, reefer constraints, energy-driven costs).
  • Trade policy and disease risks are real and recurring, and they rapidly re-route global flows (e.g., China’s EU pork duties effective December 17, 2025 for five years). [3]
  • Governance is testable: you can measure concentration, backup readiness, and time-to-switch—making resilience a managed KPI rather than a hope.

If you can run frozen bone-in pork with disciplined intelligence—spec-normalized buying, portfolio optionality, and event-to-action risk governance—you can apply the same operating model across most perishable and commodity-linked categories.

Tridge Eye Data Intelligence Solution

Make Faster, Data-Driven Sourcing Decisions

The insights in this report are just the starting point. Tridge Eye is the data intelligence solution that gives procurement and sourcing leaders real-time market signals, price benchmarks, and supply risk alerts — so you can act before the market moves.

Explore Tridge Eye →

References

  1. ams.usda.gov
  2. foodlogistics.com
  3. apnews.com
  4. fsis.usda.gov
  5. inertiaresourcesinc.com
Subscribe
By subscribing you agree to with our Privacy Policy and provide consent to receive updates from our company.
Thank you! Your submission has been received!
Oops! Something went wrong while submitting the form.
Subscribe to receive the latest blog posts, updates, promotions, and announcements from Tridge.