INDUSTRY TRENDS

Frozen Blueberry Procurement Intelligence Playbook (Validated & Updated for Procurement Leaders — Mar 2026)

Author
Team Tridge
DATE
March 20, 2026
10 min read
frozen-blueberry Cover
Tridge Eye Data Intelligence Solution

This report is powered by Tridge Eye Data Intelligence.

Every data point, price signal, and supply risk insight in this analysis comes from the same platform that procurement and sourcing leaders worldwide rely on daily. As you read, consider what this level of market intelligence could do for your sourcing decisions.

Explore Tridge Eye →

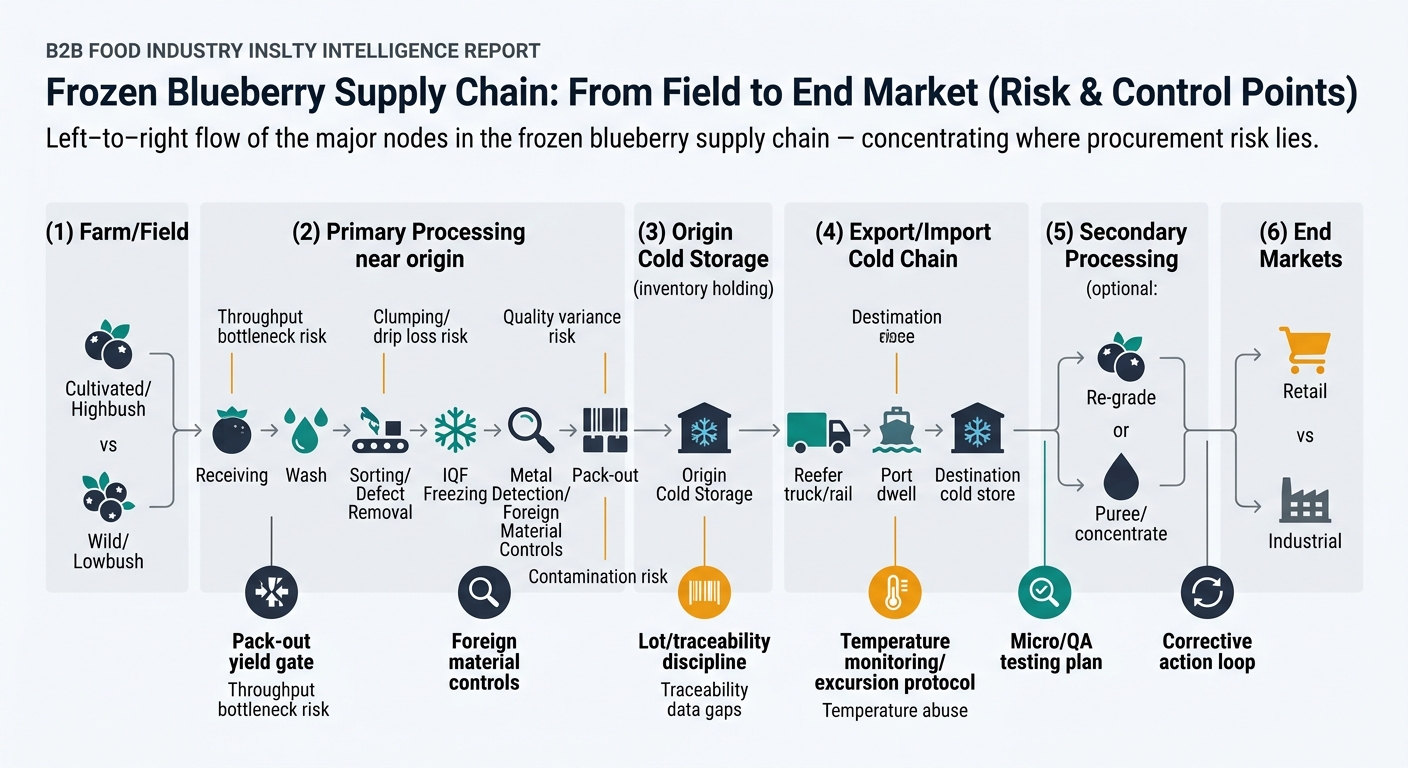
Frozen blueberries behave like a “simple” commodity only at the SKU level. In practice, procurement outcomes (cost, service, quality, and recall exposure) are driven by upstream physics: how quickly fruit is frozen after harvest, how defects/foreign material are removed, how lots are controlled and traced, and how the cold chain performs over months. This guide is written for experienced procurement and sourcing leaders who may be new to frozen blueberries; it translates category-specific realities into practical sourcing rules, governance, and intelligence-enabled decisions.

Executive Summary

  • Hybrid market structure (core driver of surprises): frozen supply is a mix of processing-oriented wild (lowbush) and cultivated (highbush) fruit that competes with the fresh market; when fresh pulls hard, frozen availability can tighten even with “normal” farm production. [1]
  • Wild blueberries are structurally a frozen product: multiple sources indicate ~99% of the wild blueberry crop is frozen/IQF with very little sold fresh. [2]
  • Processing share trend matters for contracting: the fraction of U.S. cultivated blueberry production going to processing is cited as rising from ~40% (2010) to ~47% (2022) (USDA NASS cited by Choices). [1]
  • Specs are not “nice-to-have”: USDA processing grade standards explicitly reference tolerance limits for leaves/foreign material, immature berries, mold/decay, etc.—useful anchors for spec language and supplier conversations. [3]
  • Food-safety governance is a real cost driver: FDA’s frozen berry surveillance work has reported RT-qPCR detections of hepatitis A / norovirus genetic material in sampled frozen berries (interpretation is nuanced, but it drives buyer expectations on preventive controls and traceability). [4]
  • Cost tables in this guide are illustrative only: use them as a “where to look” map; your actual ratios will vary by origin, crop year, packaging, test plan, lane, and spec tightness.

Key Insights

(Analyzed at: Mar, 2026)

  • Strategy: Hold
  • Reliability: Medium
  • Potential Saving: 3% ~ 8%
  • Insight: If your 2026 supply is already largely contracted, the best near-term savings are usually not from chasing a lower $/lb—it's from reducing failure-cost (claims, rework, line downtime, expedited buys) by tightening supplier qualification and lane controls. Use a benchmarking-led Q2–Q3 program to (1) re-score incumbents on foreign material controls, lot discipline, and cold-chain data practices, and (2) pre-qualify at least one alternate origin corridor for 2026/27 coverage. This typically yields mid-single-digit TCO improvement without destabilizing supply, especially when you tie volume allocation to KPI performance rather than re-bidding everything at once. [3]

1) What You’re Actually Buying: The Frozen-Blueberry Supply Chain (Ground Truth)

Frozen blueberries look like a simple commodity, but procurement outcomes are mostly determined upstream of the RFQ—in how fruit is harvested, what gets diverted from fresh, how fast it reaches a freezer, and how the cold chain behaves for months.

The physical flow (what matters for sourcing decisions)

  1. Farm / Field
  2. Two structurally different supply streams:
  3. Cultivated (highbush): often grown for fresh; a portion is diverted to freezing when fresh prices are weak or fruit is off-grade.
  4. Wild (lowbush): structurally processing-oriented; multiple sources indicate ~99% of the wild blueberry crop is frozen/IQF, with minimal fresh sales. [2]
  5. Primary processing near origin (the “freezing gate”)
  6. Receiving → washing → sorting/defect removal → IQF freezing (most common for retail and dosing) → metal detection/foreign material controls → carton/bag pack-out.
  7. This is where pack-out yield is created or destroyed (soft fruit, mold, stems/leaves, clumping risk).
  8. Cold storage (origin)
  9. Frozen blueberries are an inventory business: product sits for months to cover the off-season.
  10. Export / import cold chain
  11. Reefer truck → port/rail → destination cold store → DC.
  12. Any temperature excursion increases clumping, drip loss, and claims.
  13. Secondary processing (optional)
  14. Re-grading to tighter specs; conversion to puree/concentrate for industrial users (also a monetization path for out-of-spec fruit).
  15. End markets
  16. Retail: appearance, berry integrity, free-flowing behavior.
  17. Industrial: defect limits, microbiological specs, consistency for yield and dosing.

Procurement implication: You’re not only buying “IQF blueberries.” You’re buying a set of agronomic risks + plant throughput constraints + cold-chain exposure + QA system maturity.

Flowchart showing the frozen blueberry supply chain from field to end market with procurement risk and control points (pack-out yield gate, foreign material controls, lot/traceability discipline, temperature monitoring, micro/QA testing, corrective action loop) across farm (cultivated vs wild), primary processing, cold storage, import cold chain, secondary processing, and retail vs industrial end markets.

2) Where Cost Really Accumulates: Cost & Margin by Node (with Product-Form Differences)

Key insight: In frozen blueberries, cost is dominated by the farmgate fruit price and pack-out yield, but the most avoidable cost for procurement is often downstream: claims, rework, expedited freight, and quality-driven yield loss. That avoidable cost is shaped by supplier capability and governance, not by the lowest quoted $/lb.

2.1 Upstream: Farm / Raw Fruit (Cultivated vs Wild)

What’s structurally true

  • Cultivated fruit economics are tightly linked to the fresh market. When fresh demand/prices are strong, processors must pay up or accept lower volumes; when fresh is weak, more fruit diverts to freezing.
  • Wild fruit is more processing-centric; the supply chain is built around freezing and industrial use. [2]

Cost drivers procurement should care about

  • Harvest labor availability and wage pressure (cultivated)
  • Weather during bloom/set/harvest (firmness, mold pressure → defect removal)
  • Agronomy inputs and compliance (residue programs, traceability)

Margin behavior

  • Farmgate can swing quickly; processors and traders may attempt to hold downstream pricing “sticky” if buyers are locked into annual contracts.

2.2 Primary Processing: Sorting, IQF Freezing, Pack-out

What’s structurally true

  • Peak season creates a throughput bottleneck: if fruit arrives faster than the plant can process, quality degrades before freezing.
  • Freezing is energy-intensive. The exact share of energy in OPEX varies widely by site, tariff, and utilization; treat any single % as directional and validate with supplier should-cost inputs.

Cost drivers

  • Yield loss from defect removal (soft/mold/stems/leaves/foreign material)
  • Optical sorting/metal detection effectiveness (claims prevention)
  • Plant labor and sanitation downtime

Margin behavior

  • Suppliers with better sorting and process control can quote higher but deliver lower total cost via fewer rejects/claims.

2.3 Cold Storage: Origin Holding Cost + Shrink Risk

What’s structurally true

  • Frozen blueberries are stored to bridge seasons; cold storage and working capital are not optional.

Cost drivers

  • Energy and storage rates
  • Inventory financing (especially for exporters holding stock)
  • Shrink/condemnation risk if temperature control fails

2.4 Logistics & Import Handling: Reefer Risk is a Quality Risk

What’s structurally true

  • In frozen fruit, logistics is not just freight—it's product integrity.

Cost drivers

  • Reefer availability/seasonality on lanes
  • Port dwell time and demurrage exposure
  • Temperature monitoring devices / data management

2.5 Secondary Processing: Re-grade / Puree / Concentrate

What’s structurally true

  • Re-grading adds cost but can reduce downstream rejects.
  • Puree/concentrate provides an outlet for out-of-spec fruit; this can stabilize supplier economics and affects negotiation leverage.

2.6 Wholesale/Retail Margin (or Ingredient Distributor Margin)

What’s structurally true

  • The more intermediated the chain (brokers, re-packers, importers), the more governance must shift to auditability and lot-level traceability.

Product-level cost breakdown (illustrative, modeled)

100% stacked bar chart comparing delivered cost composition for Standard IQF Industrial, Premium Retail IQF, and Block-Frozen blueberries, segmented by Farm/Raw Fruit, Primary Processing, Packaging & QA, Cold Storage, Logistics & Import Handling, and Margin using the illustrative ratios from the tables, with a footnote noting ratios are illustrative and should be validated by origin, crop year, specs, and lanes.

These are illustrative ratios to show where costs concentrate by product form. Actual ratios vary by origin, certification, crop year, freight market, and spec tightness.

A) Standard IQF Blueberries (Industrial, 10–20 kg)

Supply Chain Node Cost Ratio (% of final delivered cost) What moves it most
Farm / raw fruit 50% Crop size + fresh diversion dynamics
Primary processing (wash/sort/IQF/pack-out) 18% Pack-out yield, labor, freezing energy
Packaging & QA 7% Testing plan, lotting/traceability rigor
Cold storage (origin + destination) 8% Storage duration, energy rates
Logistics & import handling 10% Reefer rates, port dwell, lane volatility
Distributor/wholesale margin 7% Intermediation level, service model

B) Premium Retail IQF (tight defect + appearance spec)

Supply Chain Node Cost Ratio (% of final delivered cost) What moves it most
Farm / raw fruit 45% Variety/firmness, harvest timing
Primary processing 22% Extra sorting, tighter defect removal, clump control
Packaging & QA 10% Retail pack-out, label compliance, higher QA frequency
Cold storage 8% Similar, but higher service expectations
Logistics & import handling 8% Temperature excursion sensitivity
Retail/brand margin 7% Channel economics

C) Block-Frozen Blueberries (for puree/jam/yogurt inputs)

Supply Chain Node Cost Ratio (% of final delivered cost) What moves it most
Farm / raw fruit 52% Commodity fruit availability
Primary processing 15% Less IQF complexity, but still sanitation/controls
Packaging & QA 6% Simpler packaging
Cold storage 9% Often similar storage time
Logistics & import handling 11% Weight/handling, reefer exposure
Distributor/wholesale margin 7% Intermediation

3) The One Structural Fact That Explains Most Procurement Surprises

Structural fact: The frozen-blueberry market is a hybrid of (a) purpose-grown processing supply (notably wild) and (b) fresh-market overflow/diversion (cultivated). That means your “supply base” can tighten even when farms have fruit—because the fruit may be economically pulled into fresh channels.

A related U.S. indicator: Choices Magazine (citing USDA NASS) reports the share of cultivated blueberries bound for processing increased from ~40% (2010) to ~47% (2022)—evidence that processed volumes are not just “waste fruit,” they are structurally significant and shifting over time. [1]

Procurement implication: You must manage frozen blueberries more like a category with competing end-market pulls, not like a stable industrial input.

4) The Critical Insight: Why “Quoted Price” and “True Landed Cost” Disconnect

In frozen blueberries, the most common disconnect is:

Quoted $/lb (FOB/CIF) can look competitive while total landed cost worsens because of:

  • Pack-out yield risk: higher soft fruit/defects → more rejects, rework, or spec exceptions.
  • Foreign material and micro controls: stronger preventive controls reduce claims/recall exposure.
  • Cold-chain integrity: temperature excursions convert into clumping/drip loss → customer complaints and chargebacks.

Food safety is not theoretical in frozen berries. FDA surveillance work on frozen berries has reported RT-qPCR detections of hepatitis A / norovirus genetic material in sampled products; regardless of the scientific nuance of what a detection means for infectious risk, it has increased buyer scrutiny on preventive controls, sanitation, and traceability expectations. [4]

Procurement implication: The “right” commercial comparison is not only price—it’s price × probability-weighted failure cost (claims, downtime, customer penalties, emergency buys).

5) Where Procurement Teams Commonly Misstep (Especially When New to Frozen Blueberries)

  1. Treating IQF as a spec checkbox instead of a process capability
  2. Two suppliers can both offer “IQF,” but differ materially in sorting efficacy, sanitation discipline, and clump control.
  3. Over-weighting certifications without testing operational reality
  4. GFSI-benchmarked schemes (e.g., BRCGS, IFS, SQF, FSSC 22000) are important, but they don’t replace lot-level performance tracking.
  5. Not segmenting supply by risk cluster
  6. Example clusters: wild vs cultivated; single-plant vs multi-plant suppliers; origin lanes with high port dwell risk.
  7. Running RFQs without a yield/claims model
  8. If Finance only sees $/lb, Procurement gets pushed to “lowest quote,” then pays later through quality cost.
  9. Dual-sourcing on paper, not in practice
  10. Backups aren’t pre-qualified to your defect, micro, and packaging/labeling requirements—so switching takes months.

6) How a Procurement Intelligence Service Changes the Decision (Without Feature-Dumping)

Decision you’re making: “How do I award volume and set contract structure without buying hidden risk?”

Frozen-blueberry reality that matters: The category’s risk is concentrated in origin seasonality + processing bottlenecks + QA maturity + cold chain.

Capability #1: Supplier benchmarking & qualification support

How it changes your decision:

  • Moves you from “certified vs not” to a comparative scorecard on what actually drives outcomes:
  • Site footprint (single vs multi-plant), freezing capacity, storage capacity
  • Sorting/foreign material controls (optical sorting, metal detection regimes)
  • Traceability and lot discipline (how fast they can isolate affected lots)
  • Historical reliability signals (service, quality drift)
  • Enables award splits by risk cluster (e.g., don’t place 70% with a single-plant supplier in one weather corridor).

Trade-offs that remain:

  • Higher-capability suppliers may require higher MOQs or longer lead times; you’ll balance that against continuity risk.

Operational outcome to measure:

  • Lower reject/claim rates; higher OTIF; fewer emergency spot buys.

Capability #2: Price intelligence & trend analysis

How it changes your decision:

  • Helps separate:
  • Market-driven movement (crop outcomes, fresh diversion, energy/cold storage, reefer conditions)
  • vs supplier-specific movement (margin expansion, inefficiency, poor yield)
  • Supports contract design choices:
  • Fixed vs indexed vs collar
  • Timing: negotiate pre-harvest vs post-pack when inventory positions are clearer

Trade-offs that remain:

  • Indexing reduces price surprises but can increase budgeting complexity; collars reduce extremes but require agreed references.

Operational outcome to measure:

  • Reduced variance of actual landed cost vs plan; fewer mid-term price resets.

7) Strategic Use Cases Procurement Leaders Actually Run in Frozen Blueberries

  1. Resilient portfolio design before disruption
  2. Build a qualified bench across at least two origin corridors (e.g., North America + counter-seasonal South America or Eastern Europe depending on your market).
  3. Pre-align QA: micro specs, defect limits, packaging/label rules.
  4. Spec rationalization to expand the supplier pool (without breaking the brand)
  5. Example: separate “retail appearance spec” from “industrial dosing spec” so you don’t overpay for attributes you don’t need.
  6. Lane strategy and incoterms governance
  7. Decide where you want control: FOB vs CIF vs delivered.
  8. If you don’t control reefer execution, require temperature monitoring data and excursion protocols.
  9. Quality governance tied to commercial consequences
  10. Put KPIs into SLAs: defect thresholds, clump rate expectations, OTIF, corrective action timelines.
  11. Tie volume allocation to performance, not just annual negotiation.
  12. Contamination/recall readiness
  13. Maintain lot-level traceability expectations and rapid response playbooks; frozen berries have had virus-focused regulatory attention and surveillance. [4]

8) Why Intelligence-Driven Sourcing Matters Beyond Frozen Blueberries (Examples You’ll Recognize)

Frozen blueberries are a clean teaching case because the product is “simple,” but the risk is embedded in the chain. The same intelligence logic applies to other categories procurement teams often manage:

  • Frozen strawberries / mixed berries
  • Similar cold-chain and contamination exposure; outbreaks and recalls in frozen fruit have driven tighter buyer expectations on traceability and preventive controls.
  • Tree nuts (e.g., almonds, cashews)
  • Price is visible, but true cost depends on quality defects, foreign material, aflatoxin controls, and sorting yield.
  • Coffee / cocoa
  • Quoted price moves daily, but the procurement outcome depends on origin risk, compliance, and contract structure (differentials, quality claims).
  • Tomato paste / fruit purees
  • Commodity-like pricing masks concentration risk (few processors) and spec-driven yield impacts in manufacturing.

The common thread: categories where supplier capability and risk governance explain more variance in outcomes than the headline price.

9) Why This Frozen-Blueberry Example Is a Strong Proof Point for Procurement Intelligence

Frozen blueberries force procurement teams to do three things well—things leadership can audit and operations can feel:

  1. Translate supply-chain physics into sourcing rules
  2. Seasonality, processing bottlenecks, cold-chain exposure → portfolio and contract decisions.
  3. Make supplier selection defensible
  4. Benchmarking makes awards explainable beyond “lowest bid,” improving approval velocity and audit readiness.
  5. Reduce hidden cost, not just price
  6. Better qualification + monitoring reduces rejects, claims, and crisis buys—often the largest controllable cost pool.

What to monitor next (practical governance signals)

  • Origin crop and harvest timing shifts (affects availability windows)
  • Supplier pack-out yield indicators and defect trend drift
  • Reefer lane reliability and port dwell time patterns
  • QA signals: micro results trends, foreign material incidents, corrective action closure time

If you manage frozen blueberries with these signals and a structured supplier benchmark, you typically see improved landed cost stability, service continuity (OTIF), and audit-ready decision trails—without relying on heroics during disruptions.

Tridge Eye Data Intelligence Solution

Make Faster, Data-Driven Sourcing Decisions

The insights in this report are just the starting point. Tridge Eye is the data intelligence solution that gives procurement and sourcing leaders real-time market signals, price benchmarks, and supply risk alerts — so you can act before the market moves.

Explore Tridge Eye →

References

  1. choicesmagazine.org
  2. wildblueberries.com (PDF)
  3. ams.usda.gov
  4. food-safety.com (PDF)
Subscribe
By subscribing you agree to with our Privacy Policy and provide consent to receive updates from our company.
Thank you! Your submission has been received!
Oops! Something went wrong while submitting the form.
Subscribe to receive the latest blog posts, updates, promotions, and announcements from Tridge.