
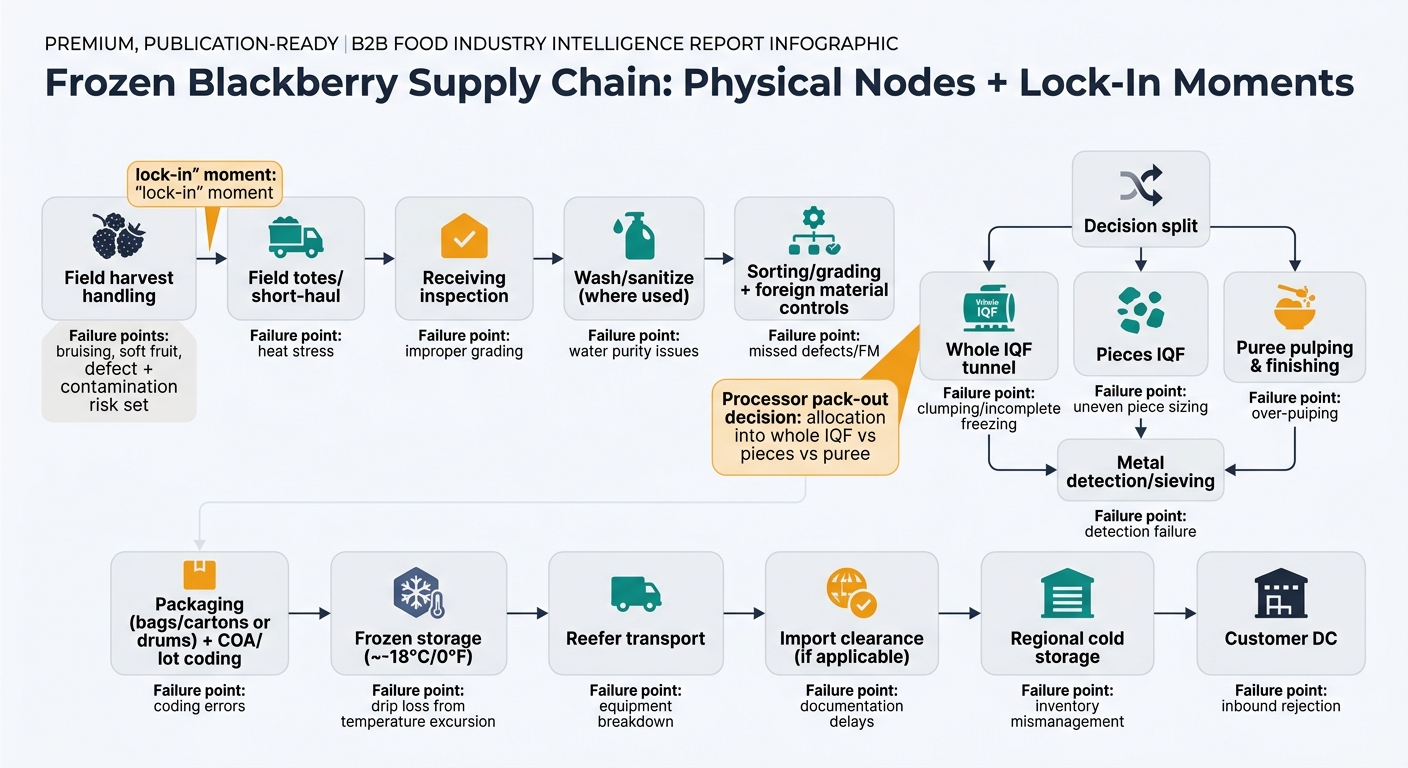
Frozen blackberries look like a simple commodity, but most cost and risk is “baked in” during a short harvest window and a few irreversible processing decisions (pack-out, freezing, and lane discipline). This guide maps the physical nodes, what typically fails at each node, and how to read supplier specs and offers as a proxy for their true cost structure and risk profile.
Frozen blackberries are a short-window agricultural crop that must be converted from fresh to frozen quickly to preserve structure, color, and flavor. The supply chain is built around two irreversible “lock-in” moments: (1) harvest/field handling (which sets initial defect load and contamination risk), and (2) processor pack-out decisions (which allocate fruit into IQF whole vs pieces vs puree based on firmness and defects). After freezing, the product is physically stable—but economically fragile to cold-chain breaks.
Insight: The chain is less about long manufacturing lead times and more about rapid conversion capacity (receive → sort → freeze) during peak harvest weeks.
Data: USDA grade standards for frozen berries explicitly use “crushed” tolerances and other condition attributes to define grades; for blackberries, Choice Grade for Manufacturing allows up to 30% crushed by weight, reflecting how quickly berries soften and break under handling. [1]
Procurement Impact: Most “downstream” problems (clumping, drip loss, high defect counts, inconsistent size) originate upstream—before the product ever enters your warehouse—because once frozen, you can’t economically rework structure back into premium IQF.
Insight: Frozen blackberry economics are dominated by labor-driven harvest + yield loss at sorting/grading, then energy-driven freezing/storage—packaging and logistics matter, but they sit on top of those two structural cost pillars.
Data: USDA frozen berry standards emphasize condition/character (including crushed tolerance) as core grade determinants—an industry signal that sorting, grading, and downgrade are central to cost. [1]
Procurement Impact: Even without discussing buying strategy, you can read a supplier’s cost structure from their process controls: the more stringent your whole-berry IQF spec (low defects, low foreign material, tight size/appearance), the more you are paying for pack-out yield loss and sorting intensity.
Key cost drivers: harvest labor; field containers/totes; short-haul to processor; access to rapid cooling; farm compliance (worker hygiene facilities).
Key cost drivers: wash water + sanitizers (where used); labor for inspection/sorting; sorting capex/maintenance; foreign material controls; waste disposal; QA sampling and hold time.
Key cost drivers: freezing energy (IQF tunnels, refrigeration); line throughput constraints at peak season; metal detection; sieving/finishing for puree; sanitation downtime.
Key cost drivers: film/bag/carton; liners; label compliance; metal detector verification; lab tests (micro and, where required, residues); lot coding and traceability systems.
Key cost drivers: frozen storage fees; reefer trucking/ocean reefer; port cold handling; demurrage risk; insurance; temperature monitoring devices and claims handling.
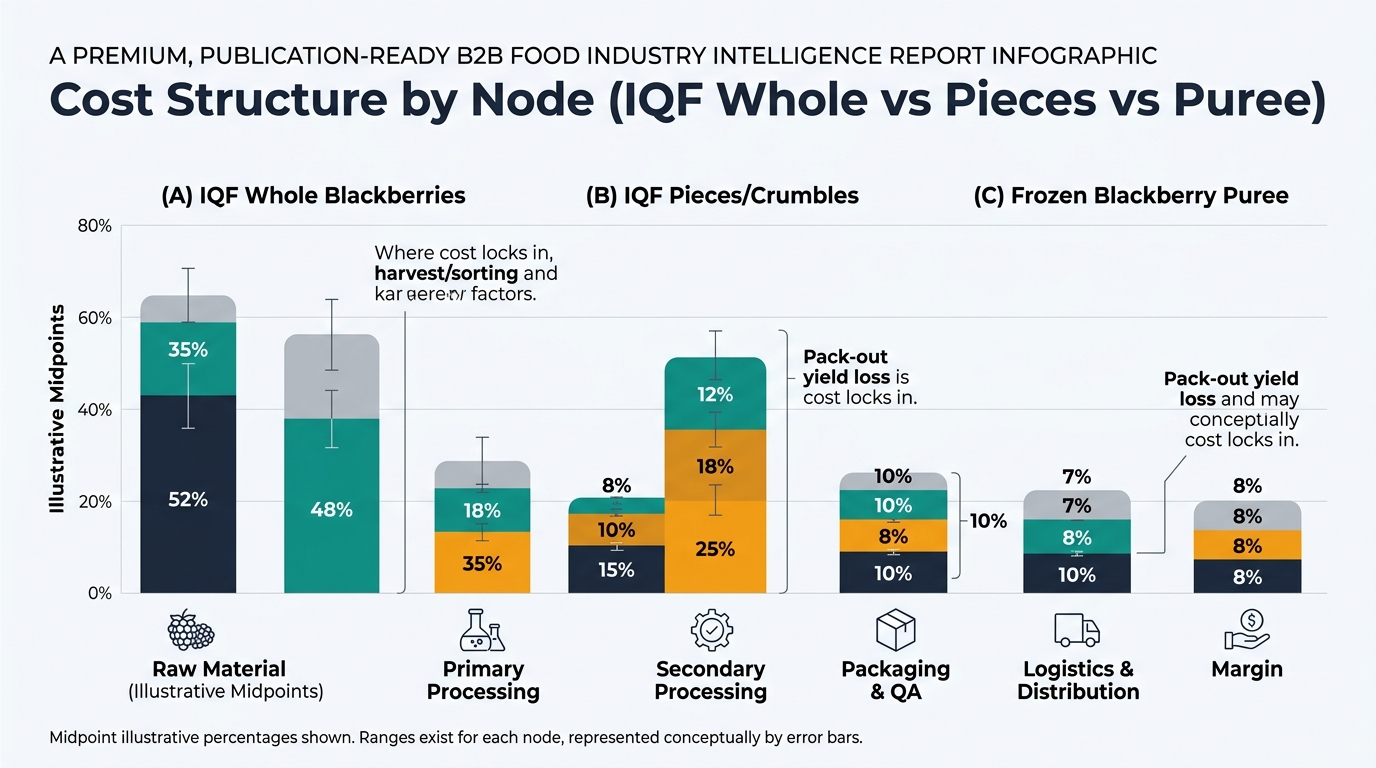
| Supply Chain Node | Cost Ratio (% of Final Cost) | Notes |
|---|---|---|
| Raw Material (farm + harvest) | 30–40% | Labor-driven; firmness/condition determines whole-berry eligibility. |
| Primary Processing (sort/grade/clean) | 15–25% | Yield loss + sorting intensity; foreign material control is costly. |
| Secondary Processing (IQF freezing) | 10–18% | Energy + throughput constraints during peak weeks. |
| Packaging & QA | 8–12% | Film/carton + testing + COA/traceability release. |
| Logistics & Distribution | 12–20% | Cold storage + reefer lanes + handling. |
| Wholesale/Retail Margin | 8–15% | Channel-dependent (retail typically higher). |
| Supply Chain Node | Cost Ratio (% of Final Cost) | Notes |
|---|---|---|
| Raw Material | 28–38% | Can accept slightly softer fruit than whole IQF. |
| Primary Processing | 12–22% | Sorting still matters; piece spec can widen usable fruit pool. |
| Secondary Processing | 10–18% | Freezing + size control (screens/cutters) where applicable. |
| Packaging & QA | 6–10% | Often larger industrial packs reduce packaging share. |
| Logistics & Distribution | 12–20% | Same cold-chain dependence as whole IQF. |
| Manufacturer/Distributor Margin | 8–14% | Lower than retail; higher in value-added blends. |
| Supply Chain Node | Cost Ratio (% of Final Cost) | Notes |
|---|---|---|
| Raw Material | 25–35% | Uses downgraded/soft fruit; still seasonal and labor-linked. |
| Primary Processing | 10–18% | Cleaning + foreign material removal remains critical. |
| Secondary Processing (pulp/finish) | 15–25% | Pulping, finishing/sieving; yield and solids matter. |
| Packaging & QA | 8–12% | Drums/totes + seals + COA; Brix/acid often central. |
| Logistics & Distribution | 12–22% | Heavy, cold, and often longer storage; inbound/outbound handling. |
| Manufacturer Margin | 8–15% | Depends on spec (seedless, standardized Brix, etc.). |
Insight: In berries, the same harvested fruit becomes different SKUs depending on firmness and defects; whole IQF is a subset, not the default.
Data: USDA’s frozen berry standards for blackberries explicitly allow a meaningful crushed tolerance in manufacturing grades (e.g., up to 30% crushed in Choice Grade for Manufacturing), which is a practical proxy for unavoidable soft/broken fruit in the system. [1]
Procurement Impact: Whole IQF availability is structurally more constrained than puree/pieces—even in “normal” years—because it competes for the firmest fruit.
Insight: Frozen berries have a documented association with enteric viruses (norovirus, hepatitis A); freezing preserves, it doesn’t neutralize.
Data: FDA explicitly links outbreaks of HAV/NoV to fresh and frozen berries and frames prevention around hygiene, sanitary facilities, cross-contamination controls, and worker health practices across field and processing. [2]
Procurement Impact: For applications without a downstream kill step, the physical supply chain must carry stronger hygiene and traceability expectations (worker hygiene, sanitation controls, lot segregation), because you can’t “freeze your way” out of viral risk.
Insight: Temperature abuse doesn’t always show as “thawed on arrival”—it often shows later as clumping, drip loss, and mushy texture.
Data: Frozen foods handling guidance commonly anchors storage/handling at about 0°F / -18°C to avoid commercially significant quality loss, and GCCA/AFFI have moved toward standardized temperature monitoring protocols to improve comparability and accountability across handoffs. [6]
Procurement Impact: Your final quality outcome depends as much on lane discipline (storage dwell times, reefer set points, port handling) as on the processor’s sorting line.
(Analyzed at: Apr, 2026)
Write cold-chain integrity into the contract as a measurable, lane-specific performance requirement—not a generic “keep frozen” clause. GCCA/AFFI’s temperature-monitoring protocol direction (published July 2025) makes it realistic to require shipment-level temperature evidence and to define what constitutes an excursion and a claimable event across handoffs. [3]
This works because the biggest avoidable value loss in IQF berries is often not farm cost—it’s preventable partial-thaw damage that shows up later as clumping, drip loss, and rework. If you’re moving meaningful volume, even a small share of compromised loads can quietly leak mid-single-digit percent of landed cost through yield loss, labor, and customer penalties—so you want objective data that separates supplier process issues from logistics execution.


